Deck 16: Analyzing and Forecasting Time-Series Data
ملء الشاشة (f)
سؤال
سؤال
سؤال
سؤال
سؤال
سؤال
سؤال
سؤال
سؤال
سؤال
سؤال
سؤال
سؤال
سؤال
سؤال
سؤال
سؤال
سؤال
سؤال
سؤال
سؤال
سؤال
سؤال
Renton Industries makes replacement parts for the automobile industry. As part of the company's capacity planning, it needs a long-range total demand forecast. The following information was generated based on 10 years of historical data on total number of parts sold each year.  Based on this information, we can conclude that sales on average have been growing by more than 48 thousand annually.
Based on this information, we can conclude that sales on average have been growing by more than 48 thousand annually. سؤال
The Baker's Candy Company has been in business for three years. The quarterly sales data for the company are shown as follows: 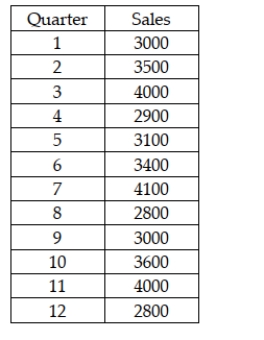 Based on these data, the seasonal index for quarters 3, 7, and 11 is approximately 1.61
Based on these data, the seasonal index for quarters 3, 7, and 11 is approximately 1.61 سؤال
Gibson, Inc. is a holding company that owns several businesses. One such business is a truck sales company. To help in managing this operation, managers at Gibson have collected sales data for the past 20 years showing the number of trucks sold each year. They have then developed the linear trend forecasting model shown as follows: 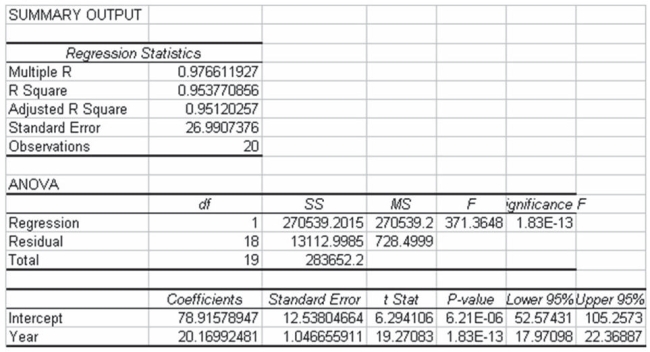 Based on this information, it appears that the time series has a strong positive linear trend component.
Based on this information, it appears that the time series has a strong positive linear trend component. سؤال
سؤال
The Baker's Candy Company has been in business for three years. The quarterly sales data for the company are shown as follows: 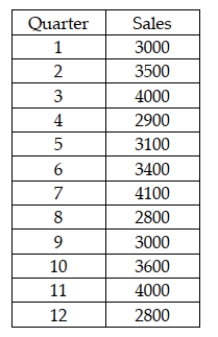 As a first step in computing a seasonal index, the four-period moving average corresponding to the mid- point between periods 2 and 3 is 3,350.
As a first step in computing a seasonal index, the four-period moving average corresponding to the mid- point between periods 2 and 3 is 3,350. سؤال
سؤال
سؤال
سؤال
The Baker's Candy Company has been in business for three years. The quarterly sales data for the company are shown as follows: 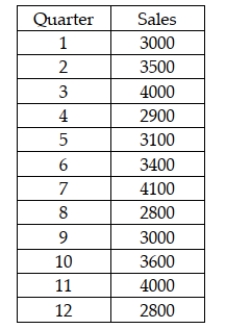 Based on this information, the data reflect both a linear trend and seasonal components.
Based on this information, the data reflect both a linear trend and seasonal components. سؤال
Renton Industries makes replacement parts for the automobile industry. As part of the company's capacity planning, it needs a long-range total demand forecast. The following information was generated based on 10 years of historical data on total number of parts sold each year. 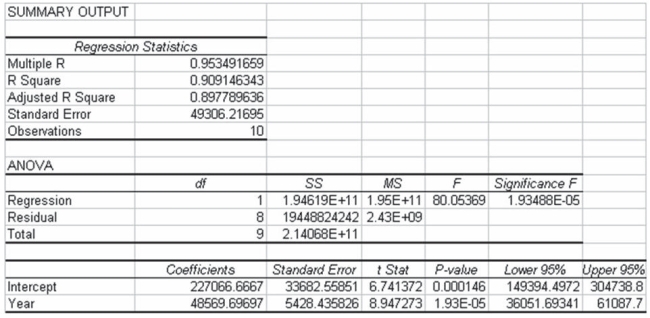 Based on this information, the percent of variation in the number of parts sold that is explained by the linear trend model is approximately 90.9.
Based on this information, the percent of variation in the number of parts sold that is explained by the linear trend model is approximately 90.9. سؤال
سؤال
سؤال
سؤال
سؤال
Gibson, Inc. is a holding company that owns several businesses. One such business is a truck sales company. To help in managing this operation, managers at Gibson have collected sales data for the past 20 years showing the number of trucks sold each year. They have then developed the linear trend forecasting model shown as follows:  Based on this information, the fitted value for year 1 is about 99.
Based on this information, the fitted value for year 1 is about 99. سؤال
سؤال
Renton Industries makes replacement parts for the automobile industry. As part of the company's capacity planning, it needs a long-range total demand forecast. The following information was generated based on 10 years of historical data on total number of parts sold each year.  Based on this information we can conclude that the linear trend model explains a significant proportion of the variation in the number of parts sold, because the p-value is much smaller than any reasonable α that we might use.
Based on this information we can conclude that the linear trend model explains a significant proportion of the variation in the number of parts sold, because the p-value is much smaller than any reasonable α that we might use. سؤال
سؤال
سؤال
سؤال
سؤال
سؤال
سؤال
سؤال
سؤال
سؤال
Recently, a manager for a major retailer computed the following seasonal indexes: 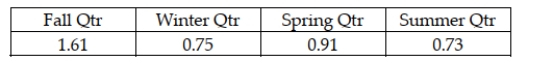 The manager then developed the following least squares trend model based on the past five years of quarterly data: = 200 + 11.5t. Based on this, the seasonally adjusted forecast for quarter 25, which is the winter quarter, is 489.11
The manager then developed the following least squares trend model based on the past five years of quarterly data: = 200 + 11.5t. Based on this, the seasonally adjusted forecast for quarter 25, which is the winter quarter, is 489.11 سؤال
سؤال
سؤال
سؤال
سؤال
سؤال
سؤال
سؤال
سؤال
سؤال
سؤال
Recently, a manager for a major retailer computed the following seasonal indexes: 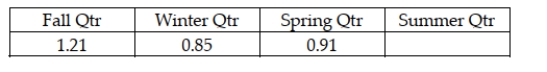 Note that the index for Summer Qtr is missing. However, it can be determined that the index for that period is approximately 1.03
Note that the index for Summer Qtr is missing. However, it can be determined that the index for that period is approximately 1.03 سؤال
سؤال
سؤال
سؤال
The Morgan Company is interested in developing a forecast for next month's sales. It has collected sales data for the past 12 months. 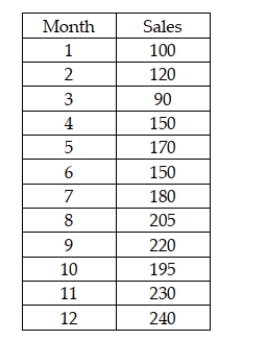 After analyzing these data, if the company wishes to use double exponential smoothing with alpha = 0.20 and beta = 0.20, the starting values for the constant process and the trend process can be derived from a linear trend regression model by using the intercept and slope coefficient respectively.
After analyzing these data, if the company wishes to use double exponential smoothing with alpha = 0.20 and beta = 0.20, the starting values for the constant process and the trend process can be derived from a linear trend regression model by using the intercept and slope coefficient respectively. سؤال
سؤال
سؤال
سؤال
سؤال
سؤال
The owners of Hal's Cookie Company have collected sales data for the past 8 months. These data are shown as follows: 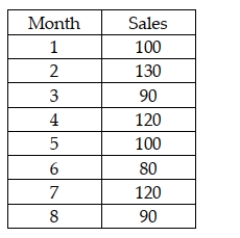 Using a starting forecast in period 1 of 100, the forecast bias over periods 2-8 is negative when a single exponential smoothing model is used with a smoothing constant of 0.20
Using a starting forecast in period 1 of 100, the forecast bias over periods 2-8 is negative when a single exponential smoothing model is used with a smoothing constant of 0.20 سؤال
سؤال
The owners of Hal's Cookie Company have collected sales data for the past 8 months. These data are shown as follows: 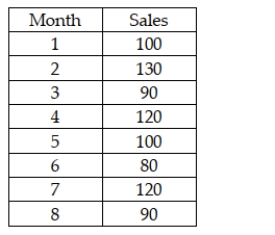 Using a smoothing constant equal to 0.20 and starting forecast in period 1 of 100, the forecast value for period 9 is approximately 104.2.
Using a smoothing constant equal to 0.20 and starting forecast in period 1 of 100, the forecast value for period 9 is approximately 104.2. سؤال
سؤال
The Morgan Company is interested in developing a forecast for next month's sales. It has collected sales data for the past 12 months. 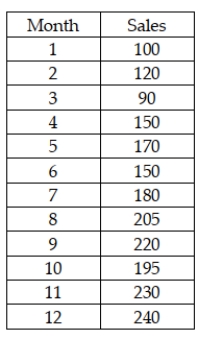 Assuming that the company plans to use double exponential smoothing with starting values for the smoothed constant process value and smoothed trend value of 98.97 and 13.16 respectively, the MAD value for periods 2-12 is greater when alpha = 0.20 and beta = 0.20 than when alpha = 0.10 and beta = 0.10.
Assuming that the company plans to use double exponential smoothing with starting values for the smoothed constant process value and smoothed trend value of 98.97 and 13.16 respectively, the MAD value for periods 2-12 is greater when alpha = 0.20 and beta = 0.20 than when alpha = 0.10 and beta = 0.10. سؤال
سؤال
سؤال
سؤال
The owners of Hal's Cookie Company have collected sales data for the past 8 months. These data are shown as follows: 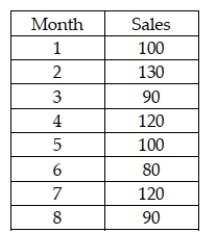 Using a smoothing constant of 0.4, the forecast value for period 3 is 112.
Using a smoothing constant of 0.4, the forecast value for period 3 is 112. سؤال
سؤال
The Morgan Company is interested in developing a forecast for next month's sales. It has collected sales data for the past 12 months. 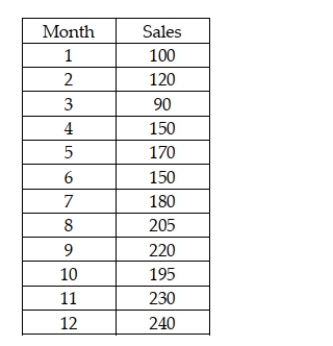 After analyzing these data, if the company wishes to use exponential smoothing, it should employ a single smoothing model since there is evidence of a linear trend in the data.
After analyzing these data, if the company wishes to use exponential smoothing, it should employ a single smoothing model since there is evidence of a linear trend in the data.
فتح الحزمة
قم بالتسجيل لفتح البطاقات في هذه المجموعة!
Unlock Deck
Unlock Deck
1/131
العب
ملء الشاشة (f)
Deck 16: Analyzing and Forecasting Time-Series Data
1
If a forecast period is one month, then we will provide a new forecast each month.
True
2
One of the basic tools for creating a trend-based forecasting model is regression analysis.
True
3
While virtually all time series exhibit a random component, not all time series exhibit other components.
True
4
A time-series graph shows that monthly income data have decreased gradually over the past 5 years. Given this, if a linear trend model is used to forecast future monthly income, the sign on the regression slope coefficient will be negative.
فتح الحزمة
افتح القفل للوصول البطاقات البالغ عددها 131 في هذه المجموعة.
فتح الحزمة
k this deck
5
Harrison Hollow, an upscale eatery in Atlanta, tracks its sales on a daily basis. Recently, the manager stated that sales over the past three weeks have been very cyclical. Given the data she has, this statement is not a reasonable one to make.
فتح الحزمة
افتح القفل للوصول البطاقات البالغ عددها 131 في هذه المجموعة.
فتح الحزمة
k this deck
6
Some stocks are referred to as cyclical stock because they tend to be in favor for several years and then out of favor for several years. This is a correct use of the term cyclical.
فتح الحزمة
افتح القفل للوصول البطاقات البالغ عددها 131 في هذه المجموعة.
فتح الحزمة
k this deck
7
The Gilbert Company chief financial officer has been tracking annual sales for each of the company's three divisions for the past 10 years. At a recent meeting, he pointed to the annual data and indicated that it clearly showed the seasonality associated with its business. Given the data, this statement may have been very appropriate.
فتح الحزمة
افتح القفل للوصول البطاقات البالغ عددها 131 في هذه المجموعة.
فتح الحزمة
k this deck
8
In order for a time series to exhibit a seasonal component, the data must be measured in periods as short or shorter than quarterly.
فتح الحزمة
افتح القفل للوصول البطاقات البالغ عددها 131 في هذه المجموعة.
فتح الحزمة
k this deck
9
A stockbroker at a large brokerage firm recently analyzed the combined annual profits for all firms in the airline industry. One time-series component that may have been present in these annual data was a seasonal component.
فتح الحزمة
افتح القفل للوصول البطاقات البالغ عددها 131 في هذه المجموعة.
فتح الحزمة
k this deck
10
Two common unweighted indexes are the Paasche Index and the Laspeyres Index.
فتح الحزمة
افتح القفل للوصول البطاقات البالغ عددها 131 في هذه المجموعة.
فتح الحزمة
k this deck
11
If the historical data on which the model is being built consist of weekly data, the forecasting period would also be weekly.
فتح الحزمة
افتح القفل للوصول البطاقات البالغ عددها 131 في هذه المجموعة.
فتح الحزمة
k this deck
12
If a manager is planning for an expansion of the factory, a forecast model with a long-term planning horizon would probably be used.
فتح الحزمة
افتح القفل للوصول البطاقات البالغ عددها 131 في هذه المجموعة.
فتح الحزمة
k this deck
13
The time-series component that implies a long-term upward or downward pattern is called the trend component.
فتح الحزمة
افتح القفل للوصول البطاقات البالغ عددها 131 في هذه المجموعة.
فتح الحزمة
k this deck
14
Model specification is the process of determining how well a forecasting model fits the past data.
فتح الحزمة
افتح القفل للوصول البطاقات البالغ عددها 131 في هذه المجموعة.
فتح الحزمة
k this deck
15
Stock analysts have recently stated in a meeting on Wall Street that over the past 50 years there have been periods of high market prices followed by periods of lower prices but over time prices have moved upwards. Given their statement, stock prices most likely exhibit only trend and cyclical components.
فتح الحزمة
افتح القفل للوصول البطاقات البالغ عددها 131 في هذه المجموعة.
فتح الحزمة
k this deck
16
An annual time series cannot exhibit a seasonal component.
فتح الحزمة
افتح القفل للوصول البطاقات البالغ عددها 131 في هذه المجموعة.
فتح الحزمة
k this deck
17
The forecasting interval is the unit of time for which forecasts are made.
فتح الحزمة
افتح القفل للوصول البطاقات البالغ عددها 131 في هذه المجموعة.
فتح الحزمة
k this deck
18
In a recent meeting, a manager indicated that sales tend to be higher during October, November, and December and lower in the spring. In making this statement, she is indicating that sales for the company are cyclical.
فتح الحزمة
افتح القفل للوصول البطاقات البالغ عددها 131 في هذه المجموعة.
فتح الحزمة
k this deck
19
To compare one value measured at one point in time with other values measured at different points in time, index numbers must be used.
فتح الحزمة
افتح القفل للوصول البطاقات البالغ عددها 131 في هذه المجموعة.
فتح الحزمة
k this deck
20
You are given the following linear trend model: Ft = 345.60 - 200.5(t). The forecast for period 15 is approximately -2,662.
فتح الحزمة
افتح القفل للوصول البطاقات البالغ عددها 131 في هذه المجموعة.
فتح الحزمة
k this deck
21
A seasonal index is a statistic that is computed from time-series data to indicate the effect of the seasonality in the time-series data.
فتح الحزمة
افتح القفل للوصول البطاقات البالغ عددها 131 في هذه المجموعة.
فتح الحزمة
k this deck
22
In comparing two or more forecasting models, the MAD value is useful in determining how successful the models were in fitting historical data.
فتح الحزمة
افتح القفل للوصول البطاقات البالغ عددها 131 في هذه المجموعة.
فتح الحزمة
k this deck
23
Renton Industries makes replacement parts for the automobile industry. As part of the company's capacity planning, it needs a long-range total demand forecast. The following information was generated based on 10 years of historical data on total number of parts sold each year. Based on this information, we can conclude that sales on average have been growing by more than 48 thousand annually.
Based on this information, we can conclude that sales on average have been growing by more than 48 thousand annually. فتح الحزمة
افتح القفل للوصول البطاقات البالغ عددها 131 في هذه المجموعة.
فتح الحزمة
k this deck
24
The Baker's Candy Company has been in business for three years. The quarterly sales data for the company are shown as follows: Based on these data, the seasonal index for quarters 3, 7, and 11 is approximately 1.61
Based on these data, the seasonal index for quarters 3, 7, and 11 is approximately 1.61 فتح الحزمة
افتح القفل للوصول البطاقات البالغ عددها 131 في هذه المجموعة.
فتح الحزمة
k this deck
25
Gibson, Inc. is a holding company that owns several businesses. One such business is a truck sales company. To help in managing this operation, managers at Gibson have collected sales data for the past 20 years showing the number of trucks sold each year. They have then developed the linear trend forecasting model shown as follows: Based on this information, it appears that the time series has a strong positive linear trend component.
Based on this information, it appears that the time series has a strong positive linear trend component. فتح الحزمة
افتح القفل للوصول البطاقات البالغ عددها 131 في هذه المجموعة.
فتح الحزمة
k this deck
26
In using simple linear regression to find the linear trend in an annual time series from 2000 to 2015, the values 2000, 2001, etc. are used as the values of the independent variable t when the regression is conducted.
فتح الحزمة
افتح القفل للوصول البطاقات البالغ عددها 131 في هذه المجموعة.
فتح الحزمة
k this deck
27
The Baker's Candy Company has been in business for three years. The quarterly sales data for the company are shown as follows: As a first step in computing a seasonal index, the four-period moving average corresponding to the mid- point between periods 2 and 3 is 3,350.
As a first step in computing a seasonal index, the four-period moving average corresponding to the mid- point between periods 2 and 3 is 3,350. فتح الحزمة
افتح القفل للوصول البطاقات البالغ عددها 131 في هذه المجموعة.
فتح الحزمة
k this deck
28
The reason for using split samples in developing a forecasting model is to eliminate the potential for bias in the resulting model.
فتح الحزمة
افتح القفل للوصول البطاقات البالغ عددها 131 في هذه المجموعة.
فتح الحزمة
k this deck
29
One of the disadvantages of a regression-based linear trend forecasting model is that the forecast errors are computed for time periods that were used in developing the forecasting model and thus do not truly measure the forecasting ability of the model.
فتح الحزمة
افتح القفل للوصول البطاقات البالغ عددها 131 في هذه المجموعة.
فتح الحزمة
k this deck
30
It is possible to use linear regression analysis to develop a forecasting model for nonlinear data if we can effectively transform the data.
فتح الحزمة
افتح القفل للوصول البطاقات البالغ عددها 131 في هذه المجموعة.
فتح الحزمة
k this deck
31
The Baker's Candy Company has been in business for three years. The quarterly sales data for the company are shown as follows: Based on this information, the data reflect both a linear trend and seasonal components.
Based on this information, the data reflect both a linear trend and seasonal components. فتح الحزمة
افتح القفل للوصول البطاقات البالغ عددها 131 في هذه المجموعة.
فتح الحزمة
k this deck
32
Renton Industries makes replacement parts for the automobile industry. As part of the company's capacity planning, it needs a long-range total demand forecast. The following information was generated based on 10 years of historical data on total number of parts sold each year. Based on this information, the percent of variation in the number of parts sold that is explained by the linear trend model is approximately 90.9.
Based on this information, the percent of variation in the number of parts sold that is explained by the linear trend model is approximately 90.9. فتح الحزمة
افتح القفل للوصول البطاقات البالغ عددها 131 في هذه المجموعة.
فتح الحزمة
k this deck
33
Forecast bias measures the average amount of error per forecast, so a positive value means that forecasts tended to be too low.
فتح الحزمة
افتح القفل للوصول البطاقات البالغ عددها 131 في هذه المجموعة.
فتح الحزمة
k this deck
34
In a time series with monthly sales data, a spring quarter seasonal index of 1.21 can be interpreted to mean that sales tend to be 21 percent higher in the spring quarter when compared to the other quarters.
فتح الحزمة
افتح القفل للوصول البطاقات البالغ عددها 131 في هذه المجموعة.
فتح الحزمة
k this deck
35
A scatter plot of time series data with time on the vertical axis is an effective means of assessing whether the series is linear or nonlinear.
فتح الحزمة
افتح القفل للوصول البطاقات البالغ عددها 131 في هذه المجموعة.
فتح الحزمة
k this deck
36
You are given the following linear trend model: Ft = 345.60 - 200.5(t). This model implies that in year 1, the dependent variable had a value of 145.1.
فتح الحزمة
افتح القفل للوصول البطاقات البالغ عددها 131 في هذه المجموعة.
فتح الحزمة
k this deck
37
Gibson, Inc. is a holding company that owns several businesses. One such business is a truck sales company. To help in managing this operation, managers at Gibson have collected sales data for the past 20 years showing the number of trucks sold each year. They have then developed the linear trend forecasting model shown as follows: Based on this information, the fitted value for year 1 is about 99.
Based on this information, the fitted value for year 1 is about 99. فتح الحزمة
افتح القفل للوصول البطاقات البالغ عددها 131 في هذه المجموعة.
فتح الحزمة
k this deck
38
In measuring forecast errors, the MAD and the square root of the MSE will provide similar (but not identical) values, in that both provide a measure of the "typical" amount of error in forecasts.
فتح الحزمة
افتح القفل للوصول البطاقات البالغ عددها 131 في هذه المجموعة.
فتح الحزمة
k this deck
39
Renton Industries makes replacement parts for the automobile industry. As part of the company's capacity planning, it needs a long-range total demand forecast. The following information was generated based on 10 years of historical data on total number of parts sold each year. Based on this information we can conclude that the linear trend model explains a significant proportion of the variation in the number of parts sold, because the p-value is much smaller than any reasonable α that we might use.
Based on this information we can conclude that the linear trend model explains a significant proportion of the variation in the number of parts sold, because the p-value is much smaller than any reasonable α that we might use. فتح الحزمة
افتح القفل للوصول البطاقات البالغ عددها 131 في هذه المجموعة.
فتح الحزمة
k this deck
40
From an annual time series of a company's employee income, the linear trend model Ft = 165 - 54(t) has been developed. This means that on average income has been increasing by 165 per year.
فتح الحزمة
افتح القفل للوصول البطاقات البالغ عددها 131 في هذه المجموعة.
فتح الحزمة
k this deck
41
If a forecasting model produces forecast errors (residuals) that are negatively correlated, then we expect a negative residual to be followed by another negative residual to be followed by another negative residual and so forth.
فتح الحزمة
افتح القفل للوصول البطاقات البالغ عددها 131 في هذه المجموعة.
فتح الحزمة
k this deck
42
Large values of the Durbin-Watson d statistic indicate that positive autocorrelation among the forecast errors exists.
فتح الحزمة
افتح القفل للوصول البطاقات البالغ عددها 131 في هذه المجموعة.
فتح الحزمة
k this deck
43
To deseasonalize a time series, assuming a multiplicative model, the observed values are divided by the appropriate seasonal index.
فتح الحزمة
افتح القفل للوصول البطاقات البالغ عددها 131 في هذه المجموعة.
فتح الحزمة
k this deck
44
The reason for testing for the presence of autocorrelation in a regression-based trend forecasting model is that one assumption of the regression analysis is that the residuals are not correlated.
فتح الحزمة
افتح القفل للوصول البطاقات البالغ عددها 131 في هذه المجموعة.
فتح الحزمة
k this deck
45
If the observed value in a time series for period 3 is yt = 128, and the seasonal index that applies to period 3 is 1.20, then the deseasonalized value for period 3 is 153.6
فتح الحزمة
افتح القفل للوصول البطاقات البالغ عددها 131 في هذه المجموعة.
فتح الحزمة
k this deck
46
If the forecast errors are autocorrelated, this is a good indication that the model has been specified correctly.
فتح الحزمة
افتح القفل للوصول البطاقات البالغ عددها 131 في هذه المجموعة.
فتح الحزمة
k this deck
47
An advantage of exponential smoothing techniques over a regression-based trend model is that the exponential smoothing model allows us to weigh each observation equally, thereby giving a fairer method of developing a forecast.
فتح الحزمة
افتح القفل للوصول البطاقات البالغ عددها 131 في هذه المجموعة.
فتح الحزمة
k this deck
48
If the Durbin-Watson d statistic has a value close to 2, there is reason to believe that there is no autocorrelation between the forecast errors.
فتح الحزمة
افتح القفل للوصول البطاقات البالغ عددها 131 في هذه المجموعة.
فتح الحزمة
k this deck
49
Recently, a manager for a major retailer computed the following seasonal indexes: The manager then developed the following least squares trend model based on the past five years of quarterly data: = 200 + 11.5t. Based on this, the seasonally adjusted forecast for quarter 25, which is the winter quarter, is 489.11
The manager then developed the following least squares trend model based on the past five years of quarterly data: = 200 + 11.5t. Based on this, the seasonally adjusted forecast for quarter 25, which is the winter quarter, is 489.11 فتح الحزمة
افتح القفل للوصول البطاقات البالغ عددها 131 في هذه المجموعة.
فتح الحزمة
k this deck
50
If a time series involves monthly data there will be a total of 12 seasonal indexes.
فتح الحزمة
افتح القفل للوصول البطاقات البالغ عددها 131 في هذه المجموعة.
فتح الحزمة
k this deck
51
Herb Criner, an analyst for the Folgerty Company, recently gave a report in which he stated that the annual sales forecast based on 20 years of annual sales data was done using a seasonally adjusted, trend- based forecasting technique. Given the information presented here, this statement has the potential to be credible.
فتح الحزمة
افتح القفل للوصول البطاقات البالغ عددها 131 في هذه المجموعة.
فتح الحزمة
k this deck
52
The Durbin-Watson test for autocorrelation can be reliably applied to any sample sizes.
فتح الحزمة
افتح القفل للوصول البطاقات البالغ عددها 131 في هذه المجموعة.
فتح الحزمة
k this deck
53
In a single exponential smoothing model, finding the forecast value for each period requires having the actual and forecasted values from the proceeding period. The first period should use an estimated average value based on previous estimates.
فتح الحزمة
افتح القفل للوصول البطاقات البالغ عددها 131 في هذه المجموعة.
فتح الحزمة
k this deck
54
If the Durbin-Watson test leads you to reject the null hypothesis, then you are concluding that the forecast errors are positively autocorrelated.
فتح الحزمة
افتح القفل للوصول البطاقات البالغ عددها 131 في هذه المجموعة.
فتح الحزمة
k this deck
55
It is possible to conduct a statistical test for autocorrelation using the Durbin-Watson test and not be able to make a definitive conclusion about whether there is autocorrelation or not based on the data.
فتح الحزمة
افتح القفل للوصول البطاقات البالغ عددها 131 في هذه المجموعة.
فتح الحزمة
k this deck
56
A seasonally unadjusted forecast is one that is made from seasonal data without any adjustment for the seasonal component in the time series.
فتح الحزمة
افتح القفل للوصول البطاقات البالغ عددها 131 في هذه المجموعة.
فتح الحزمة
k this deck
57
When using the multiplicative time-series model to determine the seasonal indexes, the first step is to isolate the seasonal and random components from the cyclical and trend components.
فتح الحزمة
افتح القفل للوصول البطاقات البالغ عددها 131 في هذه المجموعة.
فتح الحزمة
k this deck
58
If you suspect that a nonlinear trend exists in your data, one way to deal with it in a trend-based forecasting application is to transform the independent variable, for example by squaring the time measure or maybe taking the square-root of the time measure.
فتح الحزمة
افتح القفل للوصول البطاقات البالغ عددها 131 في هذه المجموعة.
فتح الحزمة
k this deck
59
The purpose of deseasonalizing a time series is that a strong seasonal pattern may make it difficult to see a trend in the time series.
فتح الحزمة
افتح القفل للوصول البطاقات البالغ عددها 131 في هذه المجموعة.
فتح الحزمة
k this deck
60
Recently, a manager for a major retailer computed the following seasonal indexes: Note that the index for Summer Qtr is missing. However, it can be determined that the index for that period is approximately 1.03
Note that the index for Summer Qtr is missing. However, it can be determined that the index for that period is approximately 1.03 فتح الحزمة
افتح القفل للوصول البطاقات البالغ عددها 131 في هذه المجموعة.
فتح الحزمة
k this deck
61
In a recent meeting, the marketing manager for a large hardware company stated that he needed to have a forecast prepared for the next three months. The three-month period is called:
A) the forecasting horizon.
B) the forecasting period.
C) the planning time.
D) a business cycle.
A) the forecasting horizon.
B) the forecasting period.
C) the planning time.
D) a business cycle.
فتح الحزمة
افتح القفل للوصول البطاقات البالغ عددها 131 في هذه المجموعة.
فتح الحزمة
k this deck
62
In a single exponential smoothing model, one smoothing constant is used to weigh the historical data, and the model is of primary value when the data do not exhibit trend or seasonal components.
فتح الحزمة
افتح القفل للوصول البطاقات البالغ عددها 131 في هذه المجموعة.
فتح الحزمة
k this deck
63
Because simple exponential smoothing models require a starting point for the first period forecast that will be arbitrary, it is important to have as much data as possible to dampen out the effect of the starting point.
فتح الحزمة
افتح القفل للوصول البطاقات البالغ عددها 131 في هذه المجموعة.
فتح الحزمة
k this deck
64
The Morgan Company is interested in developing a forecast for next month's sales. It has collected sales data for the past 12 months. After analyzing these data, if the company wishes to use double exponential smoothing with alpha = 0.20 and beta = 0.20, the starting values for the constant process and the trend process can be derived from a linear trend regression model by using the intercept and slope coefficient respectively.
After analyzing these data, if the company wishes to use double exponential smoothing with alpha = 0.20 and beta = 0.20, the starting values for the constant process and the trend process can be derived from a linear trend regression model by using the intercept and slope coefficient respectively. فتح الحزمة
افتح القفل للوصول البطاقات البالغ عددها 131 في هذه المجموعة.
فتح الحزمة
k this deck
65
If you suspect that your time-series data has a strong downward trend, you should set the beta smoothing constant at value fairly close to negative 1.0
فتح الحزمة
افتح القفل للوصول البطاقات البالغ عددها 131 في هذه المجموعة.
فتح الحزمة
k this deck
66
Prior to conducting double exponential smoothing a simple linear regression is conducted and the trend equation is = 42 + 38.3t, so the smoothed constant process value should be C0 = 38.3 and the smoothed trend value should be T0 = 42.
فتح الحزمة
افتح القفل للوصول البطاقات البالغ عددها 131 في هذه المجموعة.
فتح الحزمة
k this deck
67
Double exponential smoothing is used instead of single exponential smoothing when extra smooth forecasts are desired.
فتح الحزمة
افتح القفل للوصول البطاقات البالغ عددها 131 في هذه المجموعة.
فتح الحزمة
k this deck
68
The process of selecting the forecasting technique to use in a particular application is called:
A) model diagnosis.
B) model specification.
C) validity checking.
D) model fitting.
A) model diagnosis.
B) model specification.
C) validity checking.
D) model fitting.
فتح الحزمة
افتح القفل للوصول البطاقات البالغ عددها 131 في هذه المجموعة.
فتح الحزمة
k this deck
69
In establishing a single exponential smoothing forecasting model, a starting point for the forecast value for period 1 is required. One method for arriving at this starting point is to use the first data point as the forecast for that period. If we do that, then the first data point should be ignored when computing measures of forecast error.
فتح الحزمة
افتح القفل للوصول البطاقات البالغ عددها 131 في هذه المجموعة.
فتح الحزمة
k this deck
70
The owners of Hal's Cookie Company have collected sales data for the past 8 months. These data are shown as follows: Using a starting forecast in period 1 of 100, the forecast bias over periods 2-8 is negative when a single exponential smoothing model is used with a smoothing constant of 0.20
Using a starting forecast in period 1 of 100, the forecast bias over periods 2-8 is negative when a single exponential smoothing model is used with a smoothing constant of 0.20 فتح الحزمة
افتح القفل للوصول البطاقات البالغ عددها 131 في هذه المجموعة.
فتح الحزمة
k this deck
71
In a single exponential smoothing model, a large value for the smoothing constant will result in greater smoothing of the data than will a smoothing constant close to zero.
فتح الحزمة
افتح القفل للوصول البطاقات البالغ عددها 131 في هذه المجموعة.
فتح الحزمة
k this deck
72
The owners of Hal's Cookie Company have collected sales data for the past 8 months. These data are shown as follows: Using a smoothing constant equal to 0.20 and starting forecast in period 1 of 100, the forecast value for period 9 is approximately 104.2.
Using a smoothing constant equal to 0.20 and starting forecast in period 1 of 100, the forecast value for period 9 is approximately 104.2. فتح الحزمة
افتح القفل للوصول البطاقات البالغ عددها 131 في هذه المجموعة.
فتح الحزمة
k this deck
73
If a time-series plot indicates that the data do not appear to exhibit a trend, then a double exponential smoothing model would likely be the most appropriate to use rather than simple exponential smoothing model.
فتح الحزمة
افتح القفل للوصول البطاقات البالغ عددها 131 في هذه المجموعة.
فتح الحزمة
k this deck
74
The Morgan Company is interested in developing a forecast for next month's sales. It has collected sales data for the past 12 months. Assuming that the company plans to use double exponential smoothing with starting values for the smoothed constant process value and smoothed trend value of 98.97 and 13.16 respectively, the MAD value for periods 2-12 is greater when alpha = 0.20 and beta = 0.20 than when alpha = 0.10 and beta = 0.10.
Assuming that the company plans to use double exponential smoothing with starting values for the smoothed constant process value and smoothed trend value of 98.97 and 13.16 respectively, the MAD value for periods 2-12 is greater when alpha = 0.20 and beta = 0.20 than when alpha = 0.10 and beta = 0.10. فتح الحزمة
افتح القفل للوصول البطاقات البالغ عددها 131 في هذه المجموعة.
فتح الحزمة
k this deck
75
If a smoothing model is applied for a stable time series, a smoothing constant of 0.20 would be an appropriate value.
فتح الحزمة
افتح القفل للوصول البطاقات البالغ عددها 131 في هذه المجموعة.
فتح الحزمة
k this deck
76
In a double smoothing model, the second smoothing constant is introduced to account for the trend in the data if one exists.
فتح الحزمة
افتح القفل للوصول البطاقات البالغ عددها 131 في هذه المجموعة.
فتح الحزمة
k this deck
77
If a time series contains substantial irregular movement, the smoothing constant for a single exponential smoothing model that is close to 1.0 will result in forecasts that are not as smoothed out as those that would occur if a smaller smoothing constant was used.
فتح الحزمة
افتح القفل للوصول البطاقات البالغ عددها 131 في هذه المجموعة.
فتح الحزمة
k this deck
78
The owners of Hal's Cookie Company have collected sales data for the past 8 months. These data are shown as follows: Using a smoothing constant of 0.4, the forecast value for period 3 is 112.
Using a smoothing constant of 0.4, the forecast value for period 3 is 112. فتح الحزمة
افتح القفل للوصول البطاقات البالغ عددها 131 في هذه المجموعة.
فتح الحزمة
k this deck
79
In a double smoothing model, large values for the two smoothing constants will result in greater smoothing of the time series.
فتح الحزمة
افتح القفل للوصول البطاقات البالغ عددها 131 في هذه المجموعة.
فتح الحزمة
k this deck
80
The Morgan Company is interested in developing a forecast for next month's sales. It has collected sales data for the past 12 months. After analyzing these data, if the company wishes to use exponential smoothing, it should employ a single smoothing model since there is evidence of a linear trend in the data.
After analyzing these data, if the company wishes to use exponential smoothing, it should employ a single smoothing model since there is evidence of a linear trend in the data. فتح الحزمة
افتح القفل للوصول البطاقات البالغ عددها 131 في هذه المجموعة.
فتح الحزمة
k this deck
فتح الحزمة
افتح القفل للوصول البطاقات البالغ عددها 131 في هذه المجموعة.


