Deck 6: Samples and Populations
ملء الشاشة (f)
سؤال
سؤال
سؤال
سؤال
سؤال
سؤال
سؤال
سؤال
سؤال
سؤال
When estimating a population mean, the degrees of freedom, df, is:
A)
B)
C)
D)
A)
B)
C)
D)
سؤال
سؤال
سؤال
سؤال
سؤال
سؤال
سؤال
سؤال
سؤال
سؤال
سؤال
The question below refers to the following situation:
A researcher interested in school violence investigates the extent to which conflict occurs in schools. She obtains a weekly count of witnessed arguments from 15 students. The data are as follows: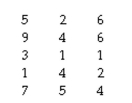
The unbiased estimate of the standard error of the mean is __________.
A researcher interested in school violence investigates the extent to which conflict occurs in schools. She obtains a weekly count of witnessed arguments from 15 students. The data are as follows:
The unbiased estimate of the standard error of the mean is __________.
سؤال
The question below refers to the following situation:
A researcher interested in school violence investigates the extent to which conflict occurs in schools. She obtains a weekly count of witnessed arguments from 15 students. The data
are as follows: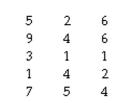
The 99% confidence interval with 14 degrees of freedom is 2.977 according to the t Table.
Therefore, the values of this confidence interval are __________.
سؤال
سؤال
سؤال
The question below refers to the following data: 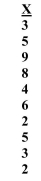
Using t-scores, calculate the 99% confidence interval. (Find the t-values in Table C of
Appendix C.)
Using t-scores, calculate the 99% confidence interval. (Find the t-values in Table C of
Appendix C.)
سؤال
The following equation is called the __________. 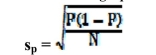
سؤال
سؤال
The question below refers to the following data: 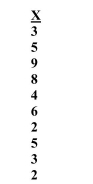
Using t-scores, calculate the 95% confidence interval. (Find the t-values in Table C of
Appendix C.)
Using t-scores, calculate the 95% confidence interval. (Find the t-values in Table C of
Appendix C.)
سؤال
The question below refers to the following situation:
An education researcher is interested in studying student performance on the SAT. The researcher takes a random sample of 200 students and calculates a sample mean of 1600 and a sample standard deviation of 90.
An education researcher is interested in studying student performance on the SAT. The researcher takes a random sample of 200 students and calculates a sample mean of 1600 and a sample standard deviation of 90.
سؤال
The question below refers to the following situation:
A researcher interested in school violence investigates the extent to which conflict occurs in schools. She obtains a weekly count of witnessed arguments from 15 students. The data are as follows: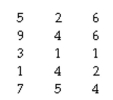
The 95% confidence interval with 14 degrees of freedom is 2.145 according to the t Table.
Therefore, the values of this confidence interval are __________.
سؤال
سؤال
h a standard deviation of .3. 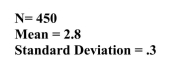
Without using t-scores, calculate the 99% confidence interval.
Without using t-scores, calculate the 99% confidence interval.
سؤال
The question below refers to the following situation:
An education researcher is interested in studying student performance on the SAT. The researcher takes a random sample of 200 students and calculates a sample mean of 1600 and a sample standard deviation of 90.
An education researcher is interested in studying student performance on the SAT. The researcher takes a random sample of 200 students and calculates a sample mean of 1600 and a sample standard deviation of 90.
سؤال
سؤال
سؤال
The question below refers to the following data: 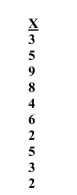
Estimate the standard error of the mean.
Estimate the standard error of the mean.
سؤال
The question below refers to the following situation:
Given the following raw scores on a standard 10-point scale of student satisfaction: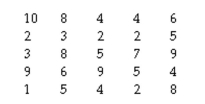
Estimate the standard error of the mean.
Given the following raw scores on a standard 10-point scale of student satisfaction:
Estimate the standard error of the mean.
سؤال
h a standard deviation of .3. 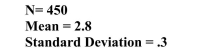
Estimate the standard error of the mean.
Estimate the standard error of the mean.
سؤال
h a standard deviation of .3. 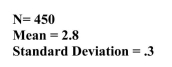
Without using t-scores, calculate the 95% confidence interval.
Without using t-scores, calculate the 95% confidence interval.
سؤال
سؤال
سؤال
The question below refers to the following situation:
Given the following raw scores on a standard 10-point scale of student satisfaction: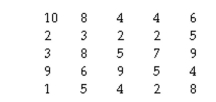
Calculate the 99% confidence interval (use the t-score method; you can find t-values in
Table C of Appendix C):
Given the following raw scores on a standard 10-point scale of student satisfaction:
Calculate the 99% confidence interval (use the t-score method; you can find t-values in
Table C of Appendix C):
سؤال
The question below refers to the following situation:
Given the following raw scores on a standard 10-point scale of student satisfaction: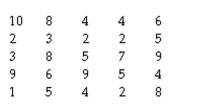
Calculate the 95% confidence interval (use the t-score method; you can find t-values in
Table C of Appendix C):
Given the following raw scores on a standard 10-point scale of student satisfaction:
Calculate the 95% confidence interval (use the t-score method; you can find t-values in
Table C of Appendix C):
سؤال

فتح الحزمة
قم بالتسجيل لفتح البطاقات في هذه المجموعة!
Unlock Deck
Unlock Deck
1/44
العب
ملء الشاشة (f)
Deck 6: Samples and Populations
1
When increasing the level of confidence from 95% to 99%, we:
A)lose confidence but gain precision.
B)lose precision but gain confidence that our answer interval is accurate.
C)lose precision and lose confidence that our answer interval is accurate.
D)none of the above.
A)lose confidence but gain precision.
B)lose precision but gain confidence that our answer interval is accurate.
C)lose precision and lose confidence that our answer interval is accurate.
D)none of the above.
lose precision but gain confidence that our answer interval is accurate.
2
The standard deviation of a sampling distribution of means is:
A)equal to the population standard deviation.
B)greater than the population standard deviation.
C)less than the population standard deviation.
D)none of the above.
A)equal to the population standard deviation.
B)greater than the population standard deviation.
C)less than the population standard deviation.
D)none of the above.
less than the population standard deviation.
3
A sample is usually:
A)a little larger than the population.
B)smaller than the population.
C)more tedious and expensive to obtain than the entire population.
D)not reflective of the population.
A)a little larger than the population.
B)smaller than the population.
C)more tedious and expensive to obtain than the entire population.
D)not reflective of the population.
smaller than the population.
4
Research that analyzes a portion of an entire population is carried out on a(n):
A)sample.
B)population.
C)census.
D)sur vey.
A)sample.
B)population.
C)census.
D)sur vey.
فتح الحزمة
افتح القفل للوصول البطاقات البالغ عددها 44 في هذه المجموعة.
فتح الحزمة
k this deck
5
The standard error of the mean:
A)is the same as the sample standard deviation.
B)is the same as the population standard deviation.
C)is the standard deviation of a theoretical sampling distribution.
D )is equal to the sample size minus 1.
A)is the same as the sample standard deviation.
B)is the same as the population standard deviation.
C)is the standard deviation of a theoretical sampling distribution.
D )is equal to the sample size minus 1.
فتح الحزمة
افتح القفل للوصول البطاقات البالغ عددها 44 في هذه المجموعة.
فتح الحزمة
k this deck
6
The social researcher taking a random sample usually uses:
A)a hat with slips of paper.
B)a lottery ping-pong ball picker.
C)an actuarial table.
D)a table of random numbers.
A)a hat with slips of paper.
B)a lottery ping-pong ball picker.
C)an actuarial table.
D)a table of random numbers.
فتح الحزمة
افتح القفل للوصول البطاقات البالغ عددها 44 في هذه المجموعة.
فتح الحزمة
k this deck
7
Pollsters sometimes refer to sampling error as the:
A)mistake.
B)mu.
C)measure of central tendency.
D)m argin of error.
A)mistake.
B)mu.
C)measure of central tendency.
D)m argin of error.
فتح الحزمة
افتح القفل للوصول البطاقات البالغ عددها 44 في هذه المجموعة.
فتح الحزمة
k this deck
8
When increasing our level of confidence from 95% to 99%, the interval:
A)grows.
B)shrinks.
C)remains the same.
D)none of the above
A)grows.
B)shrinks.
C)remains the same.
D)none of the above
فتح الحزمة
افتح القفل للوصول البطاقات البالغ عددها 44 في هذه المجموعة.
فتح الحزمة
k this deck
9
The greater the degrees of freedom, the __________ the sample size and the __________ The t distribution approximates the normal distribution.
A)smaller; more closely
B)larger; more closely
C)larger; less closely
D )smaller; less closely
A)smaller; more closely
B)larger; more closely
C)larger; less closely
D )smaller; less closely
فتح الحزمة
افتح القفل للوصول البطاقات البالغ عددها 44 في هذه المجموعة.
فتح الحزمة
k this deck
10
When estimating a population mean, the degrees of freedom, df, is:
A)
B)
C)
D)
A)
B)
C)
D)
فتح الحزمة
افتح القفل للوصول البطاقات البالغ عددها 44 في هذه المجموعة.
فتح الحزمة
k this deck
11
The difference between the sample mean and the population mean is called:
A)mean variance.
B)sample variance.
C)sampling error.
D)po pulation variance.
A)mean variance.
B)sample variance.
C)sampling error.
D)po pulation variance.
فتح الحزمة
افتح القفل للوصول البطاقات البالغ عددها 44 في هذه المجموعة.
فتح الحزمة
k this deck
12
Which of the following is true of the sampling distribution of means?
A)The sampling distribution of means approximates the normal curve.
B)The mean of a sampling distribution of means is equal to the population mean.
C)The standard deviation of a sampling distribution of means is smaller than the standard
Deviation of the population.
D)all of the above
A)The sampling distribution of means approximates the normal curve.
B)The mean of a sampling distribution of means is equal to the population mean.
C)The standard deviation of a sampling distribution of means is smaller than the standard
Deviation of the population.
D)all of the above
فتح الحزمة
افتح القفل للوصول البطاقات البالغ عددها 44 في هذه المجموعة.
فتح الحزمة
k this deck
13
Regardless of how well the sampling plan has been designed, with the researcher's best Intentions, no cheating, and no mistakes, a difference between the sample mean and the Population mean known as ______ will almost always be present.
A)measurement mishap
B)sampling error
C)human error
D)si gma erroneous
A)measurement mishap
B)sampling error
C)human error
D)si gma erroneous
فتح الحزمة
افتح القفل للوصول البطاقات البالغ عددها 44 في هذه المجموعة.
فتح الحزمة
k this deck
14
In using a table of random numbers:
A)always disregard numbers that come up a second time.
B)always disregard numbers that are higher than needed.
C)always include your one favorite number.
D)a and b
A)always disregard numbers that come up a second time.
B)always disregard numbers that are higher than needed.
C)always include your one favorite number.
D)a and b
فتح الحزمة
افتح القفل للوصول البطاقات البالغ عددها 44 في هذه المجموعة.
فتح الحزمة
k this deck
15
The mean of a sampling distribution of means is:
A)equal to the population mean.
B)greater than the population mean.
C)less than the population standard deviation.
D)none of the above.
A)equal to the population mean.
B)greater than the population mean.
C)less than the population standard deviation.
D)none of the above.
فتح الحزمة
افتح القفل للوصول البطاقات البالغ عددها 44 في هذه المجموعة.
فتح الحزمة
k this deck
16
A frequency distribution of a large number of random sample means which have been Drawn from the same population is called:
A)the standard error of measurement.
B)the sampling error.
C)the sampling distribution of means.
D)the standard error of the means.
A)the standard error of measurement.
B)the sampling error.
C)the sampling distribution of means.
D)the standard error of the means.
فتح الحزمة
افتح القفل للوصول البطاقات البالغ عددها 44 في هذه المجموعة.
فتح الحزمة
k this deck
17
Researchers deal with an extra amount of uncertainty in estimating the standard error of The mean with this distribution:
A)normal
B)z
C)asymmetrical
D)t
A)normal
B)z
C)asymmetrical
D)t
فتح الحزمة
افتح القفل للوصول البطاقات البالغ عددها 44 في هذه المجموعة.
فتح الحزمة
k this deck
18
The process of using a table of random numbers:
A)inevitably leads to calculation errors.
B)yields a representative sample.
C)yields a non-representative sample.
D)pr oduces researcher-introduced bias.
A)inevitably leads to calculation errors.
B)yields a representative sample.
C)yields a non-representative sample.
D)pr oduces researcher-introduced bias.
فتح الحزمة
افتح القفل للوصول البطاقات البالغ عددها 44 في هذه المجموعة.
فتح الحزمة
k this deck
19
The researcher strives to give every member of the population an equal chance of being
Drawn via:
A)biasing.
B)non-random sampling.
C)random sampling.
D)pers onal judgement.
Drawn via:
A)biasing.
B)non-random sampling.
C)random sampling.
D)pers onal judgement.
فتح الحزمة
افتح القفل للوصول البطاقات البالغ عددها 44 في هذه المجموعة.
فتح الحزمة
k this deck
20
Through the sampling process, social researchers seek to generalize from a small group to a larger group.
فتح الحزمة
افتح القفل للوصول البطاقات البالغ عددها 44 في هذه المجموعة.
فتح الحزمة
k this deck
21
The question below refers to the following situation:
A researcher interested in school violence investigates the extent to which conflict occurs in schools. She obtains a weekly count of witnessed arguments from 15 students. The data are as follows:
The unbiased estimate of the standard error of the mean is __________.
A researcher interested in school violence investigates the extent to which conflict occurs in schools. She obtains a weekly count of witnessed arguments from 15 students. The data are as follows:
The unbiased estimate of the standard error of the mean is __________.
فتح الحزمة
افتح القفل للوصول البطاقات البالغ عددها 44 في هذه المجموعة.
فتح الحزمة
k this deck
22
The question below refers to the following situation:
A researcher interested in school violence investigates the extent to which conflict occurs in schools. She obtains a weekly count of witnessed arguments from 15 students. The data
are as follows:
The 99% confidence interval with 14 degrees of freedom is 2.977 according to the t Table.
Therefore, the values of this confidence interval are __________.
فتح الحزمة
افتح القفل للوصول البطاقات البالغ عددها 44 في هذه المجموعة.
فتح الحزمة
k this deck
23
The question below refers to the following situation:
A random sample of 500 registered voters in a city shows that 53% of the voters support higher taxes to help fund public schools.
Estimate the population proportion with a 95% confidence interval.
A random sample of 500 registered voters in a city shows that 53% of the voters support higher taxes to help fund public schools.
Estimate the population proportion with a 95% confidence interval.
فتح الحزمة
افتح القفل للوصول البطاقات البالغ عددها 44 في هذه المجموعة.
فتح الحزمة
k this deck
24
Holding sample size constant, the social researcher must choose between greater precisionnor greater confidence of being correct.
فتح الحزمة
افتح القفل للوصول البطاقات البالغ عددها 44 في هذه المجموعة.
فتح الحزمة
k this deck
25
The question below refers to the following data:
Using t-scores, calculate the 99% confidence interval. (Find the t-values in Table C of
Appendix C.)
Using t-scores, calculate the 99% confidence interval. (Find the t-values in Table C of
Appendix C.)
فتح الحزمة
افتح القفل للوصول البطاقات البالغ عددها 44 في هذه المجموعة.
فتح الحزمة
k this deck
26
The following equation is called the __________.
فتح الحزمة
افتح القفل للوصول البطاقات البالغ عددها 44 في هذه المجموعة.
فتح الحزمة
k this deck
27
Unfortunately, sampling error cannot be calculated.
فتح الحزمة
افتح القفل للوصول البطاقات البالغ عددها 44 في هذه المجموعة.
فتح الحزمة
k this deck
28
The question below refers to the following data:
Using t-scores, calculate the 95% confidence interval. (Find the t-values in Table C of
Appendix C.)
Using t-scores, calculate the 95% confidence interval. (Find the t-values in Table C of
Appendix C.)
فتح الحزمة
افتح القفل للوصول البطاقات البالغ عددها 44 في هذه المجموعة.
فتح الحزمة
k this deck
29
The question below refers to the following situation:
An education researcher is interested in studying student performance on the SAT. The researcher takes a random sample of 200 students and calculates a sample mean of 1600 and a sample standard deviation of 90.
An education researcher is interested in studying student performance on the SAT. The researcher takes a random sample of 200 students and calculates a sample mean of 1600 and a sample standard deviation of 90.
فتح الحزمة
افتح القفل للوصول البطاقات البالغ عددها 44 في هذه المجموعة.
فتح الحزمة
k this deck
30
The question below refers to the following situation:
A researcher interested in school violence investigates the extent to which conflict occurs in schools. She obtains a weekly count of witnessed arguments from 15 students. The data are as follows:
The 95% confidence interval with 14 degrees of freedom is 2.145 according to the t Table.
Therefore, the values of this confidence interval are __________.
فتح الحزمة
افتح القفل للوصول البطاقات البالغ عددها 44 في هذه المجموعة.
فتح الحزمة
k this deck
31
The question below refers to the following situation:
An education researcher is interested in studying student performance on the SAT. The researcher takes a random sample of 200 students and calculates a sample mean of 1600 and a sample standard deviation of 90.The standard error of the mean is __________.
An education researcher is interested in studying student performance on the SAT. The researcher takes a random sample of 200 students and calculates a sample mean of 1600 and a sample standard deviation of 90.The standard error of the mean is __________.
فتح الحزمة
افتح القفل للوصول البطاقات البالغ عددها 44 في هذه المجموعة.
فتح الحزمة
k this deck
32
h a standard deviation of .3.
Without using t-scores, calculate the 99% confidence interval.
Without using t-scores, calculate the 99% confidence interval.
فتح الحزمة
افتح القفل للوصول البطاقات البالغ عددها 44 في هذه المجموعة.
فتح الحزمة
k this deck
33
The question below refers to the following situation:
An education researcher is interested in studying student performance on the SAT. The researcher takes a random sample of 200 students and calculates a sample mean of 1600 and a sample standard deviation of 90.
An education researcher is interested in studying student performance on the SAT. The researcher takes a random sample of 200 students and calculates a sample mean of 1600 and a sample standard deviation of 90.
فتح الحزمة
افتح القفل للوصول البطاقات البالغ عددها 44 في هذه المجموعة.
فتح الحزمة
k this deck
34
Compared with the 95% confidence interval, the 99% confidence interval is more narrow.
فتح الحزمة
افتح القفل للوصول البطاقات البالغ عددها 44 في هذه المجموعة.
فتح الحزمة
k this deck
35
The question below refers to the following situation:
A random sample of 500 registered voters in a city shows that 53% of the voters support higher taxes to help fund public schools.
The standard error of the proportion is __________.
A random sample of 500 registered voters in a city shows that 53% of the voters support higher taxes to help fund public schools.
The standard error of the proportion is __________.
فتح الحزمة
افتح القفل للوصول البطاقات البالغ عددها 44 في هذه المجموعة.
فتح الحزمة
k this deck
36
The question below refers to the following data:
Estimate the standard error of the mean.
Estimate the standard error of the mean.
فتح الحزمة
افتح القفل للوصول البطاقات البالغ عددها 44 في هذه المجموعة.
فتح الحزمة
k this deck
37
The question below refers to the following situation:
Given the following raw scores on a standard 10-point scale of student satisfaction:
Estimate the standard error of the mean.
Given the following raw scores on a standard 10-point scale of student satisfaction:
Estimate the standard error of the mean.
فتح الحزمة
افتح القفل للوصول البطاقات البالغ عددها 44 في هذه المجموعة.
فتح الحزمة
k this deck
38
h a standard deviation of .3.
Estimate the standard error of the mean.
Estimate the standard error of the mean.
فتح الحزمة
افتح القفل للوصول البطاقات البالغ عددها 44 في هذه المجموعة.
فتح الحزمة
k this deck
39
h a standard deviation of .3.
Without using t-scores, calculate the 95% confidence interval.
Without using t-scores, calculate the 95% confidence interval.
فتح الحزمة
افتح القفل للوصول البطاقات البالغ عددها 44 في هذه المجموعة.
فتح الحزمة
k this deck
40
What is the standard error of the mean when analyzing the IQs of 25 adults, given that the population standard deviation of adult IQ is 10?
فتح الحزمة
افتح القفل للوصول البطاقات البالغ عددها 44 في هذه المجموعة.
فتح الحزمة
k this deck
41
The question below refers to the following situation:
A random sample of 175 people surveyed were asked whether or not they always stop
completely at stop signs. Seventy-five percent responded that they do not.
Estimate the population proportion with a 95% confidence interval.
A random sample of 175 people surveyed were asked whether or not they always stop
completely at stop signs. Seventy-five percent responded that they do not.
Estimate the population proportion with a 95% confidence interval.
فتح الحزمة
افتح القفل للوصول البطاقات البالغ عددها 44 في هذه المجموعة.
فتح الحزمة
k this deck
42
The question below refers to the following situation:
Given the following raw scores on a standard 10-point scale of student satisfaction:
Calculate the 99% confidence interval (use the t-score method; you can find t-values in
Table C of Appendix C):
Given the following raw scores on a standard 10-point scale of student satisfaction:
Calculate the 99% confidence interval (use the t-score method; you can find t-values in
Table C of Appendix C):
فتح الحزمة
افتح القفل للوصول البطاقات البالغ عددها 44 في هذه المجموعة.
فتح الحزمة
k this deck
43
The question below refers to the following situation:
Given the following raw scores on a standard 10-point scale of student satisfaction:
Calculate the 95% confidence interval (use the t-score method; you can find t-values in
Table C of Appendix C):
Given the following raw scores on a standard 10-point scale of student satisfaction:
Calculate the 95% confidence interval (use the t-score method; you can find t-values in
Table C of Appendix C):
فتح الحزمة
افتح القفل للوصول البطاقات البالغ عددها 44 في هذه المجموعة.
فتح الحزمة
k this deck
44
The question below refers to the following situation:
A random sample of 175 people surveyed were asked whether or not they always stop
completely at stop signs. Seventy-five percent responded that they do not.
What is the standard error of the proportion?
A random sample of 175 people surveyed were asked whether or not they always stop
completely at stop signs. Seventy-five percent responded that they do not.
What is the standard error of the proportion?
فتح الحزمة
افتح القفل للوصول البطاقات البالغ عددها 44 في هذه المجموعة.
فتح الحزمة
k this deck
فتح الحزمة
افتح القفل للوصول البطاقات البالغ عددها 44 في هذه المجموعة.


