Deck 8: Confidence Intervals
ملء الشاشة (f)
سؤال
سؤال
سؤال
The three confidence intervals below were constructed from the same sample. One of them was computed at a confidence level of 90%, another at a confidence level of 95%, and another at a confidence level of 98%.
Which is the confidence level at 98%?
A)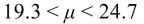
B)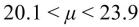
C) cannot be determined
D)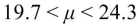
Which is the confidence level at 98%?
A)
B)
C) cannot be determined
D)
سؤال
A college admissions officer takes a simple random sample of 60 entering freshmen and computes their mean mathematics SAT score to be 439. Assume the population standard deviation is  Based on a 98% confidence interval for the mean mathematics SAT score, is it likely that the mean
Mathematics SAT score for entering freshmen class is greater than 456? (Hint: you should first
Construct the 98% confidence interval for the mean mathematics SAT score.)
A) No
B) The likelihood cannot be determined.
C) Yes
Based on a 98% confidence interval for the mean mathematics SAT score, is it likely that the meanMathematics SAT score for entering freshmen class is greater than 456? (Hint: you should first
Construct the 98% confidence interval for the mean mathematics SAT score.)
A) No
B) The likelihood cannot be determined.
C) Yes
سؤال
A random sample of a specific brand of snack bar is tested for calorie count, with the following results: 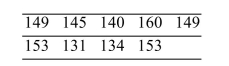 Assume the population standard deviation is
  and that the population is approximately normal. Construct a 95% confidence interval for the calorie count of the snack bars.
A) (139.8, 152.2)
B) (99.0, 193.0)
C) (140.1, 151.9)
D) (130.3, 161.7)
Assume the population standard deviation is and that the population is approximately normal. Construct a 95% confidence interval for the calorie count of the snack bars.A) (139.8, 152.2)
B) (99.0, 193.0)
C) (140.1, 151.9)
D) (130.3, 161.7)
سؤال
A college admissions officer takes a simple random sample of 110 entering freshmen and computes their mean mathematics SAT score to be 465. Assume the population standard deviation is  Construct a 90% confidence interval for the mean mathematics SAT score for the entering freshmen
Class.
A) (463, 467)
B) (451, 479)
C) (373, 557)
D) (446, 484)
Construct a 90% confidence interval for the mean mathematics SAT score for the entering freshmenClass.
A) (463, 467)
B) (451, 479)
C) (373, 557)
D) (446, 484)
سؤال
Find the critical value  needed to construct a(n) 99.3% confidence interval.
A) 2.46
B) 2.70
C) 3.59
D) 2.35
needed to construct a(n) 99.3% confidence interval.A) 2.46
B) 2.70
C) 3.59
D) 2.35
سؤال
A sample of size n = 42 is drawn from a population whose standard deviation is  Find the margin of error for a 95% confidence interval for
A) 1.49
B) 1.31
C) 0.88
D) 2.57
Find the margin of error for a 95% confidence interval for A) 1.49
B) 1.31
C) 0.88
D) 2.57
سؤال
A sample of size n = 16 is drawn from an approximately normal population whose standard deviation is  The sample mean is
  Construct a 99% confidence interval for
A) (48.91, 53.09)
B) (38.28, 63.72)
C) 44.24, 57.76
D) (51.00, 57.76)
The sample mean is Construct a 99% confidence interval for A) (48.91, 53.09)
B) (38.28, 63.72)
C) 44.24, 57.76
D) (51.00, 57.76)
سؤال
سؤال
Find the critical value  needed to construct a(n) 97% confidence interval.
A) 2.17
B) 1.88
C) 2.75
D) 1.92
needed to construct a(n) 97% confidence interval.A) 2.17
B) 1.88
C) 2.75
D) 1.92
سؤال
A population has a standard deviation  How large a sample must be drawn so that a 98% confidence interval for μ will have a margin of error equal to 4.1?
A) 192
B) 5
C) 109
D) 10
How large a sample must be drawn so that a 98% confidence interval for μ will have a margin of error equal to 4.1?A) 192
B) 5
C) 109
D) 10
سؤال
The following MINITAB output presents a 95% confidence interval. 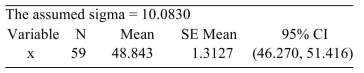
Fill in the blanks: We are______ confident that the population mean is between ________and________
A) 5%, 46.270,51.416
B) 95%, 0,48.843
C) 95%, 46.270,51.416
D) 5%, 0,48.843
Fill in the blanks: We are______ confident that the population mean is between ________and________
A) 5%, 46.270,51.416
B) 95%, 0,48.843
C) 95%, 46.270,51.416
D) 5%, 0,48.843
سؤال
A random sample of electronic components had the following operational times before failure, in hours. 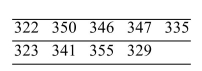 Assume the population standard deviation is
  and that the population is approximately normal. Construct a 90% confidence interval for the operational time before failure.
A) (318.9, 358.4)
B) (331.3, 346.1)
C) (279.4, 397.9)
D) (332.1, 345.3)
Assume the population standard deviation is and that the population is approximately normal. Construct a 90% confidence interval for the operational time before failure.A) (318.9, 358.4)
B) (331.3, 346.1)
C) (279.4, 397.9)
D) (332.1, 345.3)
سؤال
The following display from a TI-84 Plus calculator presents a 95% confidence interval. 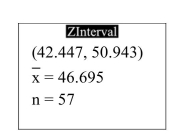 Fill in the blanks: We are ________ confident that the population mean is between _______ and _______.
A) 5%, 0, 46.695
B) 95%, 0, 46.695
C) 95%, 42.447, 50.943
D) 5%, 42.447, 50.943
Fill in the blanks: We are ________ confident that the population mean is between _______ and _______.A) 5%, 0, 46.695
B) 95%, 0, 46.695
C) 95%, 42.447, 50.943
D) 5%, 42.447, 50.943
سؤال
A random sample of 60 adults is chosen and their mean serum cholesterol level is found to be 196 milligrams per deciliter. Assuming that the population standard deviation is  , compute a 99%
Confidence interval for the mean serum cholesterol level for adults.
A) (153, 239)
B) (172, 220)
C) (182, 210)
D) (194, 198)
, compute a 99%Confidence interval for the mean serum cholesterol level for adults.
A) (153, 239)
B) (172, 220)
C) (182, 210)
D) (194, 198)
سؤال
A sample of 36 light bulbs had a mean lifetime of 508 hours. A 95% confidence interval for the population mean was 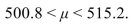 Which one of the following statements is the correct interpretation of the results?
A) 95% of the light bulbs in the sample had lifetimes between 500.8 hours and 515.2 hours
B) None of these are true.
C) We are 95% confident that the mean lifetime of all the bulbs in the population is between 500.8 hours and 515.2 hours.
D) The probability that the population mean is between 500.8 hours and 515.2 hours is 0.95.
Which one of the following statements is the correct interpretation of the results?A) 95% of the light bulbs in the sample had lifetimes between 500.8 hours and 515.2 hours
B) None of these are true.
C) We are 95% confident that the mean lifetime of all the bulbs in the population is between 500.8 hours and 515.2 hours.
D) The probability that the population mean is between 500.8 hours and 515.2 hours is 0.95.
سؤال
A random sample of 9 TI-89 Titanium calculators being sold over the internet had the following prices, in dollars. 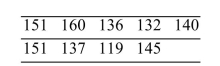 Assume the population standard deviation is
  and that the population is approximately normal.
Construct a 90% confidence interval for the mean price for all the TI-89's being sold over the
Internet.
A) (134.6, 147.9)
B) (122.6, 159.9)
C) (85.3, 197.2)
D) (134.2, 148.2)
Assume the population standard deviation is and that the population is approximately normal.Construct a 90% confidence interval for the mean price for all the TI-89's being sold over the
Internet.
A) (134.6, 147.9)
B) (122.6, 159.9)
C) (85.3, 197.2)
D) (134.2, 148.2)
سؤال
A random sample of 80 adults is chosen and their mean serum cholesterol level is found to be 202 milligrams per deciliter. Assume that the population standard deviation is  Based on a 95% confidence interval for the mean serum cholesterol, is it likely that the mean serum
Cholesterol is greater than 219? (Hint: you should first construct the 95% confidence interval.)
A) No
B) The likelihood cannot be determined.
C) Yes
Based on a 95% confidence interval for the mean serum cholesterol, is it likely that the mean serumCholesterol is greater than 219? (Hint: you should first construct the 95% confidence interval.)
A) No
B) The likelihood cannot be determined.
C) Yes
سؤال
A simple random sample of kitchen toasters is to be taken to determine the mean operational lifetime in hours. Assume that the lifetimes are normally distributed with population standard
Deviation hours.
Find the sample size needed so that a 98% confidence interval for the mean lifetime will have a margin
Of error of 4.
A) 13
B) 150
C) 3
D) 257
Deviation
hours.Find the sample size needed so that a 98% confidence interval for the mean lifetime will have a margin
Of error of 4.
A) 13
B) 150
C) 3
D) 257
سؤال
Six measurements were made of the magnesium ion concentration (in parts per million, or ppm) in a city's municipal water supply, with the following results. It is reasonable to assume that the population is
Approximately normal.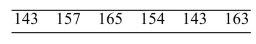 Construct a 99% confidence interval for the mean magnesium ion concentration.
A) (151.4, 156.9)
B) (137.0, 171.3)
C) (138.5, 169.8)
D) (151.6, 156.7)
Approximately normal.
Construct a 99% confidence interval for the mean magnesium ion concentration.A) (151.4, 156.9)
B) (137.0, 171.3)
C) (138.5, 169.8)
D) (151.6, 156.7)
سؤال
A sample of size n = 14 has a sample mean  and sample standard deviation s = 2.1. It is reasonable to assume that the population is approximately normal. Construct a 99% confidence
Interval for the population mean
A) (10.7, 13.1)
B) (11.4, 12.4)
C) (10.2, 13.6)
D) (10.4, 13.4)
and sample standard deviation s = 2.1. It is reasonable to assume that the population is approximately normal. Construct a 99% confidenceInterval for the population mean
A) (10.7, 13.1)
B) (11.4, 12.4)
C) (10.2, 13.6)
D) (10.4, 13.4)
سؤال
سؤال
The following MINITAB output presents a confidence interval for a population mean. 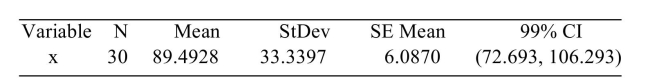 Find the critical value
  for a 98% confidence interval.
A) 2.462
B) 2.457
C) 2.750
D) 2.760
Find the critical value for a 98% confidence interval.A) 2.462
B) 2.457
C) 2.750
D) 2.760
سؤال
سؤال
The following MINITAB output presents a 95% confidence interval. 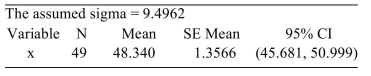
Use the appropriate critical value along with the information in the computer output to construct a 99 confidence interval.
A) (44.845,51.835)
B) (45.185,51.495)
C) (47.206,49.474)
D) (45.681,50.999)
Use the appropriate critical value along with the information in the computer output to construct a 99 confidence interval.
A) (44.845,51.835)
B) (45.185,51.495)
C) (47.206,49.474)
D) (45.681,50.999)
سؤال
The following MINITAB output presents a 95% confidence interval. 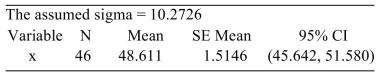
Find the sample size needed so that the 95% confidence interval will have a margin of error of 1.1.
A) 472
B) 579
C) 19
D) 336
Find the sample size needed so that the 95% confidence interval will have a margin of error of 1.1.
A) 472
B) 579
C) 19
D) 336
سؤال
The following MINITAB output presents a confidence interval for a population mean. 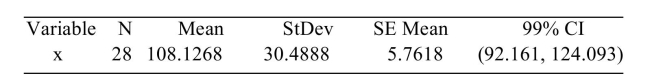 Use the information in the output to construct a 98% confidence interval.
A) (92.161,124.093)
B) (105.546,110.707)
C) (93.878,122.376)
D) (105.235,111.018)
Use the information in the output to construct a 98% confidence interval. A) (92.161,124.093)
B) (105.546,110.707)
C) (93.878,122.376)
D) (105.235,111.018)
سؤال
Find the point estimate for the given values of x and n. 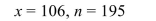
A) 106
B) 0.4564
C) 0.5436
D) 0.03567
A) 106
B) 0.4564
C) 0.5436
D) 0.03567
سؤال
سؤال
The following MINITAB output presents a confidence interval for a population mean. 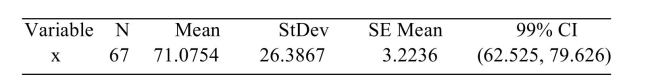 How many degrees of freedom are there?
A) 66
B) 3.2236
C) 68
D) 67
How many degrees of freedom are there?A) 66
B) 3.2236
C) 68
D) 67
سؤال
A sample of size n = 16 is drawn from a normal population. Find the critical value  needed to construct a 90% confidence interval.
A) 1.645
B) 1.341
C) 1.746
D) 1.753
needed to construct a 90% confidence interval.A) 1.645
B) 1.341
C) 1.746
D) 1.753
سؤال
Find the critical value  needed to construct a confidence interval of the given level with the given sample size.
Level 98%, sample size 5
A) 3.365
B) 2.999
C) 2.326
D) 3.747
needed to construct a confidence interval of the given level with the given sample size.Level 98%, sample size 5
A) 3.365
B) 2.999
C) 2.326
D) 3.747
سؤال
The following display from a TI-84 Plus calculator presents a 95% confidence interval. 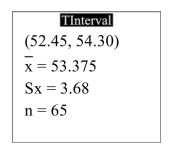 Fill in the blanks: We are ________ confident that the population mean is between _______ and _______.
A) 95%, 52.45,54.30
B) 95%, 0,53.375
C) 5%, 0,53.375
D) 5%, 52.45,54.30
Fill in the blanks: We are ________ confident that the population mean is between _______ and _______. A) 95%, 52.45,54.30
B) 95%, 0,53.375
C) 5%, 0,53.375
D) 5%, 52.45,54.30
سؤال
سؤال
سؤال
Six measurements were made of the magnesium ion concentration (in parts per million, or ppm) in a city's municipal water supply, with the following results. It is reasonable to assume that the population is
Approximately normal.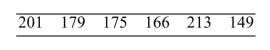 Based on a 95% confidence interval for the mean magnesium ion concentration, is it reasonable to
Believe that the mean magnesium ion concentration may be greater than 199.5? (Hint: you should
First calculate the 95% confidence interval for the mean magnesium ion concentration.)
A) No
B) The likelihood cannot be determined.
C) Yes
Approximately normal.
Based on a 95% confidence interval for the mean magnesium ion concentration, is it reasonable toBelieve that the mean magnesium ion concentration may be greater than 199.5? (Hint: you should
First calculate the 95% confidence interval for the mean magnesium ion concentration.)
A) No
B) The likelihood cannot be determined.
C) Yes
سؤال
The following MINITAB output presents a 95% confidence interval. 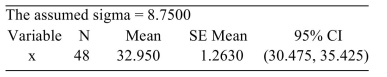
Find the sample size needed so that the 99% confidence interval will have a margin of error of 1.3.
A) 301
B) 14
C) 175
D) 246
Find the sample size needed so that the 99% confidence interval will have a margin of error of 1.3.
A) 301
B) 14
C) 175
D) 246
سؤال
سؤال
Boxes of raisins are labeled as containing 22 ounces. Following are the weights, in ounces, of a sample of 12 boxes. It is reasonable to assume that the population is approximately normal. 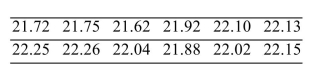 Construct a 95% confidence interval for the mean weight.
A) (21.847, 22.126)
B) (21.782, 22.192)
C) (21.853, 22.120)
D) (21.790, 22.183)
Construct a 95% confidence interval for the mean weight.A) (21.847, 22.126)
B) (21.782, 22.192)
C) (21.853, 22.120)
D) (21.790, 22.183)
سؤال
سؤال
Following are the heights in inches of 12 two-year-old apple trees. Assume that the population is normally distributed. 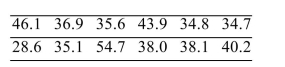 Construct a 99% confidence interval for the population standard deviation σ.
A) (4.39, 13.31)
B) (4.20, 12.75)
C) (4.32, 13.85)
D) (4.49, 12.79)
Construct a 99% confidence interval for the population standard deviation σ.A) (4.39, 13.31)
B) (4.20, 12.75)
C) (4.32, 13.85)
D) (4.49, 12.79)
سؤال
The following MINITAB output presents a confidence interval for a proportion. 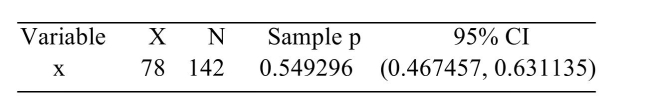 Fill in the blanks: We are ________ confident that the population mean is between _______ and _______.
A) 5%, 0.467457,0.631135
B) 95%, 0.480610,0.617982
C) 95%, 0.467457,0.631135
D) 97.5%, 0.480610,0.617982
Fill in the blanks: We are ________ confident that the population mean is between _______ and _______. A) 5%, 0.467457,0.631135
B) 95%, 0.480610,0.617982
C) 95%, 0.467457,0.631135
D) 97.5%, 0.480610,0.617982
سؤال
Scores on the math SAT are normally distributed. A sample of 15 SAT scores had a standard deviation s = 80. Construct a 95% confidence interval for the population standard deviation 
A) (61.51, 116.78)
B) (57.09, 119.62)
C) (59.10, 123.82)
D) (58.57, 126.17)
A) (61.51, 116.78)
B) (57.09, 119.62)
C) (59.10, 123.82)
D) (58.57, 126.17)
سؤال
Measurements were made of the milk fat content (in percent) in six brands of feta cheese (a variety of goat cheese), with the following results. Assume that the population is normally distributed. 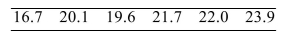 Construct a 90% confidence interval for the population standard deviation σ.
A) (1.66, 5.16)
B) (1.56, 4.32)
C) (1.70, 4.73)
D) (1.82, 4.35)
Construct a 90% confidence interval for the population standard deviation σ.A) (1.66, 5.16)
B) (1.56, 4.32)
C) (1.70, 4.73)
D) (1.82, 4.35)
سؤال
سؤال
سؤال
A simple random sample of size 41 has mean  and standard deviation s = 15.73. The population distribution is unknown. Determine the correct method of finding a 90% confidence
Interval for the population mean and compute it.
A) t-method: (66.41, 74.69)
B) z-method: (66.41, 74.69)
C) z-method: (66.51, 74.59)
D) Cannot compute: the population size is too small.
and standard deviation s = 15.73. The population distribution is unknown. Determine the correct method of finding a 90% confidenceInterval for the population mean and compute it.
A) t-method: (66.41, 74.69)
B) z-method: (66.41, 74.69)
C) z-method: (66.51, 74.59)
D) Cannot compute: the population size is too small.
سؤال
سؤال
سؤال
سؤال
سؤال
The following display from a TI-84 Plus calculator presents a 99% confidence interval for a proportion. 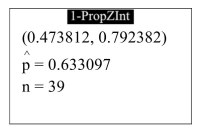 Fill in the blanks: We are ________ confident that the population mean is between _______ and _______.
A) 99%, 0,0.633097
B) 1%, 0,0.633097
C) 99%, 0.473812,0.792382
D) 1%, 0.473812,0.792382
Fill in the blanks: We are ________ confident that the population mean is between _______ and _______. A) 99%, 0,0.633097
B) 1%, 0,0.633097
C) 99%, 0.473812,0.792382
D) 1%, 0.473812,0.792382
سؤال
The following MINITAB output presents a confidence interval for a proportion. 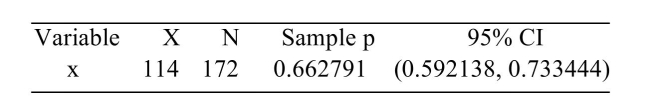 Use the information in the display to construct a 98% confidence interval for p.
A) (0.592, 0.733)
B) (0.603, 0.722)
C) (0.579, 0.747)
D) (0.570, 0.756)
Use the information in the display to construct a 98% confidence interval for p.A) (0.592, 0.733)
B) (0.603, 0.722)
C) (0.579, 0.747)
D) (0.570, 0.756)
سؤال
سؤال
Construct a 90% confidence interval for the population standard deviation  if a sample of size 8 has standard deviation s = 20.
A) (14.11, 35.94)
B) (14.37, 34.22)
C) (15.26, 31.44)
D) (13.44, 32.01)
if a sample of size 8 has standard deviation s = 20.A) (14.11, 35.94)
B) (14.37, 34.22)
C) (15.26, 31.44)
D) (13.44, 32.01)
سؤال
سؤال
سؤال
سؤال
The following display from a TI-84 Plus calculator presents a 99% confidence interval for a proportion. 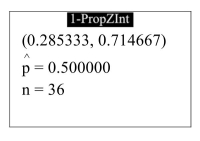 Use the information in the display to construct a 95% confidence interval for p.
A) (0.348, 0.652)
B) (0.285, 0.715)
C) (0.363, 0.637)
D) (0.337, 0.663)
Use the information in the display to construct a 95% confidence interval for p.A) (0.348, 0.652)
B) (0.285, 0.715)
C) (0.363, 0.637)
D) (0.337, 0.663)
سؤال
A simple random sample of size 51 has mean  . The population distribution is approximately normal, with standard deviation
  . Determine the correct method of finding
A 95% confidence interval for the population mean and compute it.
A) z-method: (66.15, 75.29)
B) Cannot compute: the population size is too small.
C) t-method: (66.15, 75.29)
D) z-method: (66.26, 75.18)
. The population distribution is approximately normal, with standard deviation . Determine the correct method of findingA 95% confidence interval for the population mean and compute it.
A) z-method: (66.15, 75.29)
B) Cannot compute: the population size is too small.
C) t-method: (66.15, 75.29)
D) z-method: (66.26, 75.18)
سؤال
A simple random sample of size 20 has mean  and standard deviation s = 16.77. The population distribution is unknown. Determine the correct method of finding a 90% confidence
Interval for the population mean and compute it.
A) Cannot compute: the population size is too small.
B) z-method: (64.72, 77.06)
C) t-method: (64.41, 77.37)
D) z-method: (64.41, 77.37)
and standard deviation s = 16.77. The population distribution is unknown. Determine the correct method of finding a 90% confidenceInterval for the population mean and compute it.
A) Cannot compute: the population size is too small.
B) z-method: (64.72, 77.06)
C) t-method: (64.41, 77.37)
D) z-method: (64.41, 77.37)

فتح الحزمة
قم بالتسجيل لفتح البطاقات في هذه المجموعة!
Unlock Deck
Unlock Deck
1/62
العب
ملء الشاشة (f)
Deck 8: Confidence Intervals
1
Find the confidence level for an interval which has a critical value of 1.05.
A) 85.31%
B) 14.69%
C) 70.63%
D) 29.37%
A) 85.31%
B) 14.69%
C) 70.63%
D) 29.37%
70.63%
2
In a small-overlap front crash test, a car is crashed into a simulated telephone pole and the maximum intrusion of debris into the passenger compartment of a specific model of car is
Measured. This intrusion is normally distributed with a standard deviation of 2.5 cm.
How many cars must be crashed to establish that a 98% confidence interval for the mean intrusion of
Debris into the passenger compartment will have a margin of error of 0.3 cm?
A) 49
B) 376
C) 1
D) 20
Measured. This intrusion is normally distributed with a standard deviation of 2.5 cm.
How many cars must be crashed to establish that a 98% confidence interval for the mean intrusion of
Debris into the passenger compartment will have a margin of error of 0.3 cm?
A) 49
B) 376
C) 1
D) 20
376
3
The three confidence intervals below were constructed from the same sample. One of them was computed at a confidence level of 90%, another at a confidence level of 95%, and another at a confidence level of 98%.
Which is the confidence level at 98%?
A)
B)
C) cannot be determined
D)
Which is the confidence level at 98%?
A)
B)
C) cannot be determined
D)
4
A college admissions officer takes a simple random sample of 60 entering freshmen and computes their mean mathematics SAT score to be 439. Assume the population standard deviation is Based on a 98% confidence interval for the mean mathematics SAT score, is it likely that the mean
Mathematics SAT score for entering freshmen class is greater than 456? (Hint: you should first
Construct the 98% confidence interval for the mean mathematics SAT score.)
A) No
B) The likelihood cannot be determined.
C) Yes
Based on a 98% confidence interval for the mean mathematics SAT score, is it likely that the meanMathematics SAT score for entering freshmen class is greater than 456? (Hint: you should first
Construct the 98% confidence interval for the mean mathematics SAT score.)
A) No
B) The likelihood cannot be determined.
C) Yes
فتح الحزمة
افتح القفل للوصول البطاقات البالغ عددها 62 في هذه المجموعة.
فتح الحزمة
k this deck
5
A random sample of a specific brand of snack bar is tested for calorie count, with the following results: Assume the population standard deviation is and that the population is approximately normal. Construct a 95% confidence interval for the calorie count of the snack bars.
A) (139.8, 152.2)
B) (99.0, 193.0)
C) (140.1, 151.9)
D) (130.3, 161.7)
Assume the population standard deviation is and that the population is approximately normal. Construct a 95% confidence interval for the calorie count of the snack bars.A) (139.8, 152.2)
B) (99.0, 193.0)
C) (140.1, 151.9)
D) (130.3, 161.7)
فتح الحزمة
افتح القفل للوصول البطاقات البالغ عددها 62 في هذه المجموعة.
فتح الحزمة
k this deck
6
A college admissions officer takes a simple random sample of 110 entering freshmen and computes their mean mathematics SAT score to be 465. Assume the population standard deviation is Construct a 90% confidence interval for the mean mathematics SAT score for the entering freshmen
Class.
A) (463, 467)
B) (451, 479)
C) (373, 557)
D) (446, 484)
Construct a 90% confidence interval for the mean mathematics SAT score for the entering freshmenClass.
A) (463, 467)
B) (451, 479)
C) (373, 557)
D) (446, 484)
فتح الحزمة
افتح القفل للوصول البطاقات البالغ عددها 62 في هذه المجموعة.
فتح الحزمة
k this deck
7
Find the critical value needed to construct a(n) 99.3% confidence interval.
A) 2.46
B) 2.70
C) 3.59
D) 2.35
needed to construct a(n) 99.3% confidence interval.A) 2.46
B) 2.70
C) 3.59
D) 2.35
فتح الحزمة
افتح القفل للوصول البطاقات البالغ عددها 62 في هذه المجموعة.
فتح الحزمة
k this deck
8
A sample of size n = 42 is drawn from a population whose standard deviation is Find the margin of error for a 95% confidence interval for
A) 1.49
B) 1.31
C) 0.88
D) 2.57
Find the margin of error for a 95% confidence interval for A) 1.49
B) 1.31
C) 0.88
D) 2.57
فتح الحزمة
افتح القفل للوصول البطاقات البالغ عددها 62 في هذه المجموعة.
فتح الحزمة
k this deck
9
A sample of size n = 16 is drawn from an approximately normal population whose standard deviation is The sample mean is Construct a 99% confidence interval for
A) (48.91, 53.09)
B) (38.28, 63.72)
C) 44.24, 57.76
D) (51.00, 57.76)
The sample mean is Construct a 99% confidence interval for A) (48.91, 53.09)
B) (38.28, 63.72)
C) 44.24, 57.76
D) (51.00, 57.76)
فتح الحزمة
افتح القفل للوصول البطاقات البالغ عددها 62 في هذه المجموعة.
فتح الحزمة
k this deck
10
Scientists want to estimate the mean weight gain of mice after they have been fed a special diet. From previous studies, it is known that the weight gain is normally distributed with standard
Deviation 2 grams.
How many mice must be weighed so that a 99% confidence interval for mean weight will have a margin
Of error of 0.4 grams?
A) 26
B) 1
C) 13
D) 166
Deviation 2 grams.
How many mice must be weighed so that a 99% confidence interval for mean weight will have a margin
Of error of 0.4 grams?
A) 26
B) 1
C) 13
D) 166
فتح الحزمة
افتح القفل للوصول البطاقات البالغ عددها 62 في هذه المجموعة.
فتح الحزمة
k this deck
11
Find the critical value needed to construct a(n) 97% confidence interval.
A) 2.17
B) 1.88
C) 2.75
D) 1.92
needed to construct a(n) 97% confidence interval.A) 2.17
B) 1.88
C) 2.75
D) 1.92
فتح الحزمة
افتح القفل للوصول البطاقات البالغ عددها 62 في هذه المجموعة.
فتح الحزمة
k this deck
12
A population has a standard deviation How large a sample must be drawn so that a 98% confidence interval for μ will have a margin of error equal to 4.1?
A) 192
B) 5
C) 109
D) 10
How large a sample must be drawn so that a 98% confidence interval for μ will have a margin of error equal to 4.1?A) 192
B) 5
C) 109
D) 10
فتح الحزمة
افتح القفل للوصول البطاقات البالغ عددها 62 في هذه المجموعة.
فتح الحزمة
k this deck
13
The following MINITAB output presents a 95% confidence interval.
Fill in the blanks: We are______ confident that the population mean is between ________and________
A) 5%, 46.270,51.416
B) 95%, 0,48.843
C) 95%, 46.270,51.416
D) 5%, 0,48.843
Fill in the blanks: We are______ confident that the population mean is between ________and________
A) 5%, 46.270,51.416
B) 95%, 0,48.843
C) 95%, 46.270,51.416
D) 5%, 0,48.843
فتح الحزمة
افتح القفل للوصول البطاقات البالغ عددها 62 في هذه المجموعة.
فتح الحزمة
k this deck
14
A random sample of electronic components had the following operational times before failure, in hours. Assume the population standard deviation is and that the population is approximately normal. Construct a 90% confidence interval for the operational time before failure.
A) (318.9, 358.4)
B) (331.3, 346.1)
C) (279.4, 397.9)
D) (332.1, 345.3)
Assume the population standard deviation is and that the population is approximately normal. Construct a 90% confidence interval for the operational time before failure.A) (318.9, 358.4)
B) (331.3, 346.1)
C) (279.4, 397.9)
D) (332.1, 345.3)
فتح الحزمة
افتح القفل للوصول البطاقات البالغ عددها 62 في هذه المجموعة.
فتح الحزمة
k this deck
15
The following display from a TI-84 Plus calculator presents a 95% confidence interval. Fill in the blanks: We are ________ confident that the population mean is between _______ and _______.
A) 5%, 0, 46.695
B) 95%, 0, 46.695
C) 95%, 42.447, 50.943
D) 5%, 42.447, 50.943
Fill in the blanks: We are ________ confident that the population mean is between _______ and _______.A) 5%, 0, 46.695
B) 95%, 0, 46.695
C) 95%, 42.447, 50.943
D) 5%, 42.447, 50.943
فتح الحزمة
افتح القفل للوصول البطاقات البالغ عددها 62 في هذه المجموعة.
فتح الحزمة
k this deck
16
A random sample of 60 adults is chosen and their mean serum cholesterol level is found to be 196 milligrams per deciliter. Assuming that the population standard deviation is , compute a 99%
Confidence interval for the mean serum cholesterol level for adults.
A) (153, 239)
B) (172, 220)
C) (182, 210)
D) (194, 198)
, compute a 99%Confidence interval for the mean serum cholesterol level for adults.
A) (153, 239)
B) (172, 220)
C) (182, 210)
D) (194, 198)
فتح الحزمة
افتح القفل للوصول البطاقات البالغ عددها 62 في هذه المجموعة.
فتح الحزمة
k this deck
17
A sample of 36 light bulbs had a mean lifetime of 508 hours. A 95% confidence interval for the population mean was Which one of the following statements is the correct interpretation of the results?
A) 95% of the light bulbs in the sample had lifetimes between 500.8 hours and 515.2 hours
B) None of these are true.
C) We are 95% confident that the mean lifetime of all the bulbs in the population is between 500.8 hours and 515.2 hours.
D) The probability that the population mean is between 500.8 hours and 515.2 hours is 0.95.
Which one of the following statements is the correct interpretation of the results?A) 95% of the light bulbs in the sample had lifetimes between 500.8 hours and 515.2 hours
B) None of these are true.
C) We are 95% confident that the mean lifetime of all the bulbs in the population is between 500.8 hours and 515.2 hours.
D) The probability that the population mean is between 500.8 hours and 515.2 hours is 0.95.
فتح الحزمة
افتح القفل للوصول البطاقات البالغ عددها 62 في هذه المجموعة.
فتح الحزمة
k this deck
18
A random sample of 9 TI-89 Titanium calculators being sold over the internet had the following prices, in dollars. Assume the population standard deviation is and that the population is approximately normal.
Construct a 90% confidence interval for the mean price for all the TI-89's being sold over the
Internet.
A) (134.6, 147.9)
B) (122.6, 159.9)
C) (85.3, 197.2)
D) (134.2, 148.2)
Assume the population standard deviation is and that the population is approximately normal.Construct a 90% confidence interval for the mean price for all the TI-89's being sold over the
Internet.
A) (134.6, 147.9)
B) (122.6, 159.9)
C) (85.3, 197.2)
D) (134.2, 148.2)
فتح الحزمة
افتح القفل للوصول البطاقات البالغ عددها 62 في هذه المجموعة.
فتح الحزمة
k this deck
19
A random sample of 80 adults is chosen and their mean serum cholesterol level is found to be 202 milligrams per deciliter. Assume that the population standard deviation is Based on a 95% confidence interval for the mean serum cholesterol, is it likely that the mean serum
Cholesterol is greater than 219? (Hint: you should first construct the 95% confidence interval.)
A) No
B) The likelihood cannot be determined.
C) Yes
Based on a 95% confidence interval for the mean serum cholesterol, is it likely that the mean serumCholesterol is greater than 219? (Hint: you should first construct the 95% confidence interval.)
A) No
B) The likelihood cannot be determined.
C) Yes
فتح الحزمة
افتح القفل للوصول البطاقات البالغ عددها 62 في هذه المجموعة.
فتح الحزمة
k this deck
20
A simple random sample of kitchen toasters is to be taken to determine the mean operational lifetime in hours. Assume that the lifetimes are normally distributed with population standard
Deviation hours.
Find the sample size needed so that a 98% confidence interval for the mean lifetime will have a margin
Of error of 4.
A) 13
B) 150
C) 3
D) 257
Deviation
hours.Find the sample size needed so that a 98% confidence interval for the mean lifetime will have a margin
Of error of 4.
A) 13
B) 150
C) 3
D) 257
فتح الحزمة
افتح القفل للوصول البطاقات البالغ عددها 62 في هذه المجموعة.
فتح الحزمة
k this deck
21
Six measurements were made of the magnesium ion concentration (in parts per million, or ppm) in a city's municipal water supply, with the following results. It is reasonable to assume that the population is
Approximately normal. Construct a 99% confidence interval for the mean magnesium ion concentration.
A) (151.4, 156.9)
B) (137.0, 171.3)
C) (138.5, 169.8)
D) (151.6, 156.7)
Approximately normal.
Construct a 99% confidence interval for the mean magnesium ion concentration.A) (151.4, 156.9)
B) (137.0, 171.3)
C) (138.5, 169.8)
D) (151.6, 156.7)
فتح الحزمة
افتح القفل للوصول البطاقات البالغ عددها 62 في هذه المجموعة.
فتح الحزمة
k this deck
22
A sample of size n = 14 has a sample mean and sample standard deviation s = 2.1. It is reasonable to assume that the population is approximately normal. Construct a 99% confidence
Interval for the population mean
A) (10.7, 13.1)
B) (11.4, 12.4)
C) (10.2, 13.6)
D) (10.4, 13.4)
and sample standard deviation s = 2.1. It is reasonable to assume that the population is approximately normal. Construct a 99% confidenceInterval for the population mean
A) (10.7, 13.1)
B) (11.4, 12.4)
C) (10.2, 13.6)
D) (10.4, 13.4)
فتح الحزمة
افتح القفل للوصول البطاقات البالغ عددها 62 في هذه المجموعة.
فتح الحزمة
k this deck
23
In a sample of 8 children, the mean age at which they first began to combine words was 16.41 months, with a standard deviation of 5.11 months. It is reasonable to assume that the population is
Approximately normal. Construct a 95% confidence interval for the mean age at which children first
Begin to combine words.
A) (15.7, 17.1)
B) (-17.8, 50.6)
C) (14.9, 17.9)
D) (12.1, 20.7)
Approximately normal. Construct a 95% confidence interval for the mean age at which children first
Begin to combine words.
A) (15.7, 17.1)
B) (-17.8, 50.6)
C) (14.9, 17.9)
D) (12.1, 20.7)
فتح الحزمة
افتح القفل للوصول البطاقات البالغ عددها 62 في هذه المجموعة.
فتح الحزمة
k this deck
24
The following MINITAB output presents a confidence interval for a population mean. Find the critical value for a 98% confidence interval.
A) 2.462
B) 2.457
C) 2.750
D) 2.760
Find the critical value for a 98% confidence interval.A) 2.462
B) 2.457
C) 2.750
D) 2.760
فتح الحزمة
افتح القفل للوصول البطاقات البالغ عددها 62 في هذه المجموعة.
فتح الحزمة
k this deck
25
A sample of 69 tobacco smokers who recently completed a new smoking-cessation program were asked to rate the effectiveness of the program on a scale of 1 to 10, with 10 corresponding to
"completely effective" and 1 corresponding to "completely ineffective". The average rating was 4.5
And the standard deviation was 4.3.
Construct a 95% confidence interval for the mean score.
A) (4.0, 5.0)
B) (0, 4.5)
C) (3.5, 5.5)
D) (4.1, 4.9)
"completely effective" and 1 corresponding to "completely ineffective". The average rating was 4.5
And the standard deviation was 4.3.
Construct a 95% confidence interval for the mean score.
A) (4.0, 5.0)
B) (0, 4.5)
C) (3.5, 5.5)
D) (4.1, 4.9)
فتح الحزمة
افتح القفل للوصول البطاقات البالغ عددها 62 في هذه المجموعة.
فتح الحزمة
k this deck
26
The following MINITAB output presents a 95% confidence interval.
Use the appropriate critical value along with the information in the computer output to construct a 99 confidence interval.
A) (44.845,51.835)
B) (45.185,51.495)
C) (47.206,49.474)
D) (45.681,50.999)
Use the appropriate critical value along with the information in the computer output to construct a 99 confidence interval.
A) (44.845,51.835)
B) (45.185,51.495)
C) (47.206,49.474)
D) (45.681,50.999)
فتح الحزمة
افتح القفل للوصول البطاقات البالغ عددها 62 في هذه المجموعة.
فتح الحزمة
k this deck
27
The following MINITAB output presents a 95% confidence interval.
Find the sample size needed so that the 95% confidence interval will have a margin of error of 1.1.
A) 472
B) 579
C) 19
D) 336
Find the sample size needed so that the 95% confidence interval will have a margin of error of 1.1.
A) 472
B) 579
C) 19
D) 336
فتح الحزمة
افتح القفل للوصول البطاقات البالغ عددها 62 في هذه المجموعة.
فتح الحزمة
k this deck
28
The following MINITAB output presents a confidence interval for a population mean. Use the information in the output to construct a 98% confidence interval.
A) (92.161,124.093)
B) (105.546,110.707)
C) (93.878,122.376)
D) (105.235,111.018)
Use the information in the output to construct a 98% confidence interval. A) (92.161,124.093)
B) (105.546,110.707)
C) (93.878,122.376)
D) (105.235,111.018)
فتح الحزمة
افتح القفل للوصول البطاقات البالغ عددها 62 في هذه المجموعة.
فتح الحزمة
k this deck
29
Find the point estimate for the given values of x and n.
A) 106
B) 0.4564
C) 0.5436
D) 0.03567
A) 106
B) 0.4564
C) 0.5436
D) 0.03567
فتح الحزمة
افتح القفل للوصول البطاقات البالغ عددها 62 في هذه المجموعة.
فتح الحزمة
k this deck
30
Use the given data to construct a confidence interval of the requested level. x = 78, n = 124, confidence level 98%
A) (0.586, 0.672)
B) (0.394, 0.864)
C) (0.544, 0.714)
D) (0.528, 0.730)
A) (0.586, 0.672)
B) (0.394, 0.864)
C) (0.544, 0.714)
D) (0.528, 0.730)
فتح الحزمة
افتح القفل للوصول البطاقات البالغ عددها 62 في هذه المجموعة.
فتح الحزمة
k this deck
31
The following MINITAB output presents a confidence interval for a population mean. How many degrees of freedom are there?
A) 66
B) 3.2236
C) 68
D) 67
How many degrees of freedom are there?A) 66
B) 3.2236
C) 68
D) 67
فتح الحزمة
افتح القفل للوصول البطاقات البالغ عددها 62 في هذه المجموعة.
فتح الحزمة
k this deck
32
A sample of size n = 16 is drawn from a normal population. Find the critical value needed to construct a 90% confidence interval.
A) 1.645
B) 1.341
C) 1.746
D) 1.753
needed to construct a 90% confidence interval.A) 1.645
B) 1.341
C) 1.746
D) 1.753
فتح الحزمة
افتح القفل للوصول البطاقات البالغ عددها 62 في هذه المجموعة.
فتح الحزمة
k this deck
33
Find the critical value needed to construct a confidence interval of the given level with the given sample size.
Level 98%, sample size 5
A) 3.365
B) 2.999
C) 2.326
D) 3.747
needed to construct a confidence interval of the given level with the given sample size.Level 98%, sample size 5
A) 3.365
B) 2.999
C) 2.326
D) 3.747
فتح الحزمة
افتح القفل للوصول البطاقات البالغ عددها 62 في هذه المجموعة.
فتح الحزمة
k this deck
34
The following display from a TI-84 Plus calculator presents a 95% confidence interval. Fill in the blanks: We are ________ confident that the population mean is between _______ and _______.
A) 95%, 52.45,54.30
B) 95%, 0,53.375
C) 5%, 0,53.375
D) 5%, 52.45,54.30
Fill in the blanks: We are ________ confident that the population mean is between _______ and _______. A) 95%, 52.45,54.30
B) 95%, 0,53.375
C) 5%, 0,53.375
D) 5%, 52.45,54.30
فتح الحزمة
افتح القفل للوصول البطاقات البالغ عددها 62 في هذه المجموعة.
فتح الحزمة
k this deck
35
Find the standard error for the given values of x and n. x = 95, n = 158
A) 0.6013
B) 95
C) 0.03895
D) 0.3987
A) 0.6013
B) 95
C) 0.03895
D) 0.3987
فتح الحزمة
افتح القفل للوصول البطاقات البالغ عددها 62 في هذه المجموعة.
فتح الحزمة
k this deck
36
A survey asked 26 adults how many years of education they had. The sample mean was 13.03 with a standard deviation of 3.22. It is reasonable to assume that the population is approximately normal.
Construct a 90% confidence interval for the mean number of years of education.
A) (-14.1, 14.1)
B) (12.8, 13.2)
C) (-15.0, 41.1)
D) (12.0, 14.1)
Construct a 90% confidence interval for the mean number of years of education.
A) (-14.1, 14.1)
B) (12.8, 13.2)
C) (-15.0, 41.1)
D) (12.0, 14.1)
فتح الحزمة
افتح القفل للوصول البطاقات البالغ عددها 62 في هذه المجموعة.
فتح الحزمة
k this deck
37
Six measurements were made of the magnesium ion concentration (in parts per million, or ppm) in a city's municipal water supply, with the following results. It is reasonable to assume that the population is
Approximately normal. Based on a 95% confidence interval for the mean magnesium ion concentration, is it reasonable to
Believe that the mean magnesium ion concentration may be greater than 199.5? (Hint: you should
First calculate the 95% confidence interval for the mean magnesium ion concentration.)
A) No
B) The likelihood cannot be determined.
C) Yes
Approximately normal.
Based on a 95% confidence interval for the mean magnesium ion concentration, is it reasonable toBelieve that the mean magnesium ion concentration may be greater than 199.5? (Hint: you should
First calculate the 95% confidence interval for the mean magnesium ion concentration.)
A) No
B) The likelihood cannot be determined.
C) Yes
فتح الحزمة
افتح القفل للوصول البطاقات البالغ عددها 62 في هذه المجموعة.
فتح الحزمة
k this deck
38
The following MINITAB output presents a 95% confidence interval.
Find the sample size needed so that the 99% confidence interval will have a margin of error of 1.3.
A) 301
B) 14
C) 175
D) 246
Find the sample size needed so that the 99% confidence interval will have a margin of error of 1.3.
A) 301
B) 14
C) 175
D) 246
فتح الحزمة
افتح القفل للوصول البطاقات البالغ عددها 62 في هذه المجموعة.
فتح الحزمة
k this deck
39
Find the margin of error for the given confidence level and values of x and n. x = 118, n = 252, confidence level 98%
A) 0.03143
B) 0.07311
C) 0.4683
D) 0.5317
A) 0.03143
B) 0.07311
C) 0.4683
D) 0.5317
فتح الحزمة
افتح القفل للوصول البطاقات البالغ عددها 62 في هذه المجموعة.
فتح الحزمة
k this deck
40
Boxes of raisins are labeled as containing 22 ounces. Following are the weights, in ounces, of a sample of 12 boxes. It is reasonable to assume that the population is approximately normal. Construct a 95% confidence interval for the mean weight.
A) (21.847, 22.126)
B) (21.782, 22.192)
C) (21.853, 22.120)
D) (21.790, 22.183)
Construct a 95% confidence interval for the mean weight.A) (21.847, 22.126)
B) (21.782, 22.192)
C) (21.853, 22.120)
D) (21.790, 22.183)
فتح الحزمة
افتح القفل للوصول البطاقات البالغ عددها 62 في هذه المجموعة.
فتح الحزمة
k this deck
41
In a survey of 318 registered voters, 176 of them wished to see Mayor Waffleskate lose her next election. Construct a 95% confidence interval for the proportion of registered voter who want to see
Mayor Waffleskate defeated.
A) (0.526, 0.581)
B) (0.446, 0.661)
C) 0.508, 0.599)
D) (0.499, 0.608)
Mayor Waffleskate defeated.
A) (0.526, 0.581)
B) (0.446, 0.661)
C) 0.508, 0.599)
D) (0.499, 0.608)
فتح الحزمة
افتح القفل للوصول البطاقات البالغ عددها 62 في هذه المجموعة.
فتح الحزمة
k this deck
42
Following are the heights in inches of 12 two-year-old apple trees. Assume that the population is normally distributed. Construct a 99% confidence interval for the population standard deviation σ.
A) (4.39, 13.31)
B) (4.20, 12.75)
C) (4.32, 13.85)
D) (4.49, 12.79)
Construct a 99% confidence interval for the population standard deviation σ.A) (4.39, 13.31)
B) (4.20, 12.75)
C) (4.32, 13.85)
D) (4.49, 12.79)
فتح الحزمة
افتح القفل للوصول البطاقات البالغ عددها 62 في هذه المجموعة.
فتح الحزمة
k this deck
43
The following MINITAB output presents a confidence interval for a proportion. Fill in the blanks: We are ________ confident that the population mean is between _______ and _______.
A) 5%, 0.467457,0.631135
B) 95%, 0.480610,0.617982
C) 95%, 0.467457,0.631135
D) 97.5%, 0.480610,0.617982
Fill in the blanks: We are ________ confident that the population mean is between _______ and _______. A) 5%, 0.467457,0.631135
B) 95%, 0.480610,0.617982
C) 95%, 0.467457,0.631135
D) 97.5%, 0.480610,0.617982
فتح الحزمة
افتح القفل للوصول البطاقات البالغ عددها 62 في هذه المجموعة.
فتح الحزمة
k this deck
44
Scores on the math SAT are normally distributed. A sample of 15 SAT scores had a standard deviation s = 80. Construct a 95% confidence interval for the population standard deviation
A) (61.51, 116.78)
B) (57.09, 119.62)
C) (59.10, 123.82)
D) (58.57, 126.17)
A) (61.51, 116.78)
B) (57.09, 119.62)
C) (59.10, 123.82)
D) (58.57, 126.17)
فتح الحزمة
افتح القفل للوصول البطاقات البالغ عددها 62 في هذه المجموعة.
فتح الحزمة
k this deck
45
Measurements were made of the milk fat content (in percent) in six brands of feta cheese (a variety of goat cheese), with the following results. Assume that the population is normally distributed. Construct a 90% confidence interval for the population standard deviation σ.
A) (1.66, 5.16)
B) (1.56, 4.32)
C) (1.70, 4.73)
D) (1.82, 4.35)
Construct a 90% confidence interval for the population standard deviation σ.A) (1.66, 5.16)
B) (1.56, 4.32)
C) (1.70, 4.73)
D) (1.82, 4.35)
فتح الحزمة
افتح القفل للوصول البطاقات البالغ عددها 62 في هذه المجموعة.
فتح الحزمة
k this deck
46
In a survey of 464 registered voters, 133 of them wished to see Mayor Waffleskate lose her next election. The Waffleskate campaign claims that no more than 29% of registered voters wish to see
Her defeated. Does the 98% confidence interval for the proportion support this claim? (Hint: you
Should first construct the 98% confidence interval for the proportion of registered voters who wish
To see Waffleskate defeated.)
A) Yes
B) No
C) The reasonableness of the claim cannot be determined.
Her defeated. Does the 98% confidence interval for the proportion support this claim? (Hint: you
Should first construct the 98% confidence interval for the proportion of registered voters who wish
To see Waffleskate defeated.)
A) Yes
B) No
C) The reasonableness of the claim cannot be determined.
فتح الحزمة
افتح القفل للوصول البطاقات البالغ عددها 62 في هذه المجموعة.
فتح الحزمة
k this deck
47
An Internet service provider sampled 590 customers and found that 85 of them experienced an interruption in their service during the previous month. Find a point estimate for the population
Proportion of all customers who experienced an interruption.
A) 85
B) 0.1441
C) 0.8559
D) 0.0145
Proportion of all customers who experienced an interruption.
A) 85
B) 0.1441
C) 0.8559
D) 0.0145
فتح الحزمة
افتح القفل للوصول البطاقات البالغ عددها 62 في هذه المجموعة.
فتح الحزمة
k this deck
48
A simple random sample of size 41 has mean and standard deviation s = 15.73. The population distribution is unknown. Determine the correct method of finding a 90% confidence
Interval for the population mean and compute it.
A) t-method: (66.41, 74.69)
B) z-method: (66.41, 74.69)
C) z-method: (66.51, 74.59)
D) Cannot compute: the population size is too small.
and standard deviation s = 15.73. The population distribution is unknown. Determine the correct method of finding a 90% confidenceInterval for the population mean and compute it.
A) t-method: (66.41, 74.69)
B) z-method: (66.41, 74.69)
C) z-method: (66.51, 74.59)
D) Cannot compute: the population size is too small.
فتح الحزمة
افتح القفل للوصول البطاقات البالغ عددها 62 في هذه المجموعة.
فتح الحزمة
k this deck
49
An Internet service provider sampled 540 customers and found that 55 of them experienced an interruption in their service during the previous month. Construct a 95% confidence interval for the
Proportion of all customers who have experienced a service interruption.
A) (0.076, 0.127)
B) (0.873, 0.924)
C) (0.102, 0.898)
D) (0.080, 0.123)
Proportion of all customers who have experienced a service interruption.
A) (0.076, 0.127)
B) (0.873, 0.924)
C) (0.102, 0.898)
D) (0.080, 0.123)
فتح الحزمة
افتح القفل للوصول البطاقات البالغ عددها 62 في هذه المجموعة.
فتح الحزمة
k this deck
50
Find the critical values for a 98% confidence interval using the chi-square distribution with 20 degrees of freedom.
A) 7.633, 36.191
B) 7.434, 39.997
C) 8.260, 37.566
D) 9.237, 35.020
A) 7.633, 36.191
B) 7.434, 39.997
C) 8.260, 37.566
D) 9.237, 35.020
فتح الحزمة
افتح القفل للوصول البطاقات البالغ عددها 62 في هذه المجموعة.
فتح الحزمة
k this deck
51
An Internet service provider sampled 570 customers and found that 70 of them experienced an interruption in their service during the previous month. The company claims that no more than 10%
Of customers experienced an interruption in the past month. Does the 95% confidence interval for
The proportion support this claim? (Hint: you should first construct the 95% confidence interval for
The proportion of customers who experienced an interruption.)
A) Yes
B) No
C) The reasonableness of the claim cannot be determined.
فتح الحزمة
افتح القفل للوصول البطاقات البالغ عددها 62 في هذه المجموعة.
فتح الحزمة
k this deck
52
Twenty-two concrete blocks were sampled and tested for crushing strength in order to estimate the proportion that were sufficiently strong for a certain application. Eighteen of the 22 blocks were
Sufficiently strong. Use the small-sample method to construct a 95% confidence interval for the
Proportion of blocks that are sufficiently strong.
A) (0.593, 0.945)
B) (0.657, 0.979)
C) (0.633, 0.905)
D) (0.607, 0.931)
Sufficiently strong. Use the small-sample method to construct a 95% confidence interval for the
Proportion of blocks that are sufficiently strong.
A) (0.593, 0.945)
B) (0.657, 0.979)
C) (0.633, 0.905)
D) (0.607, 0.931)
فتح الحزمة
افتح القفل للوصول البطاقات البالغ عددها 62 في هذه المجموعة.
فتح الحزمة
k this deck
53
The following display from a TI-84 Plus calculator presents a 99% confidence interval for a proportion. Fill in the blanks: We are ________ confident that the population mean is between _______ and _______.
A) 99%, 0,0.633097
B) 1%, 0,0.633097
C) 99%, 0.473812,0.792382
D) 1%, 0.473812,0.792382
Fill in the blanks: We are ________ confident that the population mean is between _______ and _______. A) 99%, 0,0.633097
B) 1%, 0,0.633097
C) 99%, 0.473812,0.792382
D) 1%, 0.473812,0.792382
فتح الحزمة
افتح القفل للوصول البطاقات البالغ عددها 62 في هذه المجموعة.
فتح الحزمة
k this deck
54
The following MINITAB output presents a confidence interval for a proportion. Use the information in the display to construct a 98% confidence interval for p.
A) (0.592, 0.733)
B) (0.603, 0.722)
C) (0.579, 0.747)
D) (0.570, 0.756)
Use the information in the display to construct a 98% confidence interval for p.A) (0.592, 0.733)
B) (0.603, 0.722)
C) (0.579, 0.747)
D) (0.570, 0.756)
فتح الحزمة
افتح القفل للوصول البطاقات البالغ عددها 62 في هذه المجموعة.
فتح الحزمة
k this deck
55
Find the critical values for a 99% confidence interval using the chi-square distribution with 20 degrees of freedom.
A) 8.260, 37.566
B) 6.844, 38.582
C) 7.434, 39.997
D) 7.633, 36.191
A) 8.260, 37.566
B) 6.844, 38.582
C) 7.434, 39.997
D) 7.633, 36.191
فتح الحزمة
افتح القفل للوصول البطاقات البالغ عددها 62 في هذه المجموعة.
فتح الحزمة
k this deck
56
Construct a 90% confidence interval for the population standard deviation if a sample of size 8 has standard deviation s = 20.
A) (14.11, 35.94)
B) (14.37, 34.22)
C) (15.26, 31.44)
D) (13.44, 32.01)
if a sample of size 8 has standard deviation s = 20.A) (14.11, 35.94)
B) (14.37, 34.22)
C) (15.26, 31.44)
D) (13.44, 32.01)
فتح الحزمة
افتح القفل للوصول البطاقات البالغ عددها 62 في هذه المجموعة.
فتح الحزمة
k this deck
57
In a survey of 331 registered voters, 158 of them wished to see Mayor Waffleskate lose her next election. Find a point estimate for the proportion of registered voters who wish to see Mayor
Waffleskate defeated.
A) 0.4773
B) 158
C) 0.5227
D) 0.02745
Waffleskate defeated.
A) 0.4773
B) 158
C) 0.5227
D) 0.02745
فتح الحزمة
افتح القفل للوصول البطاقات البالغ عددها 62 في هذه المجموعة.
فتح الحزمة
k this deck
58
A researcher wants to construct a 98% confidence interval for the proportion of elementary school students in Seward County who receive free or reduced-price school lunches. What sample size is
Needed so that the confidence interval will have a margin of error of 0.09?
A) 119
B) 167
C) 7
D) 16
Needed so that the confidence interval will have a margin of error of 0.09?
A) 119
B) 167
C) 7
D) 16
فتح الحزمة
افتح القفل للوصول البطاقات البالغ عددها 62 في هذه المجموعة.
فتح الحزمة
k this deck
59
A researcher wants to construct a 98% confidence interval for the proportion of elementary school students in Seward County who receive free or reduced-price school lunches. A state-wide survey
Indicates that the proportion is 0.60. Using this estimate, what sample size is needed so that the
Confidence interval will have a margin of error of 0.07?
A) 265
B) 19
C) 8
D) 189
Indicates that the proportion is 0.60. Using this estimate, what sample size is needed so that the
Confidence interval will have a margin of error of 0.07?
A) 265
B) 19
C) 8
D) 189
فتح الحزمة
افتح القفل للوصول البطاقات البالغ عددها 62 في هذه المجموعة.
فتح الحزمة
k this deck
60
The following display from a TI-84 Plus calculator presents a 99% confidence interval for a proportion. Use the information in the display to construct a 95% confidence interval for p.
A) (0.348, 0.652)
B) (0.285, 0.715)
C) (0.363, 0.637)
D) (0.337, 0.663)
Use the information in the display to construct a 95% confidence interval for p.A) (0.348, 0.652)
B) (0.285, 0.715)
C) (0.363, 0.637)
D) (0.337, 0.663)
فتح الحزمة
افتح القفل للوصول البطاقات البالغ عددها 62 في هذه المجموعة.
فتح الحزمة
k this deck
61
A simple random sample of size 51 has mean . The population distribution is approximately normal, with standard deviation . Determine the correct method of finding
A 95% confidence interval for the population mean and compute it.
A) z-method: (66.15, 75.29)
B) Cannot compute: the population size is too small.
C) t-method: (66.15, 75.29)
D) z-method: (66.26, 75.18)
. The population distribution is approximately normal, with standard deviation . Determine the correct method of findingA 95% confidence interval for the population mean and compute it.
A) z-method: (66.15, 75.29)
B) Cannot compute: the population size is too small.
C) t-method: (66.15, 75.29)
D) z-method: (66.26, 75.18)
فتح الحزمة
افتح القفل للوصول البطاقات البالغ عددها 62 في هذه المجموعة.
فتح الحزمة
k this deck
62
A simple random sample of size 20 has mean and standard deviation s = 16.77. The population distribution is unknown. Determine the correct method of finding a 90% confidence
Interval for the population mean and compute it.
A) Cannot compute: the population size is too small.
B) z-method: (64.72, 77.06)
C) t-method: (64.41, 77.37)
D) z-method: (64.41, 77.37)
and standard deviation s = 16.77. The population distribution is unknown. Determine the correct method of finding a 90% confidenceInterval for the population mean and compute it.
A) Cannot compute: the population size is too small.
B) z-method: (64.72, 77.06)
C) t-method: (64.41, 77.37)
D) z-method: (64.41, 77.37)
فتح الحزمة
افتح القفل للوصول البطاقات البالغ عددها 62 في هذه المجموعة.
فتح الحزمة
k this deck
فتح الحزمة
افتح القفل للوصول البطاقات البالغ عددها 62 في هذه المجموعة.


