Deck 13: Inference in Linear Models
ملء الشاشة (f)
سؤال
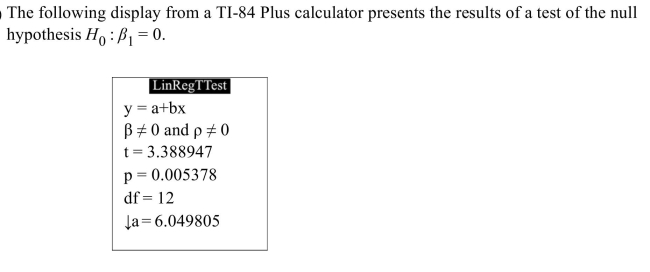
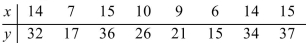
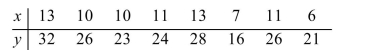
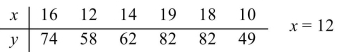
In a study of reaction times, the time to respond to a visual stimulus (x) and the time to respond to an auditory stimulus (y) were recorded for each of 8 subjects. Times were measured in thousandths
Of a second. The results are presented in the following table.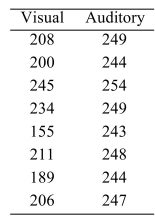
Test H0: =0 versus
  . Use the
  :=0.05 level of significance.
A) Do not reject H0
B) Reject H0
Of a second. The results are presented in the following table.
Test H0:
=0 versus . Use the :=0.05 level of significance.A) Do not reject H0
B) Reject H0
سؤال
In a study of reaction times, the time to respond to a visual stimulus (x) and the time to respond to an auditory stimulus (y) were recorded for each of 8 subjects. Times were measured in thousandths
Of a second. The results are presented in the following table.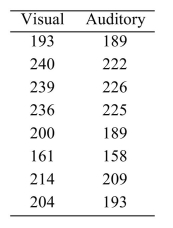 Construct a 95% confidence interval for the slope of the least-squares regression line.
A) (21.1376, 21.3239)
B) (0.7611, 0.9474)
C) (21.1134, 21.3481)
D) (0.7370, 0.9716)
Of a second. The results are presented in the following table.
Construct a 95% confidence interval for the slope of the least-squares regression line.A) (21.1376, 21.3239)
B) (0.7611, 0.9474)
C) (21.1134, 21.3481)
D) (0.7370, 0.9716)
سؤال
A) 1.3235
B) 9.9632
C) 68.0000
D) 1.9043
سؤال
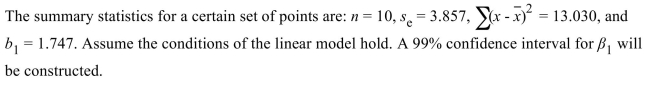
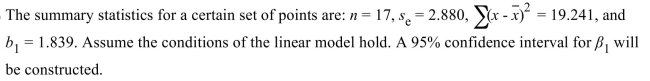
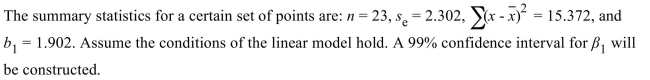
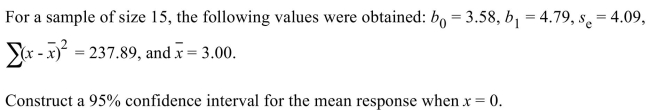
The summary statistics for a certain set of points are: 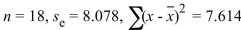
, and Assume the conditions of the linear model hold. A 99% confidence interval for
  will be constructed.
Test the null hypothesis versus https://d2lvgg3v3hfg70.cloudfront.net/TB34225555/
 . Use the
  level of significance.
A) Reject H0
B) Do not reject H0
, and
Assume the conditions of the linear model hold. A 99% confidence interval for will be constructed.Test the null hypothesis
versus https://d2lvgg3v3hfg70.cloudfront.net/TB34225555/. Use the level of significance.A) Reject H0
B) Do not reject H0
سؤال
 What is the value of the test statistic?
A) 0.005378
B) 3.388947
C) 12
D) 6.049805
سؤال
In a study of reaction times, the time to respond to a visual stimulus (x) and the time to respond to an auditory stimulus (y) were recorded for each of 8 subjects. Times were measured in thousandths
Of a second. The results are presented in the following table.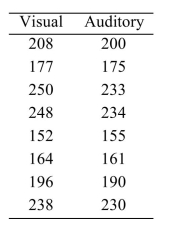 Compute the least-squares regression line for predicting auditory response time (y) from visual response Time (x).
A)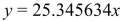
B)
C)
D)
Of a second. The results are presented in the following table.
Compute the least-squares regression line for predicting auditory response time (y) from visual response Time (x). A)
B)
C)
D)
سؤال
Use the given set of points to test the null hypothesis 
level of significance.
A) Reject H0
B) Do not reject H0
level of significance.
A) Reject H0
B) Do not reject H0
سؤال
 What is the critical value?
A) 3.250
B) 2.821
C) 3.355
D) 2.896
سؤال
The summary statistics for a certain set of points are: n=10, se=3.199,  =11.257, and
  =1.704 . Assume the conditions of the linear model hold. A 99% confidence interval for 11ec916b_6e28_0fa2_a226_b17a14146f0a_TB34225555_11 will be constructed.
i). How many degrees of freedom are there for the critical value?
ii). What is the critical value?
iii). What is the margin of error?
iv). Construct the 99% confidence interval.
=11.257, and =1.704 . Assume the conditions of the linear model hold. A 99% confidence interval for 11ec916b_6e28_0fa2_a226_b17a14146f0a_TB34225555_11 will be constructed.i). How many degrees of freedom are there for the critical value?
ii). What is the critical value?
iii). What is the margin of error?
iv). Construct the 99% confidence interval.
سؤال
A) 1.7238
B) 10.1596
C) 1.4149
D) 23.5000
سؤال
Use the given set of points to compute the margin of error for a 95% confidence interval for  .
. 
A) 1.01
B) 0.4127
C) 2.6388
D) 2.0734
. A) 1.01
B) 0.4127
C) 2.6388
D) 2.0734
سؤال
A) 2.1184
B) 0.1216
C) 1.2865
D) 111.8750
سؤال
 What is the margin of error?
A) 41.002571
B) 1.391921
C) 1.146365
D) 1.399143
سؤال
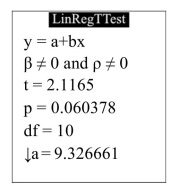
The following display from a TI-84 Plus calculator presents the results of a test of the null hypothesis 
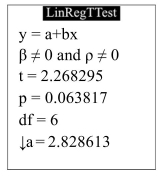 How many degrees of freedom did the calculator use?
A) 4
B) 7
C) 8
D) 6
How many degrees of freedom did the calculator use?A) 4
B) 7
C) 8
D) 6
سؤال
Use the given set of points to construct a 95% confidence interval for https://d2lvgg3v3hfg70.cloudfront.net/TB34225555/ .
.
A)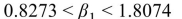
B)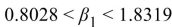
C)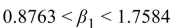
D)
.A)
B)
C)
D)
سؤال
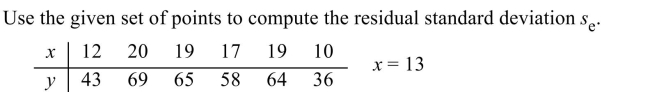
Use the given set of points to compute the residual standard deviation 
A) 7.9164
B) 44.8750
C) 1.6379
D) 2.5696
A) 7.9164
B) 44.8750
C) 1.6379
D) 2.5696
سؤال
In a study of reaction times, the time to respond to a visual stimulus (x) and the time to respond to
an auditory stimulus (y) were recorded for each of 8 subjects. Times were measured in thousandths
of a second. The results are presented in the following table.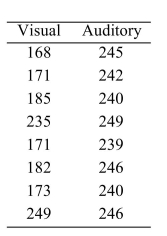 i). Compute the least-squares regression line for predicting auditory response time (y) from visual res time (x).
ii). Construct a 99% confidence interval for the slope of the least-squares regression line.
iii). Test H0: =0 versus https://d2lvgg3v3hfg70.cloudfront.net/TB1209/
 .Use the
 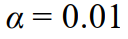 =0.01 level of significance.
an auditory stimulus (y) were recorded for each of 8 subjects. Times were measured in thousandths
of a second. The results are presented in the following table.
i). Compute the least-squares regression line for predicting auditory response time (y) from visual res time (x).ii). Construct a 99% confidence interval for the slope of the least-squares regression line.
iii). Test H0:
=0 versus https://d2lvgg3v3hfg70.cloudfront.net/TB1209/.Use the =0.01 level of significance. سؤال
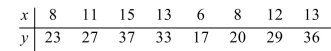
Use the given set of points to
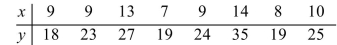
a). Compute b1.
b). Compute the residual standard deviation se.
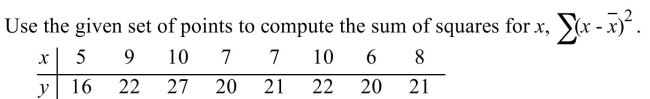
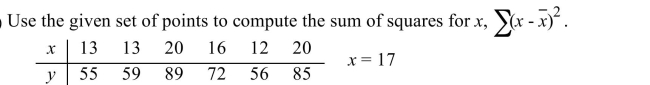
c). Compute the sum of squares for x,
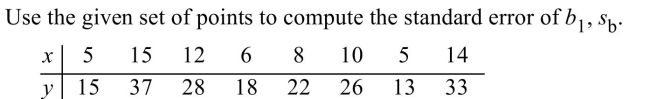
d). Compute the standard error of b1, sb.
e). Find the critical value for a 95% confidence interval for
f). Compute the margin of error for a 95% confidence interval for
g). Construct a 95% confidence interval for
h). Test the null hypothesis versus
  Use the
 =0.05 level of significance.
a). Compute b1.
b). Compute the residual standard deviation se.
c). Compute the sum of squares for x,
d). Compute the standard error of b1, sb.
e). Find the critical value for a 95% confidence interval for
f). Compute the margin of error for a 95% confidence interval for
g). Construct a 95% confidence interval for
h). Test the null hypothesis
versus Use the=0.05 level of significance. سؤال
The summary statistics for a certain set of points are: 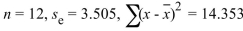 , and
, and  Assume the conditions of the linear model hold. A 95% confidence interval for
  will be constructed.
Construct the 95% confidence interval.
A)
B)
C)
D)
, and Assume the conditions of the linear model hold. A 95% confidence interval for will be constructed.Construct the 95% confidence interval.
A)
B)
C)
D)
سؤال
 How many degrees of freedom are there for the critical value?
A) 22
B) 23
C) 21
D) 24
سؤال
A) (57.40, 63.18)
B) (56.52, 64.05)
C) (58.77, 61.81)
D) (58.31, 62.26)
سؤال
Use the given set of points to
a). Compute and https://d2lvgg3v3hfg70.cloudfront.net/TB34225555/
 .
.
b). Compute the predicted value for the given value of x.
c). Compute the residual standard deviation
d). Compute the sum of squares for
e). Find the critical value for a 95% confidence or prediction interval.
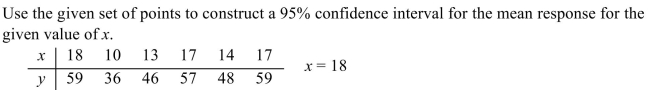
f). Construct a 95% confidence interval for the mean response for the given value of x.
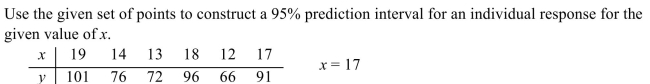
g). Construct a 95% prediction interval for an individual response for the given value of x.
a). Compute
and https://d2lvgg3v3hfg70.cloudfront.net/TB34225555/.b). Compute the predicted value
for the given value of x.c). Compute the residual standard deviation
d). Compute the sum of squares for
e). Find the critical value for a 95% confidence or prediction interval.
f). Construct a 95% confidence interval for the mean response for the given value of x.
g). Construct a 95% prediction interval for an individual response for the given value of x.
سؤال
A) 15.666667
B) 65.333333
C) 2.475389
D) 4.112245
سؤال
A) 3.191939
B) 0.730472
C) 16.166667
D) 4.230326
سؤال
In a study of reaction times, the time to respond to a visual stimulus (x) and the time to respond to
an auditory stimulus (y) were recorded for each of 8 subjects. Times were measured in thousandths of
a second. The results are presented in the following table.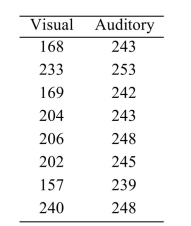 i). Compute a point estimate for the mean auditory response time for subjects with a visual response time of
183.
ii). Construct a 99% confidence interval for the mean auditory response time for subjects with a
visual response time of 183.
iii). Predict the auditory response time for a particular subject whose visual response time of 183.
iv). Construct a 99% prediction interval for the auditory response time for a particular subject whose
visual response time is 183.
an auditory stimulus (y) were recorded for each of 8 subjects. Times were measured in thousandths of
a second. The results are presented in the following table.
i). Compute a point estimate for the mean auditory response time for subjects with a visual response time of183.
ii). Construct a 99% confidence interval for the mean auditory response time for subjects with a
visual response time of 183.
iii). Predict the auditory response time for a particular subject whose visual response time of 183.
iv). Construct a 99% prediction interval for the auditory response time for a particular subject whose
visual response time is 183.
سؤال
The following display from a TI-84 Plus calculator presents the results of a test of the null hypothesis 
Can you conclude that the explanatory variable is useful in predicting the outcome variable? Answer this question using the level of significance.
A) No
B) Yes
Can you conclude that the explanatory variable is useful in predicting the outcome variable? Answer this question using the
level of significance.A) No
B) Yes
سؤال
In a study of reaction times, the time to respond to a visual stimulus (x) and the time to respond to an auditory stimulus (y) were recorded for each of 8 subjects. Times were measured in thousandths of
A second. The results are presented in the following table.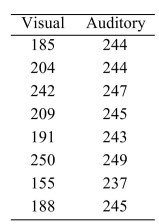 Compute a point estimate for the mean auditory response time for subjects with a visual response time of .
A) 249.98
B) 247.11
C) 244.25
D) 244.24
A second. The results are presented in the following table.
Compute a point estimate for the mean auditory response time for subjects with a visual response time of .A) 249.98
B) 247.11
C) 244.25
D) 244.24
سؤال
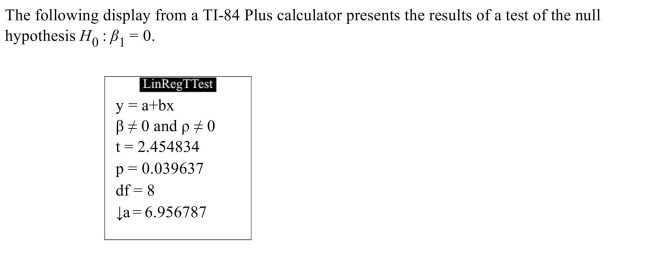 What is the P-value?
A) 2.454834
B) 6.956787
C) 8
D) 0.039637
سؤال
In a study of reaction times, the time to respond to a visual stimulus (x) and the time to respond to an auditory stimulus (y) were recorded for each of 8 subjects. Times were measured in thousandths of
A second. The results are presented in the following table.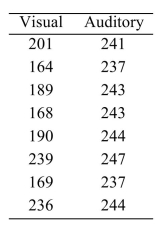 Construct a 99% confidence interval for the mean auditory response time for subjects with a visual
Response time of 171.
A) (231.15, 248.69)
B) (235.56, 244.28)
C) (236.23, 243.61)
D) (229.58, 250.26)
A second. The results are presented in the following table.
Construct a 99% confidence interval for the mean auditory response time for subjects with a visualResponse time of 171.
A) (231.15, 248.69)
B) (235.56, 244.28)
C) (236.23, 243.61)
D) (229.58, 250.26)
سؤال
In a study of reaction times, the time to respond to a visual stimulus (x) and the time to respond to an auditory stimulus (y) were recorded for each of 6 subjects. Times were measured in thousandths of
A second. The results are presented in the following table.
The following MINITAB output describes the fit of a linear model to these data. Assume that the assumptions
Of the linear model are satisfied.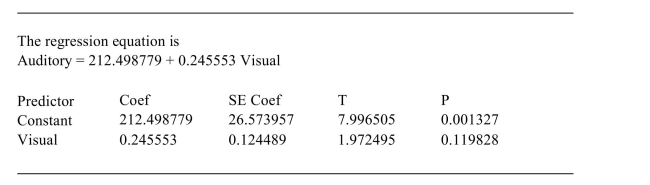 Can you conclude that the response time to visual stimulus is useful in predicting the response time for
Auditory stimulus? Answer this question using the α = 0.05 level of significance.
A) Yes
B) No
A second. The results are presented in the following table.
The following MINITAB output describes the fit of a linear model to these data. Assume that the assumptions
Of the linear model are satisfied.
Can you conclude that the response time to visual stimulus is useful in predicting the response time forAuditory stimulus? Answer this question using the α = 0.05 level of significance.
A) Yes
B) No
سؤال
The following MINITAB output presents a 95% confidence interval for the mean ozone level on days when the relative humidity is 55%, and a 95% prediction interval for the ozone level on a
Particular day when the relative humidity is 55%. The units of ozone are parts per billion.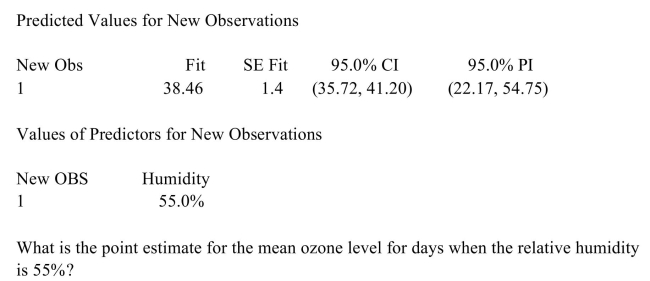
A) 55.0
B) 1.4
C) 38.46
D) 35.72
Particular day when the relative humidity is 55%. The units of ozone are parts per billion.
A) 55.0
B) 1.4
C) 38.46
D) 35.72
سؤال
Use the given set of points to compute b0 and b1.
A) b0=0 ; b1=3.860274
B) b0=10.572603 ; b1=3.860274
C) b0=3.860274 ; b1=10.572603
D) b0=14.833333 ; b1=10.572603
A) b0=0 ; b1=3.860274
B) b0=10.572603 ; b1=3.860274
C) b0=3.860274 ; b1=10.572603
D) b0=14.833333 ; b1=10.572603
سؤال
In a study of reaction times, the time to respond to a visual stimulus (x) and the time to respond to an auditory stimulus (y) were recorded for each of 8 subjects. Times were measured in thousandths of
A second. The results are presented in the following table.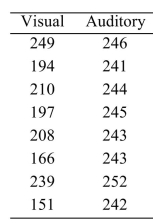 Construct a 95% prediction interval for the auditory response time for a particular subject whose
Visual response time is 182.
A) (235.94, 250.26)
B) (240.33, 245.87)
C) (240.9, 245.3)
D) (237.42, 248.78)
A second. The results are presented in the following table.
Construct a 95% prediction interval for the auditory response time for a particular subject whoseVisual response time is 182.
A) (235.94, 250.26)
B) (240.33, 245.87)
C) (240.9, 245.3)
D) (237.42, 248.78)
سؤال
In a study of reaction times, the time to respond to a visual stimulus (x) and the time to respond to an auditory stimulus (y) were recorded for each of 8 subjects. Times were measured in thousandths of
A second. The results are presented in the following table.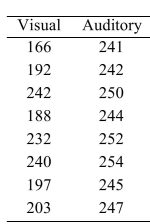 Predict the auditory response time for a particular subject whose visual response time of 178.
A) 238.66
B) 242.11
C) 246.88
D) 245.56
A second. The results are presented in the following table.
Predict the auditory response time for a particular subject whose visual response time of 178.A) 238.66
B) 242.11
C) 246.88
D) 245.56
سؤال
In a study of reaction times, the time to respond to a visual stimulus (x) and the time to respond to an auditory stimulus (y) were recorded for each of 6 subjects. Times were measured in thousandths of
A second. The results are presented in the following table.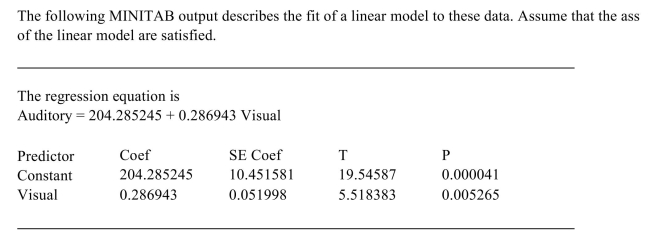 What is the intercept of the least-squares regression line?
A) 0.286943
B) 19.54587
C) 0.051998
D) 204.285245
A second. The results are presented in the following table.
What is the intercept of the least-squares regression line?A) 0.286943
B) 19.54587
C) 0.051998
D) 204.285245
سؤال
In a study of reaction times, the time to respond to a visual stimulus (x) and the time to respond to an auditory stimulus (y) were recorded for each of 6 subjects. Times were measured in thousandths of
A second. The results are presented in the following table.
The following MINITAB output describes the fit of a linear model to these data. Assume that the assumptions
Of the linear model are satisfied.
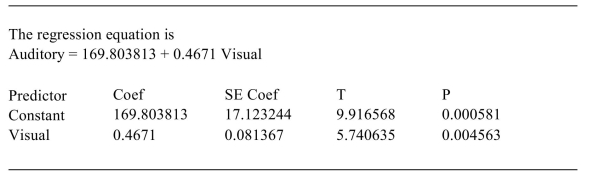
What is the slope of the least-squares regression line?
A) 0.4671
B) 0.081367
C) 9.916568
D) 169.803813
A second. The results are presented in the following table.
The following MINITAB output describes the fit of a linear model to these data. Assume that the assumptions
Of the linear model are satisfied.
What is the slope of the least-squares regression line?
A) 0.4671
B) 0.081367
C) 9.916568
D) 169.803813
سؤال
A) (90.66, 91.49)
B) (90.54, 91.62)
C) (90.10, 92.05)
D) (89.81, 92.34)
سؤال
A) (0.59, 6.57)
B) (1.24, 5.92)
C) (0.72, 6.44)
D) (0, 5.92)
سؤال
Use the given set of points to compute the predicted value  for the given value of x.
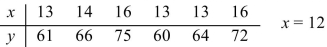
A) 47.2615
B) 57.8
C) 130.4
D) 126.4615
for the given value of x.A) 47.2615
B) 57.8
C) 130.4
D) 126.4615
سؤال
The following MINITAB output presents a 95% confidence interval for the mean ozone level on days when the relative humidity is 40%, and a 95% prediction interval for the ozone level on a
Particular day when the relative humidity is 40%. The units of ozone are parts per billion.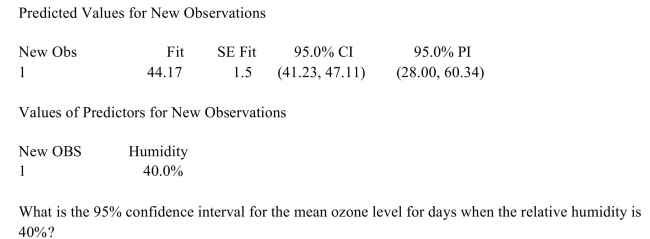
A) (41.23, 47.11)
B) (28.00, 60.34)
C) (40, 95)
D) (1.5, 44.17)
Particular day when the relative humidity is 40%. The units of ozone are parts per billion.
A) (41.23, 47.11)
B) (28.00, 60.34)
C) (40, 95)
D) (1.5, 44.17)
سؤال
The following MINITAB output presents a confidence interval for a mean response and a prediction
interval for an individual response.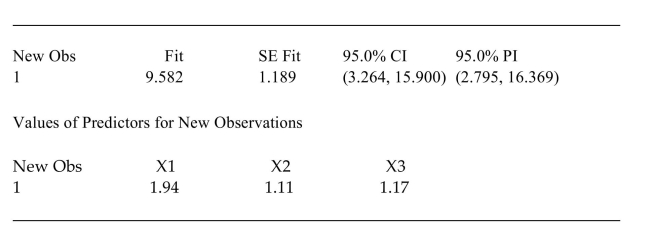 What is the 95% confidence interval for the mean response?
interval for an individual response.
What is the 95% confidence interval for the mean response? سؤال
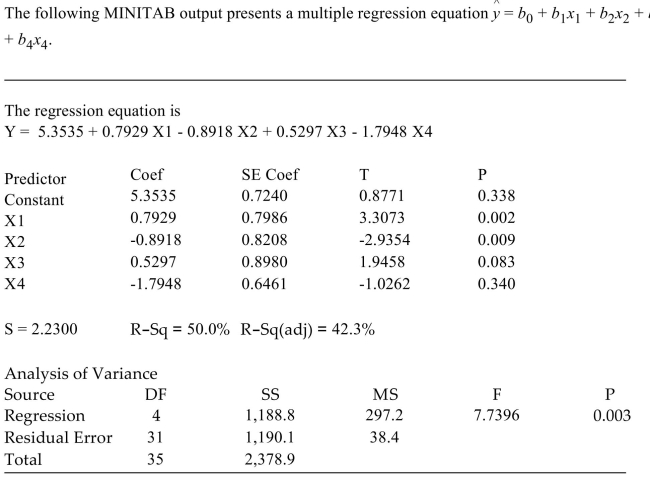
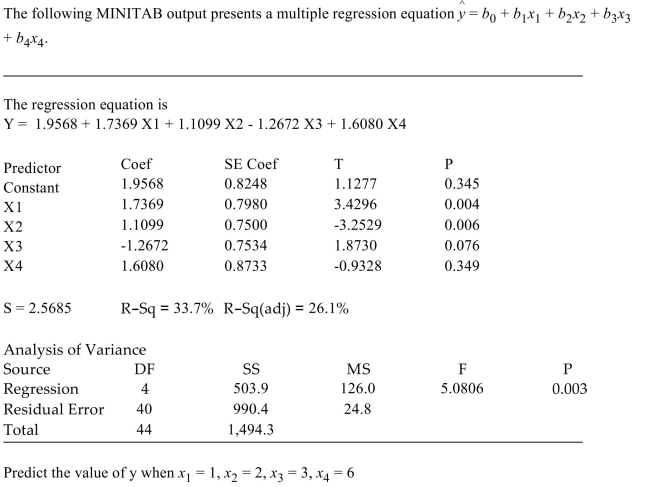
The following MINITAB output presents a multiple regression equatior  =b0+b1x1+b2x2+b3x3+b4x4
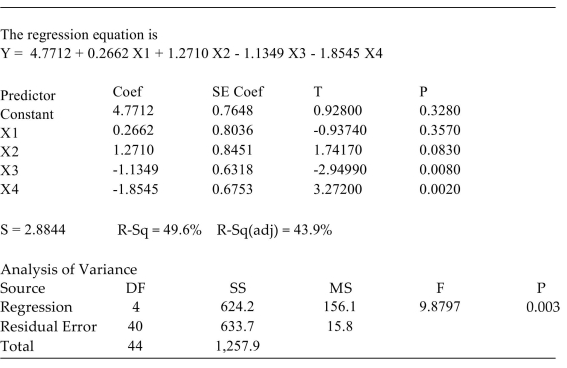
It is desired to drop one of the explanatory variables. Which of the following is the most appropriate action?
A) Drop x4, then see whether R2 increases
B) Drop x1, then see whether R2 increases
C) Drop x4, then see whether adjusted R2 increases
D) Drop x1, then see whether adjusted R2 increases
=b0+b1x1+b2x2+b3x3+b4x4It is desired to drop one of the explanatory variables. Which of the following is the most appropriate action?
A) Drop x4, then see whether R2 increases
B) Drop x1, then see whether R2 increases
C) Drop x4, then see whether adjusted R2 increases
D) Drop x1, then see whether adjusted R2 increases
سؤال
Construct the multiple regression sequence  =b0+b1x1+b2x2+b3x3 for the following data set:
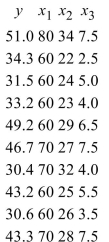
A) 11ecb400_8919_50a3_8ce8_fd19d1580fc5_TB1209_11=3.8708+0.2200 x1-0.1503 x2+22.4605 x3
B) 11ecb400_8919_50a3_8ce8_fd19d1580fc5_TB1209_11=3.5766+0.1982 x1-0.1453 x2+22.0113 x3
C) 11ecb400_8919_50a3_8ce8_fd19d1580fc5_TB1209_11=22.0113-0.1453 x1+0.1982 x2+3.5766 x3
D) 11ecb400_8919_50a3_8ce8_fd19d1580fc5_TB1209_11=22.4605-0.1503 x1+0.2200 x2+3.8708 x3
=b0+b1x1+b2x2+b3x3 for the following data set: A) 11ecb400_8919_50a3_8ce8_fd19d1580fc5_TB1209_11=3.8708+0.2200 x1-0.1503 x2+22.4605 x3
B) 11ecb400_8919_50a3_8ce8_fd19d1580fc5_TB1209_11=3.5766+0.1982 x1-0.1453 x2+22.0113 x3
C) 11ecb400_8919_50a3_8ce8_fd19d1580fc5_TB1209_11=22.0113-0.1453 x1+0.1982 x2+3.5766 x3
D) 11ecb400_8919_50a3_8ce8_fd19d1580fc5_TB1209_11=22.4605-0.1503 x1+0.2200 x2+3.8708 x3
سؤال
The following table lists values measured for 10 consecutive eruptions of the geyser Old Faithful in Yellowstone National Park. They are the duration, in minutes, of the eruption  , the dormant
Period before the eruption , and the dormant period after the eruption (y).
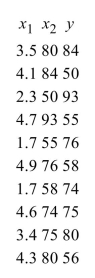
Construct the multiple regression equation =b0+b1x1+b2x2
A) 11ecb400_b9ed_77b4_8ce8_434575de6d27_TB1209_11=122.22-1.85 x1-0.62 x2
B) 11ecb400_b9ed_77b4_8ce8_434575de6d27_TB1209_11=118.78-1.7675 x1-0.5856 x2
C) 11ecb400_b9ed_77b4_8ce8_434575de6d27_TB1209_11=-0.62-1.85 x1+122.22 x2
D) 11ecb400_b9ed_77b4_8ce8_434575de6d27_TB1209_11=-0.5856-1.7675 x1+118.78 x2
, the dormantPeriod before the eruption
, and the dormant period after the eruption (y). Construct the multiple regression equation
=b0+b1x1+b2x2A) 11ecb400_b9ed_77b4_8ce8_434575de6d27_TB1209_11=122.22-1.85 x1-0.62 x2
B) 11ecb400_b9ed_77b4_8ce8_434575de6d27_TB1209_11=118.78-1.7675 x1-0.5856 x2
C) 11ecb400_b9ed_77b4_8ce8_434575de6d27_TB1209_11=-0.62-1.85 x1+122.22 x2
D) 11ecb400_b9ed_77b4_8ce8_434575de6d27_TB1209_11=-0.5856-1.7675 x1+118.78 x2
سؤال
 b3x3 What percentage of the variation in y is explained by the model?
A) 50.0%
B) 42.3%
C) 0.3%
D) 7.7396%
سؤال
 Is the model useful for prediction? Use the = 0.05 level.
A) Yes
B) No
سؤال
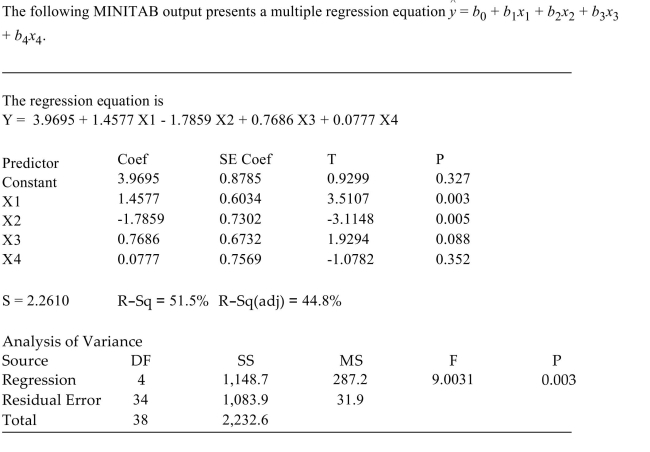
The following MINITAB output presents a multiple regression equatior  =b0+b1x1+b2x2+b3x3+b4x4
Let be the coefficient
  Test the hypothesis
  versus
 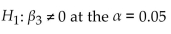 level. What do you conclude?
A) Reject H0
B) Do not reject H0
=b0+b1x1+b2x2+b3x3+b4x4Let
be the coefficient Test the hypothesis versus level. What do you conclude?A) Reject H0
B) Do not reject H0
سؤال
A) 9.798
B) 9.8031
C) 10.6228
D) 11.7599
سؤال
The following MINITAB output presents a confidence interval for a mean response and a prediction
interval for an individual response.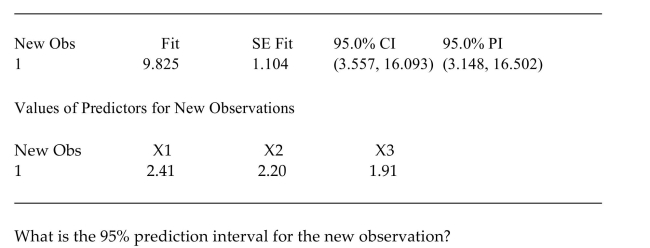
interval for an individual response.
سؤال
The following MINITAB output presents a 95% confidence interval for the mean ozone level on days when the relative humidity is 40%, and a 95% prediction interval for the ozone level on a
Particular day when the relative humidity is 40%. The units of ozone are parts per billion.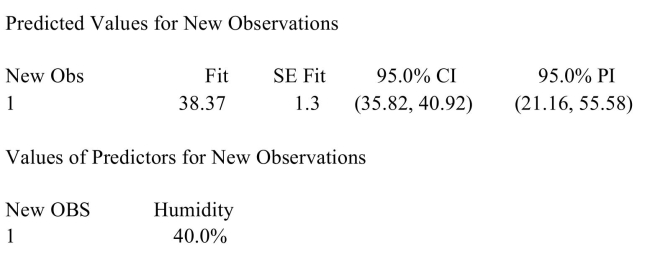 Predict the ozone level for a day when the relative humidity is 40%.
A) 35.82
B) 40.0
C) 1.3
D) 38.37
Particular day when the relative humidity is 40%. The units of ozone are parts per billion.
Predict the ozone level for a day when the relative humidity is 40%.A) 35.82
B) 40.0
C) 1.3
D) 38.37
سؤال
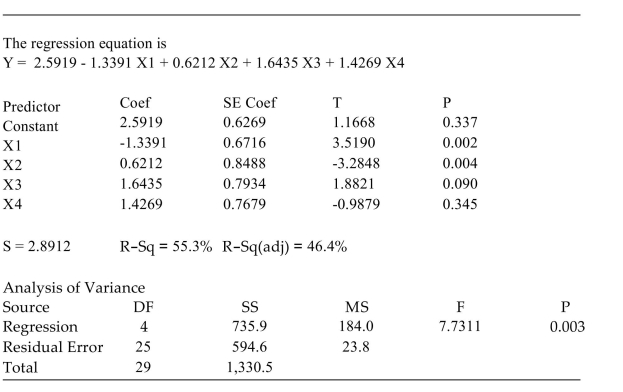
The following MINITAB output presents a multiple regression equatior  =b0+b1x1+b2x2+b3x3+b4x4
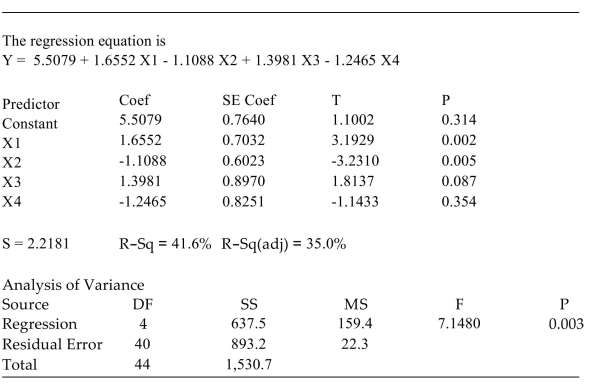
Let be the coefficient
  Test the hypothesis
  rersus
level. What do you conclude?
A) Do not H0
B) Reject H0
=b0+b1x1+b2x2+b3x3+b4x4Let
be the coefficient Test the hypothesis rersus level. What do you conclude?
A) Do not H0
B) Reject H0

فتح الحزمة
قم بالتسجيل لفتح البطاقات في هذه المجموعة!
Unlock Deck
Unlock Deck
1/51
العب
ملء الشاشة (f)
Deck 13: Inference in Linear Models
1
In a study of reaction times, the time to respond to a visual stimulus (x) and the time to respond to an auditory stimulus (y) were recorded for each of 8 subjects. Times were measured in thousandths
Of a second. The results are presented in the following table.
Test H0:=0 versus . Use the :=0.05 level of significance.
A) Do not reject H0
B) Reject H0
Of a second. The results are presented in the following table.
Test H0:
=0 versus . Use the :=0.05 level of significance.A) Do not reject H0
B) Reject H0
Reject H0
2
In a study of reaction times, the time to respond to a visual stimulus (x) and the time to respond to an auditory stimulus (y) were recorded for each of 8 subjects. Times were measured in thousandths
Of a second. The results are presented in the following table. Construct a 95% confidence interval for the slope of the least-squares regression line.
A) (21.1376, 21.3239)
B) (0.7611, 0.9474)
C) (21.1134, 21.3481)
D) (0.7370, 0.9716)
Of a second. The results are presented in the following table.
Construct a 95% confidence interval for the slope of the least-squares regression line.A) (21.1376, 21.3239)
B) (0.7611, 0.9474)
C) (21.1134, 21.3481)
D) (0.7370, 0.9716)
(0.7370, 0.9716)
3
A) 1.3235
B) 9.9632
C) 68.0000
D) 1.9043
1.3235
4
The summary statistics for a certain set of points are:
, and Assume the conditions of the linear model hold. A 99% confidence interval for will be constructed.
Test the null hypothesis versus https://d2lvgg3v3hfg70.cloudfront.net/TB34225555/. Use the level of significance.
A) Reject H0
B) Do not reject H0
, and
Assume the conditions of the linear model hold. A 99% confidence interval for will be constructed.Test the null hypothesis
versus https://d2lvgg3v3hfg70.cloudfront.net/TB34225555/. Use the level of significance.A) Reject H0
B) Do not reject H0
فتح الحزمة
افتح القفل للوصول البطاقات البالغ عددها 51 في هذه المجموعة.
فتح الحزمة
k this deck
5
What is the value of the test statistic?A) 0.005378
B) 3.388947
C) 12
D) 6.049805
فتح الحزمة
افتح القفل للوصول البطاقات البالغ عددها 51 في هذه المجموعة.
فتح الحزمة
k this deck
6
In a study of reaction times, the time to respond to a visual stimulus (x) and the time to respond to an auditory stimulus (y) were recorded for each of 8 subjects. Times were measured in thousandths
Of a second. The results are presented in the following table. Compute the least-squares regression line for predicting auditory response time (y) from visual response Time (x).
A)
B)
C)
D)
Of a second. The results are presented in the following table.
Compute the least-squares regression line for predicting auditory response time (y) from visual response Time (x). A)
B)
C)
D)
فتح الحزمة
افتح القفل للوصول البطاقات البالغ عددها 51 في هذه المجموعة.
فتح الحزمة
k this deck
7
Use the given set of points to test the null hypothesis
level of significance.
A) Reject H0
B) Do not reject H0
level of significance.
A) Reject H0
B) Do not reject H0
فتح الحزمة
افتح القفل للوصول البطاقات البالغ عددها 51 في هذه المجموعة.
فتح الحزمة
k this deck
8
What is the critical value?A) 3.250
B) 2.821
C) 3.355
D) 2.896
فتح الحزمة
افتح القفل للوصول البطاقات البالغ عددها 51 في هذه المجموعة.
فتح الحزمة
k this deck
9
The summary statistics for a certain set of points are: n=10, se=3.199, =11.257, and =1.704 . Assume the conditions of the linear model hold. A 99% confidence interval for 11ec916b_6e28_0fa2_a226_b17a14146f0a_TB34225555_11 will be constructed.
i). How many degrees of freedom are there for the critical value?
ii). What is the critical value?
iii). What is the margin of error?
iv). Construct the 99% confidence interval.
=11.257, and =1.704 . Assume the conditions of the linear model hold. A 99% confidence interval for 11ec916b_6e28_0fa2_a226_b17a14146f0a_TB34225555_11 will be constructed.i). How many degrees of freedom are there for the critical value?
ii). What is the critical value?
iii). What is the margin of error?
iv). Construct the 99% confidence interval.
فتح الحزمة
افتح القفل للوصول البطاقات البالغ عددها 51 في هذه المجموعة.
فتح الحزمة
k this deck
10
A) 1.7238
B) 10.1596
C) 1.4149
D) 23.5000
فتح الحزمة
افتح القفل للوصول البطاقات البالغ عددها 51 في هذه المجموعة.
فتح الحزمة
k this deck
11
Use the given set of points to compute the margin of error for a 95% confidence interval for .
A) 1.01
B) 0.4127
C) 2.6388
D) 2.0734
. A) 1.01
B) 0.4127
C) 2.6388
D) 2.0734
فتح الحزمة
افتح القفل للوصول البطاقات البالغ عددها 51 في هذه المجموعة.
فتح الحزمة
k this deck
12
A) 2.1184
B) 0.1216
C) 1.2865
D) 111.8750
فتح الحزمة
افتح القفل للوصول البطاقات البالغ عددها 51 في هذه المجموعة.
فتح الحزمة
k this deck
13
What is the margin of error?A) 41.002571
B) 1.391921
C) 1.146365
D) 1.399143
فتح الحزمة
افتح القفل للوصول البطاقات البالغ عددها 51 في هذه المجموعة.
فتح الحزمة
k this deck
14
The following display from a TI-84 Plus calculator presents the results of a test of the null hypothesis How many degrees of freedom did the calculator use?
A) 4
B) 7
C) 8
D) 6
How many degrees of freedom did the calculator use?A) 4
B) 7
C) 8
D) 6
فتح الحزمة
افتح القفل للوصول البطاقات البالغ عددها 51 في هذه المجموعة.
فتح الحزمة
k this deck
15
Use the given set of points to construct a 95% confidence interval for https://d2lvgg3v3hfg70.cloudfront.net/TB34225555/.
A)
B)
C)
D)
.A)
B)
C)
D)
فتح الحزمة
افتح القفل للوصول البطاقات البالغ عددها 51 في هذه المجموعة.
فتح الحزمة
k this deck
16
Use the given set of points to compute the residual standard deviation
A) 7.9164
B) 44.8750
C) 1.6379
D) 2.5696
A) 7.9164
B) 44.8750
C) 1.6379
D) 2.5696
فتح الحزمة
افتح القفل للوصول البطاقات البالغ عددها 51 في هذه المجموعة.
فتح الحزمة
k this deck
17
In a study of reaction times, the time to respond to a visual stimulus (x) and the time to respond to
an auditory stimulus (y) were recorded for each of 8 subjects. Times were measured in thousandths
of a second. The results are presented in the following table. i). Compute the least-squares regression line for predicting auditory response time (y) from visual res time (x).
ii). Construct a 99% confidence interval for the slope of the least-squares regression line.
iii). Test H0:=0 versus https://d2lvgg3v3hfg70.cloudfront.net/TB1209/.Use the =0.01 level of significance.
an auditory stimulus (y) were recorded for each of 8 subjects. Times were measured in thousandths
of a second. The results are presented in the following table.
i). Compute the least-squares regression line for predicting auditory response time (y) from visual res time (x).ii). Construct a 99% confidence interval for the slope of the least-squares regression line.
iii). Test H0:
=0 versus https://d2lvgg3v3hfg70.cloudfront.net/TB1209/.Use the =0.01 level of significance. فتح الحزمة
افتح القفل للوصول البطاقات البالغ عددها 51 في هذه المجموعة.
فتح الحزمة
k this deck
18
Use the given set of points to
a). Compute b1.
b). Compute the residual standard deviation se.
c). Compute the sum of squares for x,
d). Compute the standard error of b1, sb.
e). Find the critical value for a 95% confidence interval for
f). Compute the margin of error for a 95% confidence interval for
g). Construct a 95% confidence interval for
h). Test the null hypothesis versus Use the=0.05 level of significance.
a). Compute b1.
b). Compute the residual standard deviation se.
c). Compute the sum of squares for x,
d). Compute the standard error of b1, sb.
e). Find the critical value for a 95% confidence interval for
f). Compute the margin of error for a 95% confidence interval for
g). Construct a 95% confidence interval for
h). Test the null hypothesis
versus Use the=0.05 level of significance. فتح الحزمة
افتح القفل للوصول البطاقات البالغ عددها 51 في هذه المجموعة.
فتح الحزمة
k this deck
19
The summary statistics for a certain set of points are: , and Assume the conditions of the linear model hold. A 95% confidence interval for will be constructed.
Construct the 95% confidence interval.
A)
B)
C)
D)
, and Assume the conditions of the linear model hold. A 95% confidence interval for will be constructed.Construct the 95% confidence interval.
A)
B)
C)
D)
فتح الحزمة
افتح القفل للوصول البطاقات البالغ عددها 51 في هذه المجموعة.
فتح الحزمة
k this deck
20
How many degrees of freedom are there for the critical value?A) 22
B) 23
C) 21
D) 24
فتح الحزمة
افتح القفل للوصول البطاقات البالغ عددها 51 في هذه المجموعة.
فتح الحزمة
k this deck
21
A) (57.40, 63.18)
B) (56.52, 64.05)
C) (58.77, 61.81)
D) (58.31, 62.26)
فتح الحزمة
افتح القفل للوصول البطاقات البالغ عددها 51 في هذه المجموعة.
فتح الحزمة
k this deck
22
Use the given set of points to
a). Compute and https://d2lvgg3v3hfg70.cloudfront.net/TB34225555/.
b). Compute the predicted value for the given value of x.
c). Compute the residual standard deviation
d). Compute the sum of squares for
e). Find the critical value for a 95% confidence or prediction interval.
f). Construct a 95% confidence interval for the mean response for the given value of x.
g). Construct a 95% prediction interval for an individual response for the given value of x.
a). Compute
and https://d2lvgg3v3hfg70.cloudfront.net/TB34225555/.b). Compute the predicted value
for the given value of x.c). Compute the residual standard deviation
d). Compute the sum of squares for
e). Find the critical value for a 95% confidence or prediction interval.
f). Construct a 95% confidence interval for the mean response for the given value of x.
g). Construct a 95% prediction interval for an individual response for the given value of x.
فتح الحزمة
افتح القفل للوصول البطاقات البالغ عددها 51 في هذه المجموعة.
فتح الحزمة
k this deck
23
A) 15.666667
B) 65.333333
C) 2.475389
D) 4.112245
فتح الحزمة
افتح القفل للوصول البطاقات البالغ عددها 51 في هذه المجموعة.
فتح الحزمة
k this deck
24
A) 3.191939
B) 0.730472
C) 16.166667
D) 4.230326
فتح الحزمة
افتح القفل للوصول البطاقات البالغ عددها 51 في هذه المجموعة.
فتح الحزمة
k this deck
25
In a study of reaction times, the time to respond to a visual stimulus (x) and the time to respond to
an auditory stimulus (y) were recorded for each of 8 subjects. Times were measured in thousandths of
a second. The results are presented in the following table. i). Compute a point estimate for the mean auditory response time for subjects with a visual response time of
183.
ii). Construct a 99% confidence interval for the mean auditory response time for subjects with a
visual response time of 183.
iii). Predict the auditory response time for a particular subject whose visual response time of 183.
iv). Construct a 99% prediction interval for the auditory response time for a particular subject whose
visual response time is 183.
an auditory stimulus (y) were recorded for each of 8 subjects. Times were measured in thousandths of
a second. The results are presented in the following table.
i). Compute a point estimate for the mean auditory response time for subjects with a visual response time of183.
ii). Construct a 99% confidence interval for the mean auditory response time for subjects with a
visual response time of 183.
iii). Predict the auditory response time for a particular subject whose visual response time of 183.
iv). Construct a 99% prediction interval for the auditory response time for a particular subject whose
visual response time is 183.
فتح الحزمة
افتح القفل للوصول البطاقات البالغ عددها 51 في هذه المجموعة.
فتح الحزمة
k this deck
26
The following display from a TI-84 Plus calculator presents the results of a test of the null hypothesis
Can you conclude that the explanatory variable is useful in predicting the outcome variable? Answer this question using the level of significance.
A) No
B) Yes
Can you conclude that the explanatory variable is useful in predicting the outcome variable? Answer this question using the
level of significance.A) No
B) Yes
فتح الحزمة
افتح القفل للوصول البطاقات البالغ عددها 51 في هذه المجموعة.
فتح الحزمة
k this deck
27
In a study of reaction times, the time to respond to a visual stimulus (x) and the time to respond to an auditory stimulus (y) were recorded for each of 8 subjects. Times were measured in thousandths of
A second. The results are presented in the following table. Compute a point estimate for the mean auditory response time for subjects with a visual response time of .
A) 249.98
B) 247.11
C) 244.25
D) 244.24
A second. The results are presented in the following table.
Compute a point estimate for the mean auditory response time for subjects with a visual response time of .A) 249.98
B) 247.11
C) 244.25
D) 244.24
فتح الحزمة
افتح القفل للوصول البطاقات البالغ عددها 51 في هذه المجموعة.
فتح الحزمة
k this deck
28
What is the P-value?A) 2.454834
B) 6.956787
C) 8
D) 0.039637
فتح الحزمة
افتح القفل للوصول البطاقات البالغ عددها 51 في هذه المجموعة.
فتح الحزمة
k this deck
29
In a study of reaction times, the time to respond to a visual stimulus (x) and the time to respond to an auditory stimulus (y) were recorded for each of 8 subjects. Times were measured in thousandths of
A second. The results are presented in the following table. Construct a 99% confidence interval for the mean auditory response time for subjects with a visual
Response time of 171.
A) (231.15, 248.69)
B) (235.56, 244.28)
C) (236.23, 243.61)
D) (229.58, 250.26)
A second. The results are presented in the following table.
Construct a 99% confidence interval for the mean auditory response time for subjects with a visualResponse time of 171.
A) (231.15, 248.69)
B) (235.56, 244.28)
C) (236.23, 243.61)
D) (229.58, 250.26)
فتح الحزمة
افتح القفل للوصول البطاقات البالغ عددها 51 في هذه المجموعة.
فتح الحزمة
k this deck
30
In a study of reaction times, the time to respond to a visual stimulus (x) and the time to respond to an auditory stimulus (y) were recorded for each of 6 subjects. Times were measured in thousandths of
A second. The results are presented in the following table.
The following MINITAB output describes the fit of a linear model to these data. Assume that the assumptions
Of the linear model are satisfied. Can you conclude that the response time to visual stimulus is useful in predicting the response time for
Auditory stimulus? Answer this question using the α = 0.05 level of significance.
A) Yes
B) No
A second. The results are presented in the following table.
The following MINITAB output describes the fit of a linear model to these data. Assume that the assumptions
Of the linear model are satisfied.
Can you conclude that the response time to visual stimulus is useful in predicting the response time forAuditory stimulus? Answer this question using the α = 0.05 level of significance.
A) Yes
B) No
فتح الحزمة
افتح القفل للوصول البطاقات البالغ عددها 51 في هذه المجموعة.
فتح الحزمة
k this deck
31
The following MINITAB output presents a 95% confidence interval for the mean ozone level on days when the relative humidity is 55%, and a 95% prediction interval for the ozone level on a
Particular day when the relative humidity is 55%. The units of ozone are parts per billion.
A) 55.0
B) 1.4
C) 38.46
D) 35.72
Particular day when the relative humidity is 55%. The units of ozone are parts per billion.
A) 55.0
B) 1.4
C) 38.46
D) 35.72
فتح الحزمة
افتح القفل للوصول البطاقات البالغ عددها 51 في هذه المجموعة.
فتح الحزمة
k this deck
32
Use the given set of points to compute b0 and b1.
A) b0=0 ; b1=3.860274
B) b0=10.572603 ; b1=3.860274
C) b0=3.860274 ; b1=10.572603
D) b0=14.833333 ; b1=10.572603
A) b0=0 ; b1=3.860274
B) b0=10.572603 ; b1=3.860274
C) b0=3.860274 ; b1=10.572603
D) b0=14.833333 ; b1=10.572603
فتح الحزمة
افتح القفل للوصول البطاقات البالغ عددها 51 في هذه المجموعة.
فتح الحزمة
k this deck
33
In a study of reaction times, the time to respond to a visual stimulus (x) and the time to respond to an auditory stimulus (y) were recorded for each of 8 subjects. Times were measured in thousandths of
A second. The results are presented in the following table. Construct a 95% prediction interval for the auditory response time for a particular subject whose
Visual response time is 182.
A) (235.94, 250.26)
B) (240.33, 245.87)
C) (240.9, 245.3)
D) (237.42, 248.78)
A second. The results are presented in the following table.
Construct a 95% prediction interval for the auditory response time for a particular subject whoseVisual response time is 182.
A) (235.94, 250.26)
B) (240.33, 245.87)
C) (240.9, 245.3)
D) (237.42, 248.78)
فتح الحزمة
افتح القفل للوصول البطاقات البالغ عددها 51 في هذه المجموعة.
فتح الحزمة
k this deck
34
In a study of reaction times, the time to respond to a visual stimulus (x) and the time to respond to an auditory stimulus (y) were recorded for each of 8 subjects. Times were measured in thousandths of
A second. The results are presented in the following table. Predict the auditory response time for a particular subject whose visual response time of 178.
A) 238.66
B) 242.11
C) 246.88
D) 245.56
A second. The results are presented in the following table.
Predict the auditory response time for a particular subject whose visual response time of 178.A) 238.66
B) 242.11
C) 246.88
D) 245.56
فتح الحزمة
افتح القفل للوصول البطاقات البالغ عددها 51 في هذه المجموعة.
فتح الحزمة
k this deck
35
In a study of reaction times, the time to respond to a visual stimulus (x) and the time to respond to an auditory stimulus (y) were recorded for each of 6 subjects. Times were measured in thousandths of
A second. The results are presented in the following table. What is the intercept of the least-squares regression line?
A) 0.286943
B) 19.54587
C) 0.051998
D) 204.285245
A second. The results are presented in the following table.
What is the intercept of the least-squares regression line?A) 0.286943
B) 19.54587
C) 0.051998
D) 204.285245
فتح الحزمة
افتح القفل للوصول البطاقات البالغ عددها 51 في هذه المجموعة.
فتح الحزمة
k this deck
36
In a study of reaction times, the time to respond to a visual stimulus (x) and the time to respond to an auditory stimulus (y) were recorded for each of 6 subjects. Times were measured in thousandths of
A second. The results are presented in the following table.
The following MINITAB output describes the fit of a linear model to these data. Assume that the assumptions
Of the linear model are satisfied.
What is the slope of the least-squares regression line?
A) 0.4671
B) 0.081367
C) 9.916568
D) 169.803813
فتح الحزمة
افتح القفل للوصول البطاقات البالغ عددها 51 في هذه المجموعة.
فتح الحزمة
k this deck
37
A) (90.66, 91.49)
B) (90.54, 91.62)
C) (90.10, 92.05)
D) (89.81, 92.34)
فتح الحزمة
افتح القفل للوصول البطاقات البالغ عددها 51 في هذه المجموعة.
فتح الحزمة
k this deck
38
A) (0.59, 6.57)
B) (1.24, 5.92)
C) (0.72, 6.44)
D) (0, 5.92)
فتح الحزمة
افتح القفل للوصول البطاقات البالغ عددها 51 في هذه المجموعة.
فتح الحزمة
k this deck
39
Use the given set of points to compute the predicted value for the given value of x.
A) 47.2615
B) 57.8
C) 130.4
D) 126.4615
for the given value of x.A) 47.2615
B) 57.8
C) 130.4
D) 126.4615
فتح الحزمة
افتح القفل للوصول البطاقات البالغ عددها 51 في هذه المجموعة.
فتح الحزمة
k this deck
40
The following MINITAB output presents a 95% confidence interval for the mean ozone level on days when the relative humidity is 40%, and a 95% prediction interval for the ozone level on a
Particular day when the relative humidity is 40%. The units of ozone are parts per billion.
A) (41.23, 47.11)
B) (28.00, 60.34)
C) (40, 95)
D) (1.5, 44.17)
Particular day when the relative humidity is 40%. The units of ozone are parts per billion.
A) (41.23, 47.11)
B) (28.00, 60.34)
C) (40, 95)
D) (1.5, 44.17)
فتح الحزمة
افتح القفل للوصول البطاقات البالغ عددها 51 في هذه المجموعة.
فتح الحزمة
k this deck
41
The following MINITAB output presents a confidence interval for a mean response and a prediction
interval for an individual response. What is the 95% confidence interval for the mean response?
interval for an individual response.
What is the 95% confidence interval for the mean response? فتح الحزمة
افتح القفل للوصول البطاقات البالغ عددها 51 في هذه المجموعة.
فتح الحزمة
k this deck
42
The following MINITAB output presents a multiple regression equatior =b0+b1x1+b2x2+b3x3+b4x4
It is desired to drop one of the explanatory variables. Which of the following is the most appropriate action?
A) Drop x4, then see whether R2 increases
B) Drop x1, then see whether R2 increases
C) Drop x4, then see whether adjusted R2 increases
D) Drop x1, then see whether adjusted R2 increases
=b0+b1x1+b2x2+b3x3+b4x4It is desired to drop one of the explanatory variables. Which of the following is the most appropriate action?
A) Drop x4, then see whether R2 increases
B) Drop x1, then see whether R2 increases
C) Drop x4, then see whether adjusted R2 increases
D) Drop x1, then see whether adjusted R2 increases
فتح الحزمة
افتح القفل للوصول البطاقات البالغ عددها 51 في هذه المجموعة.
فتح الحزمة
k this deck
43
Construct the multiple regression sequence =b0+b1x1+b2x2+b3x3 for the following data set:
A) 11ecb400_8919_50a3_8ce8_fd19d1580fc5_TB1209_11=3.8708+0.2200 x1-0.1503 x2+22.4605 x3
B) 11ecb400_8919_50a3_8ce8_fd19d1580fc5_TB1209_11=3.5766+0.1982 x1-0.1453 x2+22.0113 x3
C) 11ecb400_8919_50a3_8ce8_fd19d1580fc5_TB1209_11=22.0113-0.1453 x1+0.1982 x2+3.5766 x3
D) 11ecb400_8919_50a3_8ce8_fd19d1580fc5_TB1209_11=22.4605-0.1503 x1+0.2200 x2+3.8708 x3
=b0+b1x1+b2x2+b3x3 for the following data set: A) 11ecb400_8919_50a3_8ce8_fd19d1580fc5_TB1209_11=3.8708+0.2200 x1-0.1503 x2+22.4605 x3
B) 11ecb400_8919_50a3_8ce8_fd19d1580fc5_TB1209_11=3.5766+0.1982 x1-0.1453 x2+22.0113 x3
C) 11ecb400_8919_50a3_8ce8_fd19d1580fc5_TB1209_11=22.0113-0.1453 x1+0.1982 x2+3.5766 x3
D) 11ecb400_8919_50a3_8ce8_fd19d1580fc5_TB1209_11=22.4605-0.1503 x1+0.2200 x2+3.8708 x3
فتح الحزمة
افتح القفل للوصول البطاقات البالغ عددها 51 في هذه المجموعة.
فتح الحزمة
k this deck
44
The following table lists values measured for 10 consecutive eruptions of the geyser Old Faithful in Yellowstone National Park. They are the duration, in minutes, of the eruption , the dormant
Period before the eruption , and the dormant period after the eruption (y).
Construct the multiple regression equation=b0+b1x1+b2x2
A) 11ecb400_b9ed_77b4_8ce8_434575de6d27_TB1209_11=122.22-1.85 x1-0.62 x2
B) 11ecb400_b9ed_77b4_8ce8_434575de6d27_TB1209_11=118.78-1.7675 x1-0.5856 x2
C) 11ecb400_b9ed_77b4_8ce8_434575de6d27_TB1209_11=-0.62-1.85 x1+122.22 x2
D) 11ecb400_b9ed_77b4_8ce8_434575de6d27_TB1209_11=-0.5856-1.7675 x1+118.78 x2
, the dormantPeriod before the eruption
, and the dormant period after the eruption (y). Construct the multiple regression equation
=b0+b1x1+b2x2A) 11ecb400_b9ed_77b4_8ce8_434575de6d27_TB1209_11=122.22-1.85 x1-0.62 x2
B) 11ecb400_b9ed_77b4_8ce8_434575de6d27_TB1209_11=118.78-1.7675 x1-0.5856 x2
C) 11ecb400_b9ed_77b4_8ce8_434575de6d27_TB1209_11=-0.62-1.85 x1+122.22 x2
D) 11ecb400_b9ed_77b4_8ce8_434575de6d27_TB1209_11=-0.5856-1.7675 x1+118.78 x2
فتح الحزمة
افتح القفل للوصول البطاقات البالغ عددها 51 في هذه المجموعة.
فتح الحزمة
k this deck
45
b3x3 What percentage of the variation in y is explained by the model?A) 50.0%
B) 42.3%
C) 0.3%
D) 7.7396%
فتح الحزمة
افتح القفل للوصول البطاقات البالغ عددها 51 في هذه المجموعة.
فتح الحزمة
k this deck
46
Is the model useful for prediction? Use the = 0.05 level.A) Yes
B) No
فتح الحزمة
افتح القفل للوصول البطاقات البالغ عددها 51 في هذه المجموعة.
فتح الحزمة
k this deck
47
The following MINITAB output presents a multiple regression equatior =b0+b1x1+b2x2+b3x3+b4x4
Let be the coefficient Test the hypothesis versus level. What do you conclude?
A) Reject H0
B) Do not reject H0
=b0+b1x1+b2x2+b3x3+b4x4Let
be the coefficient Test the hypothesis versus level. What do you conclude?A) Reject H0
B) Do not reject H0
فتح الحزمة
افتح القفل للوصول البطاقات البالغ عددها 51 في هذه المجموعة.
فتح الحزمة
k this deck
48
A) 9.798
B) 9.8031
C) 10.6228
D) 11.7599
فتح الحزمة
افتح القفل للوصول البطاقات البالغ عددها 51 في هذه المجموعة.
فتح الحزمة
k this deck
49
The following MINITAB output presents a confidence interval for a mean response and a prediction
interval for an individual response.
interval for an individual response.
فتح الحزمة
افتح القفل للوصول البطاقات البالغ عددها 51 في هذه المجموعة.
فتح الحزمة
k this deck
50
The following MINITAB output presents a 95% confidence interval for the mean ozone level on days when the relative humidity is 40%, and a 95% prediction interval for the ozone level on a
Particular day when the relative humidity is 40%. The units of ozone are parts per billion. Predict the ozone level for a day when the relative humidity is 40%.
A) 35.82
B) 40.0
C) 1.3
D) 38.37
Particular day when the relative humidity is 40%. The units of ozone are parts per billion.
Predict the ozone level for a day when the relative humidity is 40%.A) 35.82
B) 40.0
C) 1.3
D) 38.37
فتح الحزمة
افتح القفل للوصول البطاقات البالغ عددها 51 في هذه المجموعة.
فتح الحزمة
k this deck
51
The following MINITAB output presents a multiple regression equatior =b0+b1x1+b2x2+b3x3+b4x4
Let be the coefficient Test the hypothesis rersus
level. What do you conclude?
A) Do not H0
B) Reject H0
=b0+b1x1+b2x2+b3x3+b4x4Let
be the coefficient Test the hypothesis rersus level. What do you conclude?
A) Do not H0
B) Reject H0
فتح الحزمة
افتح القفل للوصول البطاقات البالغ عددها 51 في هذه المجموعة.
فتح الحزمة
k this deck
فتح الحزمة
افتح القفل للوصول البطاقات البالغ عددها 51 في هذه المجموعة.


