Deck 12: Tests With Qualitative Data
ملء الشاشة (f)
سؤال
For the following observed and expected frequencies, compute the value of 
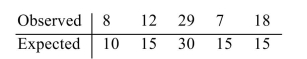
A) 11.070
B) 9.488
C) 8.260
D) 5.900
A) 11.070
B) 9.488
C) 8.260
D) 5.900
سؤال
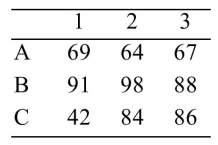
For the given table of observed frequencies: 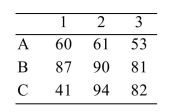 i). Compute the row totals, the column totals, and the grand total.
ii). Construct the corresponding table of expected values.
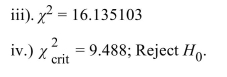
iii). Compute the value of the chi-square test statistic.
iv). Perform a test for independence, using the level of significance.
i). Compute the row totals, the column totals, and the grand total.ii). Construct the corresponding table of expected values.
iii). Compute the value of the chi-square test statistic.
iv). Perform a test for independence, using the
level of significance. سؤال
The number of visits to a certain web site were counted each day of a particular week. The results are given in
the following table.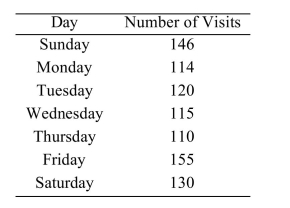 Test the hypothesis that the web site visits are equally likely to occur on any day of the week. Use the
level of significance.
the following table.
Test the hypothesis that the web site visits are equally likely to occur on any day of the week. Use thelevel of significance.
سؤال
A psychology instructor gave a five-question true-false quiz to her class of 201 students. The results were as follows. 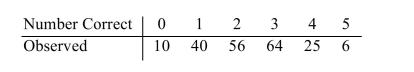 The instructor thinks that the students may have answered the questions by guessing, so that the probability that
Any given answer is correct is 0.5. Under the null hypothesis, the number of correct answers has a binomial
Distribution with 5 trials and success probability 0.5.
Perform a chi-square test of this hypothesis. Can you reject H0 at the =0.01 level?
A) No
B) Yes
The instructor thinks that the students may have answered the questions by guessing, so that the probability thatAny given answer is correct is 0.5. Under the null hypothesis, the number of correct answers has a binomial
Distribution with 5 trials and success probability 0.5.
Perform a chi-square test of this hypothesis. Can you reject H0 at the
=0.01 level?A) No
B) Yes
سؤال
A) 31.667
B) 11.070
C) 9.488
D) 30.308
سؤال
The number of drunk-driving arrests were counted each month by the Millville police department. The results are given in the following table.  Test the hypothesis that drunk-driving arrests are equally likely to occur in any month. Use the
  = 0.05 level Of significance.
A) Do not reject H0. The arrests may be equally likely.
B) Reject H0. The arrests do not appear to be equally likely
Test the hypothesis that drunk-driving arrests are equally likely to occur in any month. Use the = 0.05 level Of significance. A) Do not reject H0. The arrests may be equally likely.
B) Reject H0. The arrests do not appear to be equally likely
سؤال
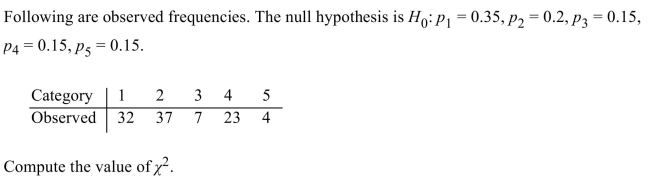
Following are observed frequencies. The null hypothesis is H0: p1=0.3, p2=0.2, p3=0.2, p4=0.15, p5=0.15 .
![Following are observed frequencies. The null hypothesis is H<sub>0</sub>: p<sub>1</sub>=0.3, p<sub>2</sub>=0.2, p<sub>3</sub>=0.2, p<sub>4</sub>=0.15, p<sub>5</sub>=0.15 . i). Compute the expected frequencies. ii). Compute the value of X<sup>2</sup>. iii). How many degrees of freedom are there? iv). Test the hypothesis that the distribution of the observed frequencies is as given by the null hypot] the =0.01 level of significance.<div style=padding-top: 35px>](https://d2lvgg3v3hfg70.cloudfront.net/TB1209/11ecb401_2d91_8086_8ce8_f93eb2a3baf0_TB1209_11.jpg)
i). Compute the expected frequencies.
ii). Compute the value of X2.
iii). How many degrees of freedom are there?
iv). Test the hypothesis that the distribution of the observed frequencies is as given by the null hypot] the![Following are observed frequencies. The null hypothesis is H<sub>0</sub>: p<sub>1</sub>=0.3, p<sub>2</sub>=0.2, p<sub>3</sub>=0.2, p<sub>4</sub>=0.15, p<sub>5</sub>=0.15 . i). Compute the expected frequencies. ii). Compute the value of X<sup>2</sup>. iii). How many degrees of freedom are there? iv). Test the hypothesis that the distribution of the observed frequencies is as given by the null hypot] the =0.01 level of significance.<div style=padding-top: 35px>](https://d2lvgg3v3hfg70.cloudfront.net/TB34225555/11ec916d_0c80_24cf_a226_8f142c296e99_TB34225555_11.jpg) =0.01 level of significance.
=0.01 level of significance.
i). Compute the expected frequencies.
ii). Compute the value of X2.
iii). How many degrees of freedom are there?
iv). Test the hypothesis that the distribution of the observed frequencies is as given by the null hypot] the
=0.01 level of significance. سؤال
The number of visits to a certain web site were counted each day of a particular week. The results are given in the following table. 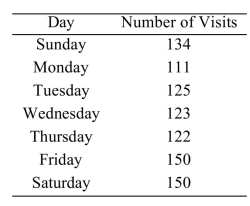 Test the hypothesis that web site visits are equally likely to occur on any day of the week. Use the
  = 0.05 Level of significance.
A) Do not reject H0. The visits may be equally likely
B) Reject H0. The visits do not appear to be equally likely
Test the hypothesis that web site visits are equally likely to occur on any day of the week. Use the = 0.05 Level of significance. A) Do not reject H0. The visits may be equally likely
B) Reject H0. The visits do not appear to be equally likely
سؤال
A biology professor claims that, on the average, 15% of her students get a grade of A, 20% get a B, 40% get a C, 15% get a D, and 10% get an F. The grades of a random sample of 135 students were
Recorded. The following table presents the results.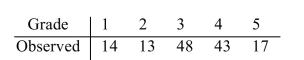 What is the value of
  ?
?
A) 9.488
B) 37.333
C) 11.143
D) 36.321
Recorded. The following table presents the results.
What is the value of ?A) 9.488
B) 37.333
C) 11.143
D) 36.321
سؤال
Following are observed frequencies. The null hypothesis is H0: p1=0.4, p2=0.2, p3=0.15,p4=0.1, p5=0.15
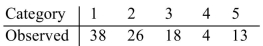
Compute the expected frequencies.
A) 0.384,0.263,0.182,0.04,0.131
B) 38,26,18,4,13
C) 39.6,19.8,14.85,9.9,14.85
D) 19.8,19.8,19.8,19.8,19.8
Compute the expected frequencies.
A) 0.384,0.263,0.182,0.04,0.131
B) 38,26,18,4,13
C) 39.6,19.8,14.85,9.9,14.85
D) 19.8,19.8,19.8,19.8,19.8
سؤال
Following are observed frequencies. The null hypothesis is H0: p1=0.35, p2=0.3, p3=0.1,p4=0.15, p5=0.1
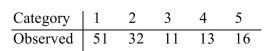
Test the hypothesis that the distribution of the observed frequencies is as given by the null hypothesis level of significance.
A) Do not reject H0
B) Reject H0
Test the hypothesis that the distribution of the observed frequencies is as given by the null hypothesis
level of significance.A) Do not reject H0
B) Reject H0
سؤال
A biology professor claims that, on the average, 10% of her students get a grade of A, 30% get a B, 35% get a C, 10% get a D, and 15% get an F. The grades of a random sample of 113 students were Recorded. The following table presents the results.
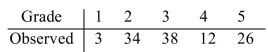
Compute the expected frequencies.
A) 3,34,38,12,26
B) 0.027,0.301,0.336,0.106,0.23
C) 11.3,33.9,39.55,11.3,16.95
D) 22.6,22.6,22.6,22.6,22.6
Compute the expected frequencies.
A) 3,34,38,12,26
B) 0.027,0.301,0.336,0.106,0.23
C) 11.3,33.9,39.55,11.3,16.95
D) 22.6,22.6,22.6,22.6,22.6
سؤال
The number of drunk-driving arrests were counted each month by the Millville police department. The results
are given in the following table.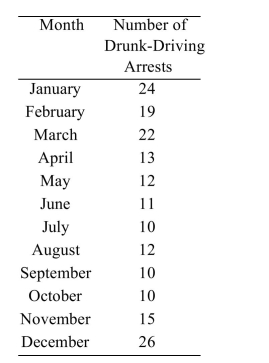 Test the hypothesis that drunk-driving arrests are equally likely to occur in any month. Use the
  = 0.05 level
of significance.
are given in the following table.
Test the hypothesis that drunk-driving arrests are equally likely to occur in any month. Use the = 0.05 levelof significance.
سؤال
سؤال
A psychology instructor gave a five-question true-false quiz to her class of 193 students. The results were as follows. 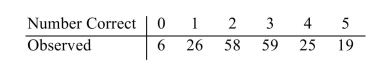 The instructor thinks that the students may have answered the questions by guessing, so that the probability that any given answer is correct is 0.5. Under the null hypothesis, the number of correct answers has a binomial distribution with 5 trials and success probability 0.5.
Perform a chi-square test of this hypothesis. Can you reject H0 at the =0.01 level?
The instructor thinks that the students may have answered the questions by guessing, so that the probability that any given answer is correct is 0.5. Under the null hypothesis, the number of correct answers has a binomial distribution with 5 trials and success probability 0.5.Perform a chi-square test of this hypothesis. Can you reject H0 at the
=0.01 level? سؤال
Following is a set of observed and expected frequencies: 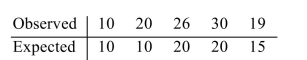
Test the hypothesis that the distribution of the observed frequencies is as given by the expected frequ Use the level of significance.
A) Do not reject H0
B) Reject H0
Test the hypothesis that the distribution of the observed frequencies is as given by the expected frequ Use the
level of significance.A) Do not reject H0
B) Reject H0
سؤال
For the given table of observed frequencies, perform a test for independence, using the α = 0.01 level of significance.
A) Do not reject H0
B) Reject H0
A) Do not reject H0
B) Reject H0
سؤال
A biology professor claims that, on the average, 15% of her students get a grade of A, 30% get a B, 30% get a C, 10% get a D, and 15% get an F. The grades of a random sample of 105 students were
Recorded. The following table presents the results.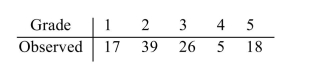 Test the hypothesis that the grades follow the distribution claimed by the professor. Use the
  level of
Significance.
A) Reject
B) Do not reject
Recorded. The following table presents the results.
Test the hypothesis that the grades follow the distribution claimed by the professor. Use the level ofSignificance.
A) Reject
B) Do not reject
سؤال
Find the  critical value for the chi-square statistic with 13 degrees of freedom.
A) 4.107
B) 27.688
C) 29.819
D) 26.217
critical value for the chi-square statistic with 13 degrees of freedom.A) 4.107
B) 27.688
C) 29.819
D) 26.217
سؤال
A biology professor claims that, on the average, 20% of her students get a grade of A, 30% get a B,
35% get a C, 10% get a D, and 5% get an F. The grades of a random sample of 137 students were
recorded. The following table presents the results.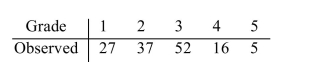 i). Compute the expected frequencies.
ii). What is the value of ?
?
iii). How many degrees of freedom are there?
iv). Test the hypothesis that the grades follow the distribution claimed by the professor. Use the = 0.05
level of significance.
35% get a C, 10% get a D, and 5% get an F. The grades of a random sample of 137 students were
recorded. The following table presents the results.
i). Compute the expected frequencies.ii). What is the value of
?iii). How many degrees of freedom are there?
iv). Test the hypothesis that the grades follow the distribution claimed by the professor. Use the
= 0.05level of significance.
سؤال
The following table presents the numbers of cucumber seeds, by brand, that germinated or failed to germinate 14 days after planting. 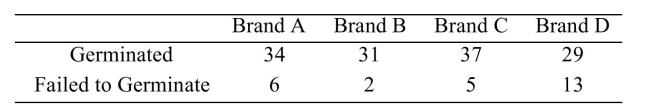 Can you conclude that the germination rate is related to the brand of seed? Use the
  level of significance.
Can you conclude that the germination rate is related to the brand of seed? Use the level of significance. سؤال
A sample of 149 university students who recently moved off-campus were polled to see whether they agree that off-campus living is preferable to on-campus living. In addition, each was asked how many people live in
Their current off-campus residence. The results are summarized in the following contingency table.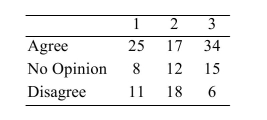 Perform a test for independence, using the
  level of significance. What do you conclude?
A) Do not reject H0. There is insufficient evidence to conclude that the survey responses and the number of roommates are dependent.
B) Reject H0 It appears that the survey responses and the number of roommates are dependent.
Their current off-campus residence. The results are summarized in the following contingency table.
Perform a test for independence, using the level of significance. What do you conclude?A) Do not reject H0. There is insufficient evidence to conclude that the survey responses and the number of roommates are dependent.
B) Reject H0 It appears that the survey responses and the number of roommates are dependent.
سؤال
The following table presents the numbers of customers who - after 2 weeks of use - were satisfied or dissatisfied with their newly-purchased computers. 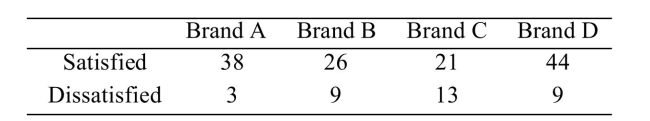 Can you conclude that the satisfaction rate is related to the brand of computer? Use the
  level of Significance.
A) Do not reject H0. There is insufficient evidence to conclude that the satisfaction rate differs among the computer brands.
B) Reject H0 It appears that the satisfaction rates differ among the computer brands.
Can you conclude that the satisfaction rate is related to the brand of computer? Use the level of Significance. A) Do not reject H0. There is insufficient evidence to conclude that the satisfaction rate differs among the computer brands.
B) Reject H0 It appears that the satisfaction rates differ among the computer brands.
سؤال
The following table presents the numbers of customers who - after 2 weeks of use - were satisfied or dissatisfied with their newly-purchased computers. 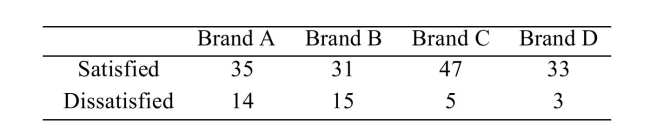 Can you conclude that the satisfaction rate is related to the brand of computer? Use the
  level of significance.
Can you conclude that the satisfaction rate is related to the brand of computer? Use the level of significance. سؤال
A sample of 178 university students who recently moved off-campus were polled to see whether they agree
that off-campus living is preferable to on-campus living. In addition, each was asked how many people live in
their current off-campus residence. The results are summarized in the following contingency table. i). Compute the row totals, the column totals, and the grand total.
ii). Construct the corresponding table of expected values.
iii). Compute the value of the chi-square test statistic.
iv). Perform a test for independence, using the level of significance. What do you conclude?
that off-campus living is preferable to on-campus living. In addition, each was asked how many people live in
their current off-campus residence. The results are summarized in the following contingency table.
i). Compute the row totals, the column totals, and the grand total.ii). Construct the corresponding table of expected values.
iii). Compute the value of the chi-square test statistic.
iv). Perform a test for independence, using the
level of significance. What do you conclude? سؤال
The following table presents the numbers of cucumber seeds, by brand, that germinated or failed to germinate 14 days after planting. 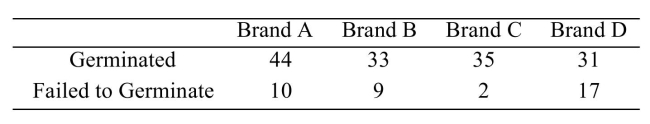 Can you conclude that the germination rate is related to the brand of seed? Use the
  level of Significance.
A) Reject H0. It appears that the germination rates differ among the seed brands.
B) Do not reject H0. There is insufficient evidence to conclude that the germination rate differs among the seed brands.
Can you conclude that the germination rate is related to the brand of seed? Use the level of Significance. A) Reject H0. It appears that the germination rates differ among the seed brands.
B) Do not reject H0. There is insufficient evidence to conclude that the germination rate differs among the seed brands.

فتح الحزمة
قم بالتسجيل لفتح البطاقات في هذه المجموعة!
Unlock Deck
Unlock Deck
1/26
العب
ملء الشاشة (f)
Deck 12: Tests With Qualitative Data
1
For the following observed and expected frequencies, compute the value of
A) 11.070
B) 9.488
C) 8.260
D) 5.900
A) 11.070
B) 9.488
C) 8.260
D) 5.900
5.900
2
For the given table of observed frequencies: i). Compute the row totals, the column totals, and the grand total.
ii). Construct the corresponding table of expected values.
iii). Compute the value of the chi-square test statistic.
iv). Perform a test for independence, using the level of significance.
i). Compute the row totals, the column totals, and the grand total.ii). Construct the corresponding table of expected values.
iii). Compute the value of the chi-square test statistic.
iv). Perform a test for independence, using the
level of significance.i). 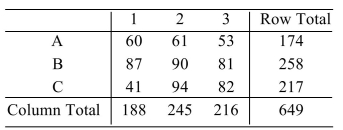
ii). Expected Values: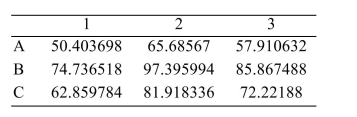
ii). Expected Values:
3
The number of visits to a certain web site were counted each day of a particular week. The results are given in
the following table. Test the hypothesis that the web site visits are equally likely to occur on any day of the week. Use the
level of significance.
the following table.
Test the hypothesis that the web site visits are equally likely to occur on any day of the week. Use thelevel of significance.
Expected frequency for each day: 127.142857 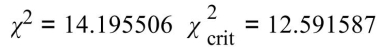
Reject H0 The visits do not appear to be equally likely.
Reject H0 The visits do not appear to be equally likely.
4
A psychology instructor gave a five-question true-false quiz to her class of 201 students. The results were as follows. The instructor thinks that the students may have answered the questions by guessing, so that the probability that
Any given answer is correct is 0.5. Under the null hypothesis, the number of correct answers has a binomial
Distribution with 5 trials and success probability 0.5.
Perform a chi-square test of this hypothesis. Can you reject H0 at the=0.01 level?
A) No
B) Yes
The instructor thinks that the students may have answered the questions by guessing, so that the probability thatAny given answer is correct is 0.5. Under the null hypothesis, the number of correct answers has a binomial
Distribution with 5 trials and success probability 0.5.
Perform a chi-square test of this hypothesis. Can you reject H0 at the
=0.01 level?A) No
B) Yes
فتح الحزمة
افتح القفل للوصول البطاقات البالغ عددها 26 في هذه المجموعة.
فتح الحزمة
k this deck
5
A) 31.667
B) 11.070
C) 9.488
D) 30.308
فتح الحزمة
افتح القفل للوصول البطاقات البالغ عددها 26 في هذه المجموعة.
فتح الحزمة
k this deck
6
The number of drunk-driving arrests were counted each month by the Millville police department. The results are given in the following table. Test the hypothesis that drunk-driving arrests are equally likely to occur in any month. Use the = 0.05 level Of significance.
A) Do not reject H0. The arrests may be equally likely.
B) Reject H0. The arrests do not appear to be equally likely
Test the hypothesis that drunk-driving arrests are equally likely to occur in any month. Use the = 0.05 level Of significance. A) Do not reject H0. The arrests may be equally likely.
B) Reject H0. The arrests do not appear to be equally likely
فتح الحزمة
افتح القفل للوصول البطاقات البالغ عددها 26 في هذه المجموعة.
فتح الحزمة
k this deck
7
Following are observed frequencies. The null hypothesis is H0: p1=0.3, p2=0.2, p3=0.2, p4=0.15, p5=0.15 .
i). Compute the expected frequencies.
ii). Compute the value of X2.
iii). How many degrees of freedom are there?
iv). Test the hypothesis that the distribution of the observed frequencies is as given by the null hypot] the=0.01 level of significance.
i). Compute the expected frequencies.
ii). Compute the value of X2.
iii). How many degrees of freedom are there?
iv). Test the hypothesis that the distribution of the observed frequencies is as given by the null hypot] the
=0.01 level of significance. فتح الحزمة
افتح القفل للوصول البطاقات البالغ عددها 26 في هذه المجموعة.
فتح الحزمة
k this deck
8
The number of visits to a certain web site were counted each day of a particular week. The results are given in the following table. Test the hypothesis that web site visits are equally likely to occur on any day of the week. Use the = 0.05 Level of significance.
A) Do not reject H0. The visits may be equally likely
B) Reject H0. The visits do not appear to be equally likely
Test the hypothesis that web site visits are equally likely to occur on any day of the week. Use the = 0.05 Level of significance. A) Do not reject H0. The visits may be equally likely
B) Reject H0. The visits do not appear to be equally likely
فتح الحزمة
افتح القفل للوصول البطاقات البالغ عددها 26 في هذه المجموعة.
فتح الحزمة
k this deck
9
A biology professor claims that, on the average, 15% of her students get a grade of A, 20% get a B, 40% get a C, 15% get a D, and 10% get an F. The grades of a random sample of 135 students were
Recorded. The following table presents the results. What is the value of ?
A) 9.488
B) 37.333
C) 11.143
D) 36.321
Recorded. The following table presents the results.
What is the value of ?A) 9.488
B) 37.333
C) 11.143
D) 36.321
فتح الحزمة
افتح القفل للوصول البطاقات البالغ عددها 26 في هذه المجموعة.
فتح الحزمة
k this deck
10
Following are observed frequencies. The null hypothesis is H0: p1=0.4, p2=0.2, p3=0.15,p4=0.1, p5=0.15
Compute the expected frequencies.
A) 0.384,0.263,0.182,0.04,0.131
B) 38,26,18,4,13
C) 39.6,19.8,14.85,9.9,14.85
D) 19.8,19.8,19.8,19.8,19.8
Compute the expected frequencies.
A) 0.384,0.263,0.182,0.04,0.131
B) 38,26,18,4,13
C) 39.6,19.8,14.85,9.9,14.85
D) 19.8,19.8,19.8,19.8,19.8
فتح الحزمة
افتح القفل للوصول البطاقات البالغ عددها 26 في هذه المجموعة.
فتح الحزمة
k this deck
11
Following are observed frequencies. The null hypothesis is H0: p1=0.35, p2=0.3, p3=0.1,p4=0.15, p5=0.1
Test the hypothesis that the distribution of the observed frequencies is as given by the null hypothesis level of significance.
A) Do not reject H0
B) Reject H0
Test the hypothesis that the distribution of the observed frequencies is as given by the null hypothesis
level of significance.A) Do not reject H0
B) Reject H0
فتح الحزمة
افتح القفل للوصول البطاقات البالغ عددها 26 في هذه المجموعة.
فتح الحزمة
k this deck
12
A biology professor claims that, on the average, 10% of her students get a grade of A, 30% get a B, 35% get a C, 10% get a D, and 15% get an F. The grades of a random sample of 113 students were Recorded. The following table presents the results.
Compute the expected frequencies.
A) 3,34,38,12,26
B) 0.027,0.301,0.336,0.106,0.23
C) 11.3,33.9,39.55,11.3,16.95
D) 22.6,22.6,22.6,22.6,22.6
Compute the expected frequencies.
A) 3,34,38,12,26
B) 0.027,0.301,0.336,0.106,0.23
C) 11.3,33.9,39.55,11.3,16.95
D) 22.6,22.6,22.6,22.6,22.6
فتح الحزمة
افتح القفل للوصول البطاقات البالغ عددها 26 في هذه المجموعة.
فتح الحزمة
k this deck
13
The number of drunk-driving arrests were counted each month by the Millville police department. The results
are given in the following table. Test the hypothesis that drunk-driving arrests are equally likely to occur in any month. Use the = 0.05 level
of significance.
are given in the following table.
Test the hypothesis that drunk-driving arrests are equally likely to occur in any month. Use the = 0.05 levelof significance.
فتح الحزمة
افتح القفل للوصول البطاقات البالغ عددها 26 في هذه المجموعة.
فتح الحزمة
k this deck
14
Find the area to the right of 23.337 under the chi-square distribution with 12 degrees of freedom.
A) 0.0125
B) 0.975
C) 0.025
D) 0.0375
A) 0.0125
B) 0.975
C) 0.025
D) 0.0375
فتح الحزمة
افتح القفل للوصول البطاقات البالغ عددها 26 في هذه المجموعة.
فتح الحزمة
k this deck
15
A psychology instructor gave a five-question true-false quiz to her class of 193 students. The results were as follows. The instructor thinks that the students may have answered the questions by guessing, so that the probability that any given answer is correct is 0.5. Under the null hypothesis, the number of correct answers has a binomial distribution with 5 trials and success probability 0.5.
Perform a chi-square test of this hypothesis. Can you reject H0 at the=0.01 level?
The instructor thinks that the students may have answered the questions by guessing, so that the probability that any given answer is correct is 0.5. Under the null hypothesis, the number of correct answers has a binomial distribution with 5 trials and success probability 0.5.Perform a chi-square test of this hypothesis. Can you reject H0 at the
=0.01 level? فتح الحزمة
افتح القفل للوصول البطاقات البالغ عددها 26 في هذه المجموعة.
فتح الحزمة
k this deck
16
Following is a set of observed and expected frequencies:
Test the hypothesis that the distribution of the observed frequencies is as given by the expected frequ Use the level of significance.
A) Do not reject H0
B) Reject H0
Test the hypothesis that the distribution of the observed frequencies is as given by the expected frequ Use the
level of significance.A) Do not reject H0
B) Reject H0
فتح الحزمة
افتح القفل للوصول البطاقات البالغ عددها 26 في هذه المجموعة.
فتح الحزمة
k this deck
17
For the given table of observed frequencies, perform a test for independence, using the α = 0.01 level of significance.
A) Do not reject H0
B) Reject H0
A) Do not reject H0
B) Reject H0
فتح الحزمة
افتح القفل للوصول البطاقات البالغ عددها 26 في هذه المجموعة.
فتح الحزمة
k this deck
18
A biology professor claims that, on the average, 15% of her students get a grade of A, 30% get a B, 30% get a C, 10% get a D, and 15% get an F. The grades of a random sample of 105 students were
Recorded. The following table presents the results. Test the hypothesis that the grades follow the distribution claimed by the professor. Use the level of
Significance.
A) Reject
B) Do not reject
Recorded. The following table presents the results.
Test the hypothesis that the grades follow the distribution claimed by the professor. Use the level ofSignificance.
A) Reject
B) Do not reject
فتح الحزمة
افتح القفل للوصول البطاقات البالغ عددها 26 في هذه المجموعة.
فتح الحزمة
k this deck
19
Find the critical value for the chi-square statistic with 13 degrees of freedom.
A) 4.107
B) 27.688
C) 29.819
D) 26.217
critical value for the chi-square statistic with 13 degrees of freedom.A) 4.107
B) 27.688
C) 29.819
D) 26.217
فتح الحزمة
افتح القفل للوصول البطاقات البالغ عددها 26 في هذه المجموعة.
فتح الحزمة
k this deck
20
A biology professor claims that, on the average, 20% of her students get a grade of A, 30% get a B,
35% get a C, 10% get a D, and 5% get an F. The grades of a random sample of 137 students were
recorded. The following table presents the results. i). Compute the expected frequencies.
ii). What is the value of ?
iii). How many degrees of freedom are there?
iv). Test the hypothesis that the grades follow the distribution claimed by the professor. Use the = 0.05
level of significance.
35% get a C, 10% get a D, and 5% get an F. The grades of a random sample of 137 students were
recorded. The following table presents the results.
i). Compute the expected frequencies.ii). What is the value of
?iii). How many degrees of freedom are there?
iv). Test the hypothesis that the grades follow the distribution claimed by the professor. Use the
= 0.05level of significance.
فتح الحزمة
افتح القفل للوصول البطاقات البالغ عددها 26 في هذه المجموعة.
فتح الحزمة
k this deck
21
The following table presents the numbers of cucumber seeds, by brand, that germinated or failed to germinate 14 days after planting. Can you conclude that the germination rate is related to the brand of seed? Use the level of significance.
Can you conclude that the germination rate is related to the brand of seed? Use the level of significance. فتح الحزمة
افتح القفل للوصول البطاقات البالغ عددها 26 في هذه المجموعة.
فتح الحزمة
k this deck
22
A sample of 149 university students who recently moved off-campus were polled to see whether they agree that off-campus living is preferable to on-campus living. In addition, each was asked how many people live in
Their current off-campus residence. The results are summarized in the following contingency table. Perform a test for independence, using the level of significance. What do you conclude?
A) Do not reject H0. There is insufficient evidence to conclude that the survey responses and the number of roommates are dependent.
B) Reject H0 It appears that the survey responses and the number of roommates are dependent.
Their current off-campus residence. The results are summarized in the following contingency table.
Perform a test for independence, using the level of significance. What do you conclude?A) Do not reject H0. There is insufficient evidence to conclude that the survey responses and the number of roommates are dependent.
B) Reject H0 It appears that the survey responses and the number of roommates are dependent.
فتح الحزمة
افتح القفل للوصول البطاقات البالغ عددها 26 في هذه المجموعة.
فتح الحزمة
k this deck
23
The following table presents the numbers of customers who - after 2 weeks of use - were satisfied or dissatisfied with their newly-purchased computers. Can you conclude that the satisfaction rate is related to the brand of computer? Use the level of Significance.
A) Do not reject H0. There is insufficient evidence to conclude that the satisfaction rate differs among the computer brands.
B) Reject H0 It appears that the satisfaction rates differ among the computer brands.
Can you conclude that the satisfaction rate is related to the brand of computer? Use the level of Significance. A) Do not reject H0. There is insufficient evidence to conclude that the satisfaction rate differs among the computer brands.
B) Reject H0 It appears that the satisfaction rates differ among the computer brands.
فتح الحزمة
افتح القفل للوصول البطاقات البالغ عددها 26 في هذه المجموعة.
فتح الحزمة
k this deck
24
The following table presents the numbers of customers who - after 2 weeks of use - were satisfied or dissatisfied with their newly-purchased computers. Can you conclude that the satisfaction rate is related to the brand of computer? Use the level of significance.
Can you conclude that the satisfaction rate is related to the brand of computer? Use the level of significance. فتح الحزمة
افتح القفل للوصول البطاقات البالغ عددها 26 في هذه المجموعة.
فتح الحزمة
k this deck
25
A sample of 178 university students who recently moved off-campus were polled to see whether they agree
that off-campus living is preferable to on-campus living. In addition, each was asked how many people live in
their current off-campus residence. The results are summarized in the following contingency table. i). Compute the row totals, the column totals, and the grand total.
ii). Construct the corresponding table of expected values.
iii). Compute the value of the chi-square test statistic.
iv). Perform a test for independence, using the level of significance. What do you conclude?
that off-campus living is preferable to on-campus living. In addition, each was asked how many people live in
their current off-campus residence. The results are summarized in the following contingency table.
i). Compute the row totals, the column totals, and the grand total.ii). Construct the corresponding table of expected values.
iii). Compute the value of the chi-square test statistic.
iv). Perform a test for independence, using the
level of significance. What do you conclude? فتح الحزمة
افتح القفل للوصول البطاقات البالغ عددها 26 في هذه المجموعة.
فتح الحزمة
k this deck
26
The following table presents the numbers of cucumber seeds, by brand, that germinated or failed to germinate 14 days after planting. Can you conclude that the germination rate is related to the brand of seed? Use the level of Significance.
A) Reject H0. It appears that the germination rates differ among the seed brands.
B) Do not reject H0. There is insufficient evidence to conclude that the germination rate differs among the seed brands.
Can you conclude that the germination rate is related to the brand of seed? Use the level of Significance. A) Reject H0. It appears that the germination rates differ among the seed brands.
B) Do not reject H0. There is insufficient evidence to conclude that the germination rate differs among the seed brands.
فتح الحزمة
افتح القفل للوصول البطاقات البالغ عددها 26 في هذه المجموعة.
فتح الحزمة
k this deck
فتح الحزمة
افتح القفل للوصول البطاقات البالغ عددها 26 في هذه المجموعة.


