Deck 11: Two-Sample Hypothesis Tests
ملء الشاشة (f)
سؤال
A study reported that in a sample of 93 men, 23 had elevated total cholesterol levels (more than 200 milligrams per deciliter). In a sample of 104 women, 21 had elevated cholesterol levels.
Can you conclude that the proportion of people with elevated cholesterol levels differs between men and
Women? Use the level of significance.
A) Yes
B) No
Can you conclude that the proportion of people with elevated cholesterol levels differs between men and
Women? Use the
level of significance.A) Yes
B) No
سؤال
In a random sample of 370 cars driven at low altitudes, 43 of them exceeded a standard of 10 grams of particulate pollution per gallon of fuel consumed. In an independent random sample of 80 cars
Driven at high altitudes, 23 of them exceeded the standard. Can you conclude that the proportion of
High-altitude vehicles exceeding the standard is greater than the proportion of low-altitude vehicles
Exceeding the standard at an level of significance?
A) No
B) Yes
Driven at high altitudes, 23 of them exceeded the standard. Can you conclude that the proportion of
High-altitude vehicles exceeding the standard is greater than the proportion of low-altitude vehicles
Exceeding the standard at an
level of significance?A) No
B) Yes
سؤال
 Compute the value of the test statistic.
A) 3.07
B) 2.83
C) 2.94
D) 2.91
سؤال
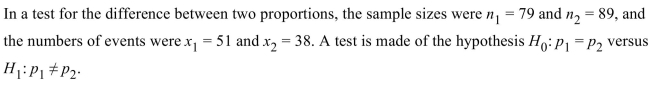
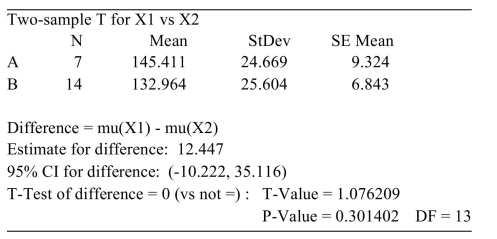
The following MINITAB output display presents the results of a hypothesis test for the difference  between two population means.
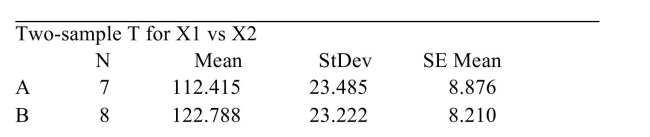
 How many degrees of freedom are there for the test statistic?
A) 10.373
B) 12
C) 1.593507
D) 13
between two population means. How many degrees of freedom are there for the test statistic?A) 10.373
B) 12
C) 1.593507
D) 13
سؤال
The following display from a TI-84 Plus calculator presents the results of a hypothesis test for the difference between two means. The sample sizes are 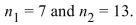
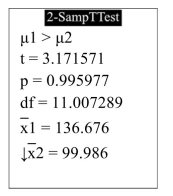 What is the P-value?
A) 0.995977
B) 11.007289
C) 0.004023
D) 3.171571
What is the P-value?A) 0.995977
B) 11.007289
C) 0.004023
D) 3.171571
سؤال
 Compute the value of the test statistic.
A) 5.132
B) 0.937
C) 7.357
D) 3.4
سؤال
In an agricultural experiment, the effects of two fertilizers on the production of oranges were measured. Fourteen randomly selected plots of land were treated with fertilizer A, and 10 randomly
Selected plots were treated with fertilizer B. The number of pounds of harvested fruit was measured
From each plot. Following are the results.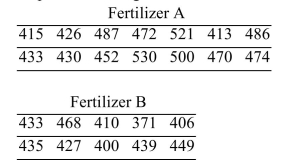 Assume that the populations are approximately normal. Can you conclude that there is a difference in the
Mean yields for the two types of fertilizer? Use the level of significance.
A) Yes
B) No
Selected plots were treated with fertilizer B. The number of pounds of harvested fruit was measured
From each plot. Following are the results.
Assume that the populations are approximately normal. Can you conclude that there is a difference in theMean yields for the two types of fertilizer? Use the
level of significance.A) Yes
B) No
سؤال
Are low-fat diets or low-carb diets more effective for weight loss? A sample of 70 subjects went on
a low-carbohydrate diet for six months. At the end of that time, the sample mean weight loss was
10.5 pounds with a sample standard deviation of 7.09 pounds. A second sample of 76 subjects went
on a low-fat diet. Their sample mean weight loss was 18.0 with a standard deviation of 7.26. Can
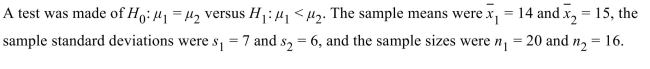
you conclude that the mean weight loss differed between the two diets? Use the level.
i). State the appropriate null and alternate hypotheses.
ii). Compute the test statistic.
iii). How many degrees of freedom are there, using the simple method?
iv). Do you reject H0 ? State a conclusion.
a low-carbohydrate diet for six months. At the end of that time, the sample mean weight loss was
10.5 pounds with a sample standard deviation of 7.09 pounds. A second sample of 76 subjects went
on a low-fat diet. Their sample mean weight loss was 18.0 with a standard deviation of 7.26. Can
you conclude that the mean weight loss differed between the two diets? Use the
level.i). State the appropriate null and alternate hypotheses.
ii). Compute the test statistic.
iii). How many degrees of freedom are there, using the simple method?
iv). Do you reject H0 ? State a conclusion.
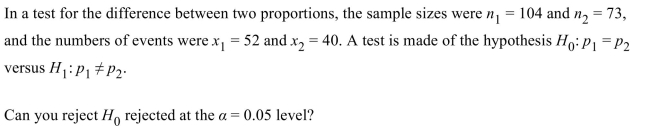
سؤال
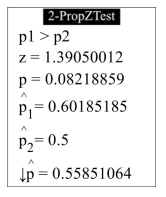
 Is
Is  rejected at the 0.05 level? (Hint: First compute the value of the test statistic.)
A) No
B) Yes
سؤال
The following display from a TI-84 Plus calculator presents the results of a hypothesis test for the difference between two means. The sample sizes are 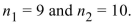

A) No
B) Yes
A) No
B) Yes
سؤال
The following MINITAB output display presents the results of a hypothesis test for the difference  between two population means.
What is the alternate hypothesis?
A)
B)
C)
D)
between two population means. What is the alternate hypothesis?
A)
B)
C)
D)
سؤال
 How many degrees of freedom are there for the test statistic, using the simple method?
A) 15
B) 16
C) 13
D) 17
سؤال
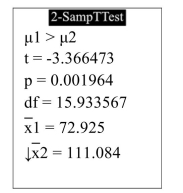
The following display from a TI-84 Plus calculator presents the results of a hypothesis test for the difference between two means. The sample sizes are 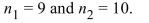
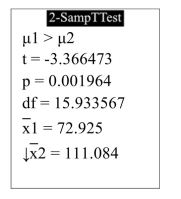 How many degrees of freedom did the calculator use?
A) 16.933567
B) 15.933567
C) 0.001964
D) -3.366473
How many degrees of freedom did the calculator use?A) 16.933567
B) 15.933567
C) 0.001964
D) -3.366473
سؤال
سؤال
A study reported that in a sample of 109 people who watch television news, 37 had elevated diastolic blood pressure levels (in millimeters of mercury, or mmHg). In a sample of 76 people who
Do not watch television news, 12 had elevated diastolic blood pressure levels.
Can you conclude that the proportion of people with elevated diastolic blood pressure levels differs between
News-watchers and those who do not watch news? Use the level of significance.
A) No
B) Yes
Do not watch television news, 12 had elevated diastolic blood pressure levels.
Can you conclude that the proportion of people with elevated diastolic blood pressure levels differs between
News-watchers and those who do not watch news? Use the
level of significance.A) No
B) Yes
سؤال
An automobile manufacturer wishes to test that claim that synthetic motor oil can improve gas mileage (in miles per gallon, or mpg). The table below shows the gas mileages, in mpg, of six cars
That used synthetic motor oil. The table also shows the gas mileages in mpg of six cars that were
Using conventional motor oil (the controls).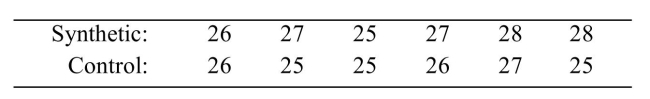 Can you conclude that the mean gas mileage for cars using synthetic motor oil is more than
The mean for the controls? Use the level of significance.
A) No
B) Yes
That used synthetic motor oil. The table also shows the gas mileages in mpg of six cars that were
Using conventional motor oil (the controls).
Can you conclude that the mean gas mileage for cars using synthetic motor oil is more thanThe mean for the controls? Use the
level of significance.A) No
B) Yes
سؤال
A garden seed wholesaler wishes to test the claim that tomato seeds germinate faster when each individual seed is "pelletized" within a coating of corn starch. The table below shows the
Germination times, in days, of six pelletized seeds. The table also shows the germination times in
Days of six un-coated seeds (the controls).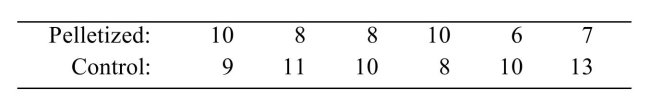 Can you conclude that the mean germination time for pelletized seeds is less than the mean
For the un-pelletized seeds? Use the level of significance.
A) Yes
B) No
Germination times, in days, of six pelletized seeds. The table also shows the germination times in
Days of six un-coated seeds (the controls).
Can you conclude that the mean germination time for pelletized seeds is less than the meanFor the un-pelletized seeds? Use the
level of significance.A) Yes
B) No
سؤال
The following MINITAB output display presents the results of a hypothesis test for the difference  between two population means.
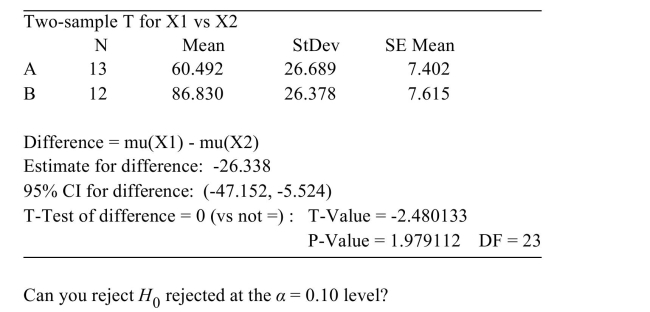
A) No
B) Yes
between two population means. A) No
B) Yes
سؤال
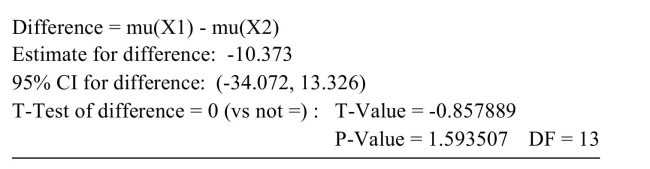
An amateur golfer wishes to determine if there is a difference between the drive distances of her two favorite drivers. (A driver is a specialized club for driving the golf ball down range.) She hits fourteen balls
With driver A and 10 balls with driver B. The drive distances (in yards) for the trials are show below.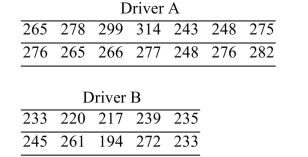 Assume that the populations are approximately normal. Can you conclude that there is a difference in the
Mean drive distances for the two drivers? Use the level of significance.
A) Yes
B) No
With driver A and 10 balls with driver B. The drive distances (in yards) for the trials are show below.
Assume that the populations are approximately normal. Can you conclude that there is a difference in theMean drive distances for the two drivers? Use the
level of significance.A) Yes
B) No
سؤال
A) Yes
B) No
سؤال
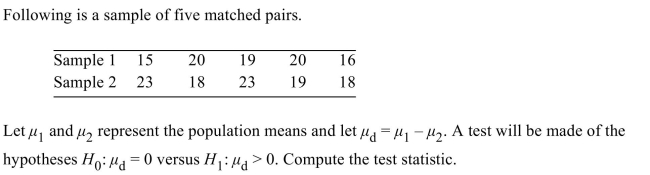
In an experiment to determine whether there is a systematic difference between the weights obtained with two different mass balances, six specimens were weighed, in grams, on each balance. The following data
Were obtained: Compute the test statistic.
A) 1.083
B) 2.433
C) 2.666
D) 0.313
Were obtained:
Compute the test statistic.A) 1.083
B) 2.433
C) 2.666
D) 0.313
سؤال
The football coach at State University wishes to determine if there is a decrease in offensive production between the first half and the second half of his team's recent games. The table below
Shows the first-half and second-half offensive production (measured in total yards gained per half)
For the past six games.
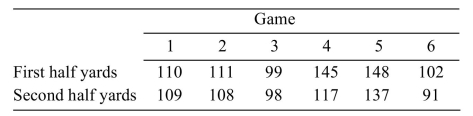
State a conclusion using the level of significance.
A) Do not reject H0. There is insufficient evidence to conclude that the mean offensive production decreases from the first to the second half.
B) Reject H0. The mean offensive production appears to decrease from the first half to the second half.
Shows the first-half and second-half offensive production (measured in total yards gained per half)
For the past six games.
State a conclusion using the
level of significance.A) Do not reject H0. There is insufficient evidence to conclude that the mean offensive production decreases from the first to the second half.
B) Reject H0. The mean offensive production appears to decrease from the first half to the second half.
سؤال
The following MINITAB output display presents the results of a hypothesis test on the difference between two proportions. 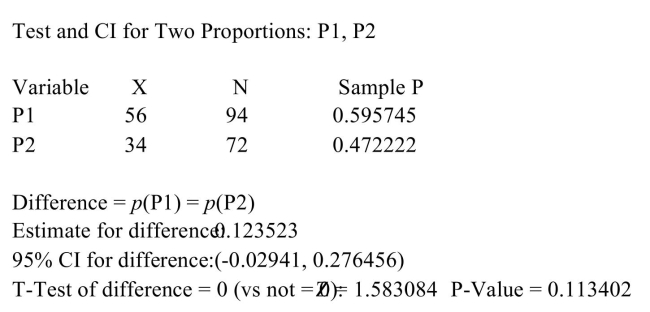 Is this a left-tailed test, a right-tailed test, or a two tailed test?
A) Left-tailed test
B) Two-tailed test
C) Right-tailed test
Is this a left-tailed test, a right-tailed test, or a two tailed test?A) Left-tailed test
B) Two-tailed test
C) Right-tailed test
سؤال
The following display from a TI-84 Plus calculator presents the results of a hypothesis test for the difference between two proportions. The sample sizes are 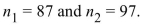
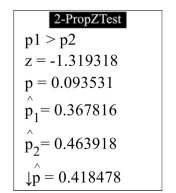 Is this a left-tailed test, a right-tailed test, or a two-tailed test?
A) Two-tailed test
B) Left-tailed test
C) Right-tailed test
Is this a left-tailed test, a right-tailed test, or a two-tailed test?A) Two-tailed test
B) Left-tailed test
C) Right-tailed test
سؤال
The football coach at State University wishes to determine if there is a change in offensive production between the first half and the second half of his team's recent games. The table below
Shows the first-half and second-half offensive production (measured in total yards gained per half)
For the past six games.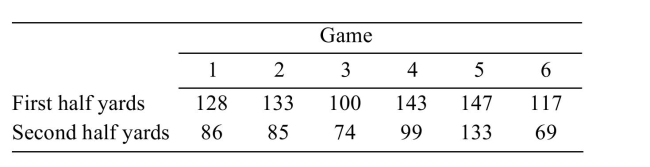 State the null and alternative hypotheses.
A)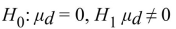
B)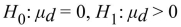
C)
D)
Shows the first-half and second-half offensive production (measured in total yards gained per half)
For the past six games.
State the null and alternative hypotheses. A)
B)
C)
D)
سؤال
Find the critical value 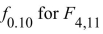
A) 3.71
B) 2.73
C) 2.54
D) 3.36
A) 3.71
B) 2.73
C) 2.54
D) 3.36
سؤال
The football coach at State University wishes to determine if there is a decrease in offensive
production between the first half and the second half of his team's recent games. The table below
shows the first-half and second-half offensive production (measured in total yards gained per half)
for the past six games.
Can you conclude that the mean offensive production in the first half differed from that of the seconc i). State the null and alternative hypotheses.
ii). Compute the test statistic.
iii). State a conclusion using the =0.02 level of significance.
production between the first half and the second half of his team's recent games. The table below
shows the first-half and second-half offensive production (measured in total yards gained per half)
for the past six games.
Can you conclude that the mean offensive production in the first half differed from that of the seconc i). State the null and alternative hypotheses.
ii). Compute the test statistic.
iii). State a conclusion using the
=0.02 level of significance. سؤال
In an experiment to determine whether there is a systematic difference between the weights obtained with two different mass balances, six specimens were weighed, in grams, on each balance. The following data
Were obtained: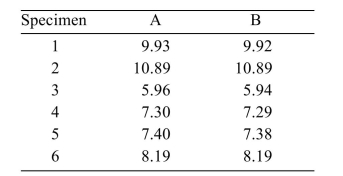 State a conclusion using the
  level of significance.
A) Do not reject . There is insufficient evidence to conclude that the mean
Difference differs from zero.
B) Reject . The mean difference appears to differ from zero.
Were obtained:
State a conclusion using the level of significance.A) Do not reject
. There is insufficient evidence to conclude that the meanDifference differs from zero.
B) Reject
. The mean difference appears to differ from zero. سؤال
In an experiment to determine whether there is a systematic difference between the weights obtained with
two different mass balances, six specimens were weighed, in grams, on each balance. The following data
were obtained: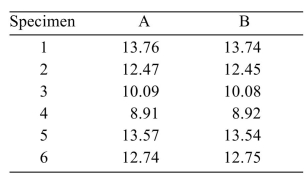 Can you conclude that the mean weight differs between the two balances?
i). State the null and alternative hypotheses.
ii). Compute the test statistic.
iii). State a conclusion using the level of significance.
two different mass balances, six specimens were weighed, in grams, on each balance. The following data
were obtained:
Can you conclude that the mean weight differs between the two balances?i). State the null and alternative hypotheses.
ii). Compute the test statistic.
iii). State a conclusion using the
level of significance. سؤال
The following MINITAB output display presents the results of a hypothesis test on the difference between two proportions. 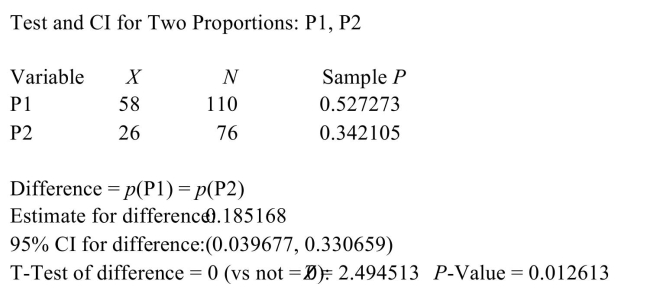 What is the P-value?
A) 0.527273
B) 0.4516129
C) 0.012613
D) 2.494513
What is the P-value?A) 0.527273
B) 0.4516129
C) 0.012613
D) 2.494513
سؤال
A) No
B) Yes
سؤال
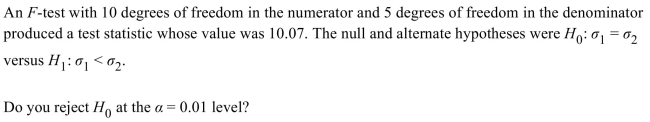
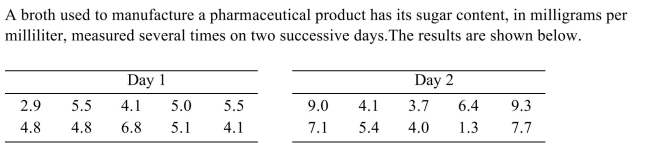 Can you conclude that the variability of the process is greater on the second day than on the first day? Use the
  level of significance.
A) No
B) Yes
سؤال
The following display from a TI-84 Plus calculator presents the results of a hypothesis test for the difference between two proportions. The sample sizes are 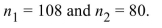

A) No
B) Yes
A) No
B) Yes
سؤال
A) Yes
B) No
سؤال
A) -1.222
B) -0.984
C) -0.547
D) -2.452
سؤال
In an experiment to determine whether there is a systematic difference between the weights obtained with two different mass balances, six specimens were weighed, in grams, on each balance. The following data
Were obtained: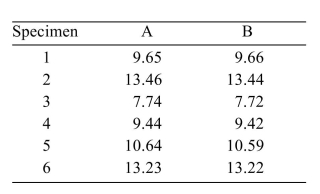 State the null and alternate hypotheses.
A)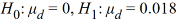
B)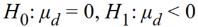
C)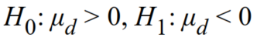
D)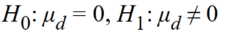
Were obtained:
State the null and alternate hypotheses. A)
B)
C)
D)
سؤال
The football coach at State University wishes to determine if there is a decrease in offensive production between the first half and the second half of his team's recent games. The table below
Shows the first-half and second-half offensive production (measured in total yards gained per half)
For the past six games.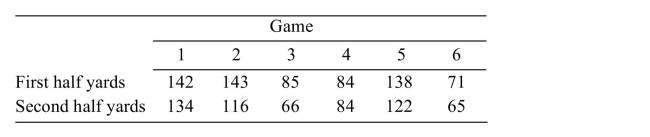 Compute the test statistic.
A) 9.895
B) 2.881
C) 1.288
D) 3.165
Shows the first-half and second-half offensive production (measured in total yards gained per half)
For the past six games.
Compute the test statistic.A) 9.895
B) 2.881
C) 1.288
D) 3.165
سؤال
The following MINITAB output display presents the results of a hypothesis test on the difference between two proportions. 
A) No
B) Yes
A) No
B) Yes
سؤال
The bowling scores of a professional bowler during a two-day tournament are shown below. 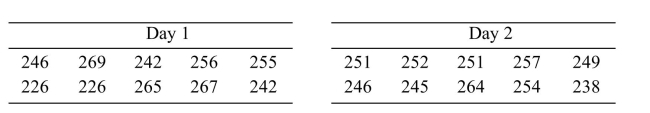 Can you conclude that the variability of the scores is greater on the second day than on the first day? Use the
  level of significance.
A) No
B) Yes
Can you conclude that the variability of the scores is greater on the second day than on the first day? Use the level of significance.A) No
B) Yes
سؤال
The following display from a TI-84 Plus calculator presents the results of a hypothesis test for the difference between two proportions. The sample sizes are 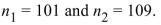
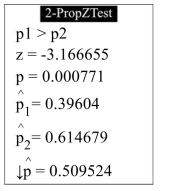 What is the P-value?
A) 0.509524
B) 0.39604
C) 0.000771
D) -3.166655
What is the P-value?A) 0.509524
B) 0.39604
C) 0.000771
D) -3.166655
سؤال
A sociologist studies a sample of college students to determine whether there are differences in the attitudes and behaviors of male and female students. The survey contains 20 questions. For one
Question, which asks how much time students spend studying each week, the difference between
Males and females is statistically significant with a P-value of 0.005. On all the other questions, the
Differences are not statistically significant.
What P-value would be needed to conclude at the el that the time spent studying differs
Between male and female students after applying the Bonferroni correction?
A) 1.0000
B) 0.0025
C) 0.0003
D) 0.1000
Question, which asks how much time students spend studying each week, the difference between
Males and females is statistically significant with a P-value of 0.005. On all the other questions, the
Differences are not statistically significant.
What P-value would be needed to conclude at the
el that the time spent studying differsBetween male and female students after applying the Bonferroni correction?
A) 1.0000
B) 0.0025
C) 0.0003
D) 0.1000
سؤال
Four null hypotheses were tested, and the P-values were: 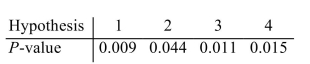 Which hypotheses, if any, can be rejected at the
  05 level?
A) All of them
B) 1, 3
C) None of them
D) 3
Which hypotheses, if any, can be rejected at the 05 level?A) All of them
B) 1, 3
C) None of them
D) 3
سؤال
Five null hypotheses were tested, and the P-values were: 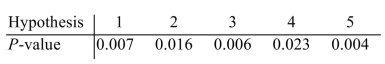 Which hypotheses, if any, can be rejected at the
  05 level?
A) none of them
B) 2, 4
C) 1, 3, 5
D) all of them
Which hypotheses, if any, can be rejected at the 05 level?A) none of them
B) 2, 4
C) 1, 3, 5
D) all of them

فتح الحزمة
قم بالتسجيل لفتح البطاقات في هذه المجموعة!
Unlock Deck
Unlock Deck
1/43
العب
ملء الشاشة (f)
Deck 11: Two-Sample Hypothesis Tests
1
A study reported that in a sample of 93 men, 23 had elevated total cholesterol levels (more than 200 milligrams per deciliter). In a sample of 104 women, 21 had elevated cholesterol levels.
Can you conclude that the proportion of people with elevated cholesterol levels differs between men and
Women? Use the level of significance.
A) Yes
B) No
Can you conclude that the proportion of people with elevated cholesterol levels differs between men and
Women? Use the
level of significance.A) Yes
B) No
No
2
In a random sample of 370 cars driven at low altitudes, 43 of them exceeded a standard of 10 grams of particulate pollution per gallon of fuel consumed. In an independent random sample of 80 cars
Driven at high altitudes, 23 of them exceeded the standard. Can you conclude that the proportion of
High-altitude vehicles exceeding the standard is greater than the proportion of low-altitude vehicles
Exceeding the standard at an level of significance?
A) No
B) Yes
Driven at high altitudes, 23 of them exceeded the standard. Can you conclude that the proportion of
High-altitude vehicles exceeding the standard is greater than the proportion of low-altitude vehicles
Exceeding the standard at an
level of significance?A) No
B) Yes
Yes
3
Compute the value of the test statistic.A) 3.07
B) 2.83
C) 2.94
D) 2.91
2.83
4
The following MINITAB output display presents the results of a hypothesis test for the difference between two population means. How many degrees of freedom are there for the test statistic?
A) 10.373
B) 12
C) 1.593507
D) 13
between two population means. How many degrees of freedom are there for the test statistic?A) 10.373
B) 12
C) 1.593507
D) 13
فتح الحزمة
افتح القفل للوصول البطاقات البالغ عددها 43 في هذه المجموعة.
فتح الحزمة
k this deck
5
The following display from a TI-84 Plus calculator presents the results of a hypothesis test for the difference between two means. The sample sizes are What is the P-value?
A) 0.995977
B) 11.007289
C) 0.004023
D) 3.171571
What is the P-value?A) 0.995977
B) 11.007289
C) 0.004023
D) 3.171571
فتح الحزمة
افتح القفل للوصول البطاقات البالغ عددها 43 في هذه المجموعة.
فتح الحزمة
k this deck
6
Compute the value of the test statistic.A) 5.132
B) 0.937
C) 7.357
D) 3.4
فتح الحزمة
افتح القفل للوصول البطاقات البالغ عددها 43 في هذه المجموعة.
فتح الحزمة
k this deck
7
In an agricultural experiment, the effects of two fertilizers on the production of oranges were measured. Fourteen randomly selected plots of land were treated with fertilizer A, and 10 randomly
Selected plots were treated with fertilizer B. The number of pounds of harvested fruit was measured
From each plot. Following are the results. Assume that the populations are approximately normal. Can you conclude that there is a difference in the
Mean yields for the two types of fertilizer? Use the level of significance.
A) Yes
B) No
Selected plots were treated with fertilizer B. The number of pounds of harvested fruit was measured
From each plot. Following are the results.
Assume that the populations are approximately normal. Can you conclude that there is a difference in theMean yields for the two types of fertilizer? Use the
level of significance.A) Yes
B) No
فتح الحزمة
افتح القفل للوصول البطاقات البالغ عددها 43 في هذه المجموعة.
فتح الحزمة
k this deck
8
Are low-fat diets or low-carb diets more effective for weight loss? A sample of 70 subjects went on
a low-carbohydrate diet for six months. At the end of that time, the sample mean weight loss was
10.5 pounds with a sample standard deviation of 7.09 pounds. A second sample of 76 subjects went
on a low-fat diet. Their sample mean weight loss was 18.0 with a standard deviation of 7.26. Can
you conclude that the mean weight loss differed between the two diets? Use the level.
i). State the appropriate null and alternate hypotheses.
ii). Compute the test statistic.
iii). How many degrees of freedom are there, using the simple method?
iv). Do you reject H0 ? State a conclusion.
a low-carbohydrate diet for six months. At the end of that time, the sample mean weight loss was
10.5 pounds with a sample standard deviation of 7.09 pounds. A second sample of 76 subjects went
on a low-fat diet. Their sample mean weight loss was 18.0 with a standard deviation of 7.26. Can
you conclude that the mean weight loss differed between the two diets? Use the
level.i). State the appropriate null and alternate hypotheses.
ii). Compute the test statistic.
iii). How many degrees of freedom are there, using the simple method?
iv). Do you reject H0 ? State a conclusion.
فتح الحزمة
افتح القفل للوصول البطاقات البالغ عددها 43 في هذه المجموعة.
فتح الحزمة
k this deck
9
Is rejected at the 0.05 level? (Hint: First compute the value of the test statistic.)A) No
B) Yes
فتح الحزمة
افتح القفل للوصول البطاقات البالغ عددها 43 في هذه المجموعة.
فتح الحزمة
k this deck
10
The following display from a TI-84 Plus calculator presents the results of a hypothesis test for the difference between two means. The sample sizes are
A) No
B) Yes
A) No
B) Yes
فتح الحزمة
افتح القفل للوصول البطاقات البالغ عددها 43 في هذه المجموعة.
فتح الحزمة
k this deck
11
The following MINITAB output display presents the results of a hypothesis test for the difference between two population means.
What is the alternate hypothesis?
A)
B)
C)
D)
between two population means. What is the alternate hypothesis?
A)
B)
C)
D)
فتح الحزمة
افتح القفل للوصول البطاقات البالغ عددها 43 في هذه المجموعة.
فتح الحزمة
k this deck
12
How many degrees of freedom are there for the test statistic, using the simple method?A) 15
B) 16
C) 13
D) 17
فتح الحزمة
افتح القفل للوصول البطاقات البالغ عددها 43 في هذه المجموعة.
فتح الحزمة
k this deck
13
The following display from a TI-84 Plus calculator presents the results of a hypothesis test for the difference between two means. The sample sizes are How many degrees of freedom did the calculator use?
A) 16.933567
B) 15.933567
C) 0.001964
D) -3.366473
How many degrees of freedom did the calculator use?A) 16.933567
B) 15.933567
C) 0.001964
D) -3.366473
فتح الحزمة
افتح القفل للوصول البطاقات البالغ عددها 43 في هذه المجموعة.
فتح الحزمة
k this deck
14
The concentration of hexane (a common solvent) was measured in units of micrograms per liter for a simple random sample of nineteen specimens of untreated ground water taken near a municipal
Landfill. The sample mean was 289.2 with a sample standard deviation of 6.3. Twenty-two
Specimens of treated ground water had an average hexane concentration of 285.3 with a standard
Deviation of 7.6.
It is reasonable to assume that both samples come from populations that are approximately normal. Can you
Conclude that the mean hexane concentration is less in treated water than in untreated water? Use the α =
Level of significance.
A) Yes
B) No
فتح الحزمة
افتح القفل للوصول البطاقات البالغ عددها 43 في هذه المجموعة.
فتح الحزمة
k this deck
15
A study reported that in a sample of 109 people who watch television news, 37 had elevated diastolic blood pressure levels (in millimeters of mercury, or mmHg). In a sample of 76 people who
Do not watch television news, 12 had elevated diastolic blood pressure levels.
Can you conclude that the proportion of people with elevated diastolic blood pressure levels differs between
News-watchers and those who do not watch news? Use the level of significance.
A) No
B) Yes
Do not watch television news, 12 had elevated diastolic blood pressure levels.
Can you conclude that the proportion of people with elevated diastolic blood pressure levels differs between
News-watchers and those who do not watch news? Use the
level of significance.A) No
B) Yes
فتح الحزمة
افتح القفل للوصول البطاقات البالغ عددها 43 في هذه المجموعة.
فتح الحزمة
k this deck
16
An automobile manufacturer wishes to test that claim that synthetic motor oil can improve gas mileage (in miles per gallon, or mpg). The table below shows the gas mileages, in mpg, of six cars
That used synthetic motor oil. The table also shows the gas mileages in mpg of six cars that were
Using conventional motor oil (the controls). Can you conclude that the mean gas mileage for cars using synthetic motor oil is more than
The mean for the controls? Use the level of significance.
A) No
B) Yes
That used synthetic motor oil. The table also shows the gas mileages in mpg of six cars that were
Using conventional motor oil (the controls).
Can you conclude that the mean gas mileage for cars using synthetic motor oil is more thanThe mean for the controls? Use the
level of significance.A) No
B) Yes
فتح الحزمة
افتح القفل للوصول البطاقات البالغ عددها 43 في هذه المجموعة.
فتح الحزمة
k this deck
17
A garden seed wholesaler wishes to test the claim that tomato seeds germinate faster when each individual seed is "pelletized" within a coating of corn starch. The table below shows the
Germination times, in days, of six pelletized seeds. The table also shows the germination times in
Days of six un-coated seeds (the controls). Can you conclude that the mean germination time for pelletized seeds is less than the mean
For the un-pelletized seeds? Use the level of significance.
A) Yes
B) No
Germination times, in days, of six pelletized seeds. The table also shows the germination times in
Days of six un-coated seeds (the controls).
Can you conclude that the mean germination time for pelletized seeds is less than the meanFor the un-pelletized seeds? Use the
level of significance.A) Yes
B) No
فتح الحزمة
افتح القفل للوصول البطاقات البالغ عددها 43 في هذه المجموعة.
فتح الحزمة
k this deck
18
The following MINITAB output display presents the results of a hypothesis test for the difference between two population means.
A) No
B) Yes
between two population means. A) No
B) Yes
فتح الحزمة
افتح القفل للوصول البطاقات البالغ عددها 43 في هذه المجموعة.
فتح الحزمة
k this deck
19
An amateur golfer wishes to determine if there is a difference between the drive distances of her two favorite drivers. (A driver is a specialized club for driving the golf ball down range.) She hits fourteen balls
With driver A and 10 balls with driver B. The drive distances (in yards) for the trials are show below. Assume that the populations are approximately normal. Can you conclude that there is a difference in the
Mean drive distances for the two drivers? Use the level of significance.
A) Yes
B) No
With driver A and 10 balls with driver B. The drive distances (in yards) for the trials are show below.
Assume that the populations are approximately normal. Can you conclude that there is a difference in theMean drive distances for the two drivers? Use the
level of significance.A) Yes
B) No
فتح الحزمة
افتح القفل للوصول البطاقات البالغ عددها 43 في هذه المجموعة.
فتح الحزمة
k this deck
20
A) Yes
B) No
فتح الحزمة
افتح القفل للوصول البطاقات البالغ عددها 43 في هذه المجموعة.
فتح الحزمة
k this deck
21
In an experiment to determine whether there is a systematic difference between the weights obtained with two different mass balances, six specimens were weighed, in grams, on each balance. The following data
Were obtained: Compute the test statistic.
A) 1.083
B) 2.433
C) 2.666
D) 0.313
Were obtained:
Compute the test statistic.A) 1.083
B) 2.433
C) 2.666
D) 0.313
فتح الحزمة
افتح القفل للوصول البطاقات البالغ عددها 43 في هذه المجموعة.
فتح الحزمة
k this deck
22
The football coach at State University wishes to determine if there is a decrease in offensive production between the first half and the second half of his team's recent games. The table below
Shows the first-half and second-half offensive production (measured in total yards gained per half)
For the past six games.
State a conclusion using the level of significance.
A) Do not reject H0. There is insufficient evidence to conclude that the mean offensive production decreases from the first to the second half.
B) Reject H0. The mean offensive production appears to decrease from the first half to the second half.
Shows the first-half and second-half offensive production (measured in total yards gained per half)
For the past six games.
State a conclusion using the
level of significance.A) Do not reject H0. There is insufficient evidence to conclude that the mean offensive production decreases from the first to the second half.
B) Reject H0. The mean offensive production appears to decrease from the first half to the second half.
فتح الحزمة
افتح القفل للوصول البطاقات البالغ عددها 43 في هذه المجموعة.
فتح الحزمة
k this deck
23
The following MINITAB output display presents the results of a hypothesis test on the difference between two proportions. Is this a left-tailed test, a right-tailed test, or a two tailed test?
A) Left-tailed test
B) Two-tailed test
C) Right-tailed test
Is this a left-tailed test, a right-tailed test, or a two tailed test?A) Left-tailed test
B) Two-tailed test
C) Right-tailed test
فتح الحزمة
افتح القفل للوصول البطاقات البالغ عددها 43 في هذه المجموعة.
فتح الحزمة
k this deck
24
The following display from a TI-84 Plus calculator presents the results of a hypothesis test for the difference between two proportions. The sample sizes are Is this a left-tailed test, a right-tailed test, or a two-tailed test?
A) Two-tailed test
B) Left-tailed test
C) Right-tailed test
Is this a left-tailed test, a right-tailed test, or a two-tailed test?A) Two-tailed test
B) Left-tailed test
C) Right-tailed test
فتح الحزمة
افتح القفل للوصول البطاقات البالغ عددها 43 في هذه المجموعة.
فتح الحزمة
k this deck
25
The football coach at State University wishes to determine if there is a change in offensive production between the first half and the second half of his team's recent games. The table below
Shows the first-half and second-half offensive production (measured in total yards gained per half)
For the past six games. State the null and alternative hypotheses.
A)
B)
C)
D)
Shows the first-half and second-half offensive production (measured in total yards gained per half)
For the past six games.
State the null and alternative hypotheses. A)
B)
C)
D)
فتح الحزمة
افتح القفل للوصول البطاقات البالغ عددها 43 في هذه المجموعة.
فتح الحزمة
k this deck
26
Find the critical value
A) 3.71
B) 2.73
C) 2.54
D) 3.36
A) 3.71
B) 2.73
C) 2.54
D) 3.36
فتح الحزمة
افتح القفل للوصول البطاقات البالغ عددها 43 في هذه المجموعة.
فتح الحزمة
k this deck
27
The football coach at State University wishes to determine if there is a decrease in offensive
production between the first half and the second half of his team's recent games. The table below
shows the first-half and second-half offensive production (measured in total yards gained per half)
for the past six games.
Can you conclude that the mean offensive production in the first half differed from that of the seconc i). State the null and alternative hypotheses.
ii). Compute the test statistic.
iii). State a conclusion using the=0.02 level of significance.
production between the first half and the second half of his team's recent games. The table below
shows the first-half and second-half offensive production (measured in total yards gained per half)
for the past six games.
Can you conclude that the mean offensive production in the first half differed from that of the seconc i). State the null and alternative hypotheses.
ii). Compute the test statistic.
iii). State a conclusion using the
=0.02 level of significance. فتح الحزمة
افتح القفل للوصول البطاقات البالغ عددها 43 في هذه المجموعة.
فتح الحزمة
k this deck
28
In an experiment to determine whether there is a systematic difference between the weights obtained with two different mass balances, six specimens were weighed, in grams, on each balance. The following data
Were obtained: State a conclusion using the level of significance.
A) Do not reject . There is insufficient evidence to conclude that the mean
Difference differs from zero.
B) Reject . The mean difference appears to differ from zero.
Were obtained:
State a conclusion using the level of significance.A) Do not reject
. There is insufficient evidence to conclude that the meanDifference differs from zero.
B) Reject
. The mean difference appears to differ from zero. فتح الحزمة
افتح القفل للوصول البطاقات البالغ عددها 43 في هذه المجموعة.
فتح الحزمة
k this deck
29
In an experiment to determine whether there is a systematic difference between the weights obtained with
two different mass balances, six specimens were weighed, in grams, on each balance. The following data
were obtained: Can you conclude that the mean weight differs between the two balances?
i). State the null and alternative hypotheses.
ii). Compute the test statistic.
iii). State a conclusion using the level of significance.
two different mass balances, six specimens were weighed, in grams, on each balance. The following data
were obtained:
Can you conclude that the mean weight differs between the two balances?i). State the null and alternative hypotheses.
ii). Compute the test statistic.
iii). State a conclusion using the
level of significance. فتح الحزمة
افتح القفل للوصول البطاقات البالغ عددها 43 في هذه المجموعة.
فتح الحزمة
k this deck
30
The following MINITAB output display presents the results of a hypothesis test on the difference between two proportions. What is the P-value?
A) 0.527273
B) 0.4516129
C) 0.012613
D) 2.494513
What is the P-value?A) 0.527273
B) 0.4516129
C) 0.012613
D) 2.494513
فتح الحزمة
افتح القفل للوصول البطاقات البالغ عددها 43 في هذه المجموعة.
فتح الحزمة
k this deck
31
A) No
B) Yes
فتح الحزمة
افتح القفل للوصول البطاقات البالغ عددها 43 في هذه المجموعة.
فتح الحزمة
k this deck
32
Can you conclude that the variability of the process is greater on the second day than on the first day? Use the level of significance.A) No
B) Yes
فتح الحزمة
افتح القفل للوصول البطاقات البالغ عددها 43 في هذه المجموعة.
فتح الحزمة
k this deck
33
The following display from a TI-84 Plus calculator presents the results of a hypothesis test for the difference between two proportions. The sample sizes are
A) No
B) Yes
A) No
B) Yes
فتح الحزمة
افتح القفل للوصول البطاقات البالغ عددها 43 في هذه المجموعة.
فتح الحزمة
k this deck
34
A) Yes
B) No
فتح الحزمة
افتح القفل للوصول البطاقات البالغ عددها 43 في هذه المجموعة.
فتح الحزمة
k this deck
35
A) -1.222
B) -0.984
C) -0.547
D) -2.452
فتح الحزمة
افتح القفل للوصول البطاقات البالغ عددها 43 في هذه المجموعة.
فتح الحزمة
k this deck
36
In an experiment to determine whether there is a systematic difference between the weights obtained with two different mass balances, six specimens were weighed, in grams, on each balance. The following data
Were obtained: State the null and alternate hypotheses.
A)
B)
C)
D)
Were obtained:
State the null and alternate hypotheses. A)
B)
C)
D)
فتح الحزمة
افتح القفل للوصول البطاقات البالغ عددها 43 في هذه المجموعة.
فتح الحزمة
k this deck
37
The football coach at State University wishes to determine if there is a decrease in offensive production between the first half and the second half of his team's recent games. The table below
Shows the first-half and second-half offensive production (measured in total yards gained per half)
For the past six games. Compute the test statistic.
A) 9.895
B) 2.881
C) 1.288
D) 3.165
Shows the first-half and second-half offensive production (measured in total yards gained per half)
For the past six games.
Compute the test statistic.A) 9.895
B) 2.881
C) 1.288
D) 3.165
فتح الحزمة
افتح القفل للوصول البطاقات البالغ عددها 43 في هذه المجموعة.
فتح الحزمة
k this deck
38
The following MINITAB output display presents the results of a hypothesis test on the difference between two proportions.
A) No
B) Yes
A) No
B) Yes
فتح الحزمة
افتح القفل للوصول البطاقات البالغ عددها 43 في هذه المجموعة.
فتح الحزمة
k this deck
39
The bowling scores of a professional bowler during a two-day tournament are shown below. Can you conclude that the variability of the scores is greater on the second day than on the first day? Use the level of significance.
A) No
B) Yes
Can you conclude that the variability of the scores is greater on the second day than on the first day? Use the level of significance.A) No
B) Yes
فتح الحزمة
افتح القفل للوصول البطاقات البالغ عددها 43 في هذه المجموعة.
فتح الحزمة
k this deck
40
The following display from a TI-84 Plus calculator presents the results of a hypothesis test for the difference between two proportions. The sample sizes are What is the P-value?
A) 0.509524
B) 0.39604
C) 0.000771
D) -3.166655
What is the P-value?A) 0.509524
B) 0.39604
C) 0.000771
D) -3.166655
فتح الحزمة
افتح القفل للوصول البطاقات البالغ عددها 43 في هذه المجموعة.
فتح الحزمة
k this deck
41
A sociologist studies a sample of college students to determine whether there are differences in the attitudes and behaviors of male and female students. The survey contains 20 questions. For one
Question, which asks how much time students spend studying each week, the difference between
Males and females is statistically significant with a P-value of 0.005. On all the other questions, the
Differences are not statistically significant.
What P-value would be needed to conclude at the el that the time spent studying differs
Between male and female students after applying the Bonferroni correction?
A) 1.0000
B) 0.0025
C) 0.0003
D) 0.1000
Question, which asks how much time students spend studying each week, the difference between
Males and females is statistically significant with a P-value of 0.005. On all the other questions, the
Differences are not statistically significant.
What P-value would be needed to conclude at the
el that the time spent studying differsBetween male and female students after applying the Bonferroni correction?
A) 1.0000
B) 0.0025
C) 0.0003
D) 0.1000
فتح الحزمة
افتح القفل للوصول البطاقات البالغ عددها 43 في هذه المجموعة.
فتح الحزمة
k this deck
42
Four null hypotheses were tested, and the P-values were: Which hypotheses, if any, can be rejected at the 05 level?
A) All of them
B) 1, 3
C) None of them
D) 3
Which hypotheses, if any, can be rejected at the 05 level?A) All of them
B) 1, 3
C) None of them
D) 3
فتح الحزمة
افتح القفل للوصول البطاقات البالغ عددها 43 في هذه المجموعة.
فتح الحزمة
k this deck
43
Five null hypotheses were tested, and the P-values were: Which hypotheses, if any, can be rejected at the 05 level?
A) none of them
B) 2, 4
C) 1, 3, 5
D) all of them
Which hypotheses, if any, can be rejected at the 05 level?A) none of them
B) 2, 4
C) 1, 3, 5
D) all of them
فتح الحزمة
افتح القفل للوصول البطاقات البالغ عددها 43 في هذه المجموعة.
فتح الحزمة
k this deck
فتح الحزمة
افتح القفل للوصول البطاقات البالغ عددها 43 في هذه المجموعة.


