Deck 4: Displaying and Describing Categorical Data
ملء الشاشة (f)
سؤال
A full service brokerage firm gathered information on how their clients were investing
for retirement.Based on age, clients were categorized according to where the largest
percentage of their retirement portfolio was invested.The table below summarized the
data.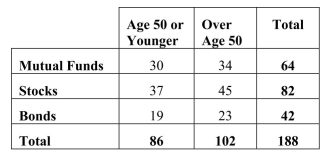
Find each of the following percentages.
a.What percent of the clients are over age 50 who invests in mutual funds?
b.What percent of clients over age 50 invest in mutual funds?
c.What percent of the mutual fund investors are over age 50?
سؤال
A full service brokerage firm gathered information on how their clients were investing for retirement.Based on age, clients were categorized according to where the largest
Percentage of their retirement portfolio was invested and shown in the table below.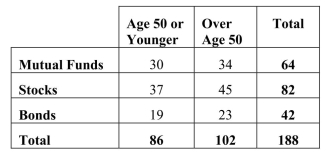 4-14 Chapter 4 Displaying and Describing Categorical Data
Of the clients over age 50, the percentage who invest in mutual funds is
A)3.1% (34/64).
B)33.3% (34/102).
C)18.1% (34/188).
D)34% (64/188).
E)54.3% (102/188).
Percentage of their retirement portfolio was invested and shown in the table below.
4-14 Chapter 4 Displaying and Describing Categorical DataOf the clients over age 50, the percentage who invest in mutual funds is
A)3.1% (34/64).
B)33.3% (34/102).
C)18.1% (34/188).
D)34% (64/188).
E)54.3% (102/188).
سؤال
سؤال
A automobile marketing firm conducts a study to see what types of cars people owned before buying an American car.The results are shown below. 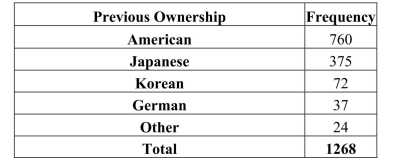 The relative frequency of those who owned Japanese cars previously who now bought
American cars is
A)59.9 %
B)29.6%
C)5.7%
D)14.9%
E)2.9%
The relative frequency of those who owned Japanese cars previously who now boughtAmerican cars is
A)59.9 %
B)29.6%
C)5.7%
D)14.9%
E)2.9%
سؤال
سؤال
A full service brokerage firm gathered information on how their clients were investing for retirement.Based on age, clients were categorized according to where the largest
Percentage of their retirement portfolio was invested and shown in the table below.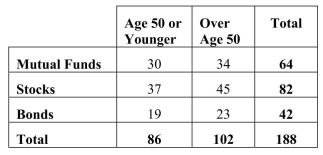 The percentage of clients who are over age 50 and invest in mutual funds is
A)3.1% (34/64).
B)33.3% (34/102).
C)18.1% (34/188).
D)34% (64/188).
E)54.3% (102/188).
Percentage of their retirement portfolio was invested and shown in the table below.
The percentage of clients who are over age 50 and invest in mutual funds isA)3.1% (34/64).
B)33.3% (34/102).
C)18.1% (34/188).
D)34% (64/188).
E)54.3% (102/188).
سؤال
A full service brokerage firm gathered information on how their clients were investing
for retirement.Based on age, clients were categorized according to where the largest
percentage of their retirement portfolio was invested.The table below summarized the
data.
Identify the variables and tell whether each is categorical or quantitative.
for retirement.Based on age, clients were categorized according to where the largest
percentage of their retirement portfolio was invested.The table below summarized the
data.
Identify the variables and tell whether each is categorical or quantitative.
سؤال
A large national retailer of electronics conducted a survey to determine consumer preferences for various brands of digital cameras and the data are summarized in the table
Shown below.Of the consumers who prefer Pentax, what percentage is male?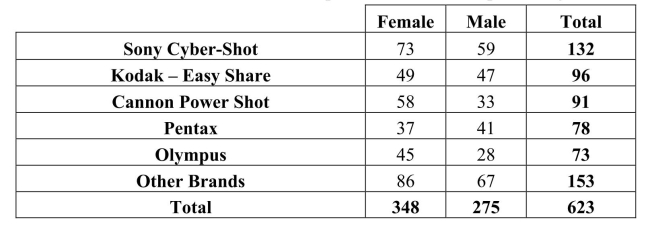
A)44.1 % (275/623).
B)6.6% (41/623).
C)52.6% (41/78).
D)14.9% (41/275).
E)12.5% (78/623).
Shown below.Of the consumers who prefer Pentax, what percentage is male?
A)44.1 % (275/623).
B)6.6% (41/623).
C)52.6% (41/78).
D)14.9% (41/275).
E)12.5% (78/623).
سؤال
A large national retailer of electronics conducted a survey to determine consumer preferences for various brands of digital cameras and the data are summarized in the table
Shown below.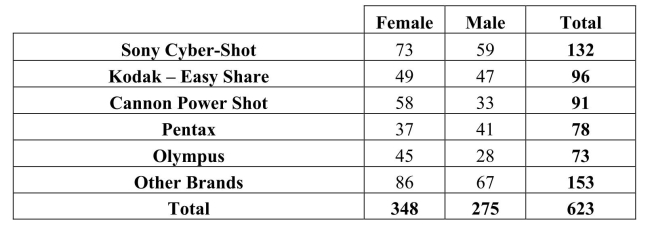 The percentage of consumers who are male and prefer Pentax is
A)44.1 % (275/623).
B)6.6% (41/623).
C)52.6% (41/78).
D)14.9% (41/275).
E)12.5% (78/623).
Shown below.
The percentage of consumers who are male and prefer Pentax isA)44.1 % (275/623).
B)6.6% (41/623).
C)52.6% (41/78).
D)14.9% (41/275).
E)12.5% (78/623).
سؤال
سؤال
The following is a bar chart summarizing consumer preferences for various brands of digital cameras. 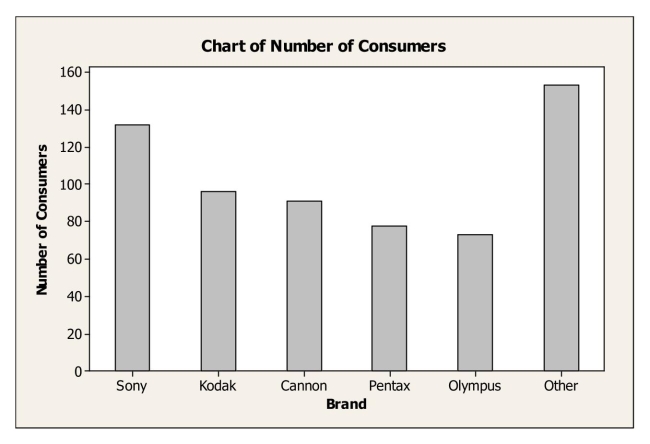
A)the marginal distribution of brands.
B)the conditional distribution of brands.
C)the contingency distribution of brands.
D)the distribution for a quantitative variable.
E)none of the above.
A)the marginal distribution of brands.
B)the conditional distribution of brands.
C)the contingency distribution of brands.
D)the distribution for a quantitative variable.
E)none of the above.
سؤال
سؤال
سؤال
سؤال
سؤال
A full service brokerage firm gathered information on how their clients were investing
for retirement.Based on age, clients were categorized according to where the largest
percentage of their retirement portfolio was invested.The table below summarized the
data.
What is the marginal distribution of age?
for retirement.Based on age, clients were categorized according to where the largest
percentage of their retirement portfolio was invested.The table below summarized the
data.
What is the marginal distribution of age?
سؤال
A large national retailer of electronics conducted a survey to determine consumer preferences for various brands of digital cameras and the data are summarized in the table
Shown below. Of the consumers who are male, the percentage who prefer Pentax is
A)44.1 % (275/623).
B)6.6% (41/623).
C)52.6% (41/78).
D)14.9% (41/275).
E)12.5% (78/623).
Shown below.
Of the consumers who are male, the percentage who prefer Pentax isA)44.1 % (275/623).
B)6.6% (41/623).
C)52.6% (41/78).
D)14.9% (41/275).
E)12.5% (78/623).
سؤال
Based on the side-by-side bar chart summarizing consumer preferences for various brands of digital cameras by gender, which of the following statements is (are) true? 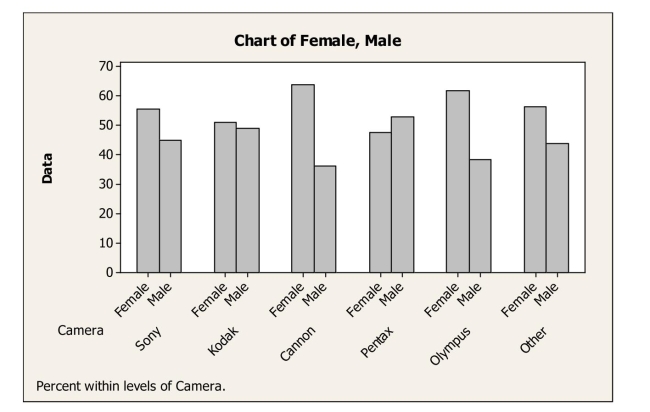
A)It appears that camera preference and gender are not related.
B)It appears that camera preference and gender are not independent.
C)It appears that camera preference and gender are independent.
D)More males than females prefer Cannon.
E)More females than males prefer Pentax.
A)It appears that camera preference and gender are not related.
B)It appears that camera preference and gender are not independent.
C)It appears that camera preference and gender are independent.
D)More males than females prefer Cannon.
E)More females than males prefer Pentax.
سؤال
Consider the following side by side bar chart for the data above: 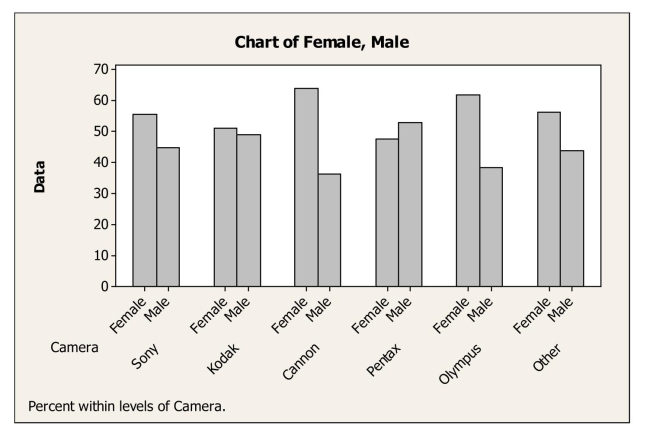 Does the chart indicate that brand preference is independent of gender? Explain.
Does the chart indicate that brand preference is independent of gender? Explain. سؤال
Consider the following side by side bar chart for the data above: 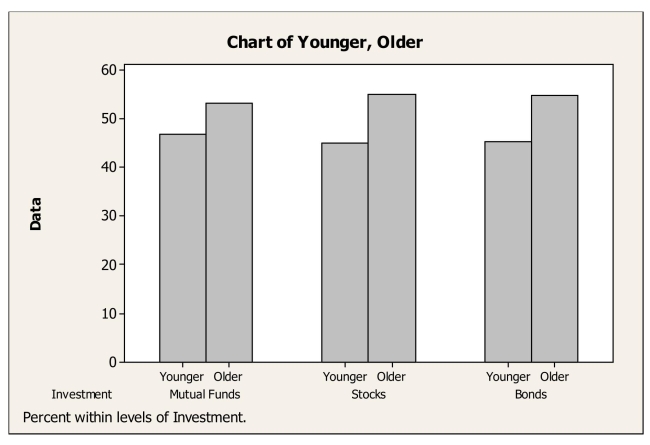 Does the chart indicate that mode of investment is independent of age? Explain.
Does the chart indicate that mode of investment is independent of age? Explain. سؤال
A regional survey was carried out to gauge public opinion on the controversial Arizona Immigration Law (results shown below).What percent oppose the law? 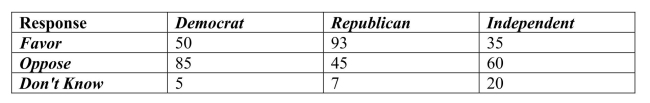
A)48%
B)45%
C)32%
D)25%
E)61%
A)48%
B)45%
C)32%
D)25%
E)61%
سؤال
A full service brokerage firm gathered information on how their clients were investing for retirement.Based on age, clients were categorized according to where the
Largest percentage of their retirement portfolio was invested and shown in the table
Below.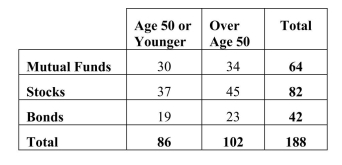
A)3.1% (34/64).
B)33.3% (34/102).
C)18.1% (34/188).
D)34% (64/188).
E)54.3% (102/188).
Largest percentage of their retirement portfolio was invested and shown in the table
Below.
A)3.1% (34/64).
B)33.3% (34/102).
C)18.1% (34/188).
D)34% (64/188).
E)54.3% (102/188).
سؤال
A full service brokerage firm gathered information on how their clients were investing for retirement.Based on age, clients were categorized according to where the largest
Percentage of their retirement portfolio was invested and shown in the table below.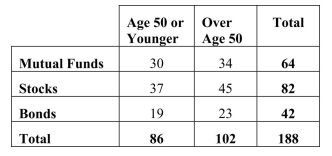 Of the clients who invest in mutual funds, the percentage over age 50 is
A)53.1% (34/64).
B)33.3% (34/102).
C)18.1% (34/188).
D)34% (64/188).
E)54.3% (102/188).
Percentage of their retirement portfolio was invested and shown in the table below.
Of the clients who invest in mutual funds, the percentage over age 50 isA)53.1% (34/64).
B)33.3% (34/102).
C)18.1% (34/188).
D)34% (64/188).
E)54.3% (102/188).
سؤال
A regional survey was carried out to gauge public opinion on the controversial Arizona Immigration Law.Based on the results displayed in the table below, what
Percent of respondents is Independent?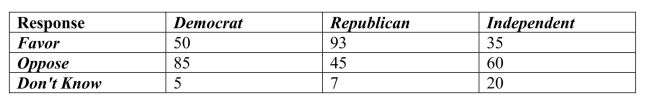
A)35%
B)9%
C)29%
D)45%
E)25%
Percent of respondents is Independent?
A)35%
B)9%
C)29%
D)45%
E)25%
سؤال
A regional survey was carried out to gauge public opinion on the controversial Arizona Immigration Law (results shown below).Of respondents who are Democrat,
What percent oppose the law?
A)13%
B)35%
C)22%
D)45%
E)61%
What percent oppose the law?
A)13%
B)35%
C)22%
D)45%
E)61%
سؤال
سؤال
Here is a pie chart for data collected about clients of brokerage firm. 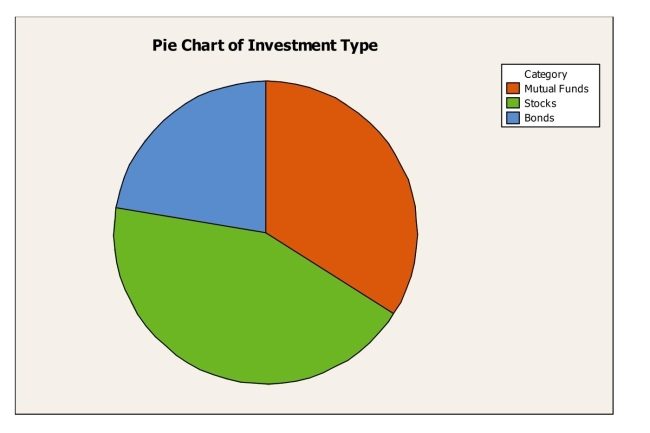 The pie chart shows
A)the distribution of a quantitative variable.
B)the contingency distribution of investment type.
C)the conditional distribution of investment type.
D)the marginal distribution of investment type.
E)the joint distribution of investment type.
The pie chart showsA)the distribution of a quantitative variable.
B)the contingency distribution of investment type.
C)the conditional distribution of investment type.
D)the marginal distribution of investment type.
E)the joint distribution of investment type.
سؤال
A restaurant uses comment cards to get feedback from its customers about newly added items to the menu.It recently introduced homemade organic veggie burgers.
Customers who tried the new burger were asked if they would order it again.The data
Are summarized in the table below.What percentage of customers would most likely or
Definitely order the veggie burger again?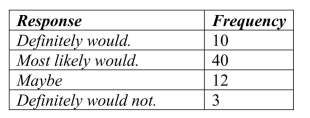
A)10%
B)15%
C)40%
D)50%
E)77%
Customers who tried the new burger were asked if they would order it again.The data
Are summarized in the table below.What percentage of customers would most likely or
Definitely order the veggie burger again?
A)10%
B)15%
C)40%
D)50%
E)77%
سؤال
A regional survey was carried out to gauge public opinion on the controversial Arizona Immigration Law.The results are displayed in the segmented bar chart below.
Which of the following statements is true?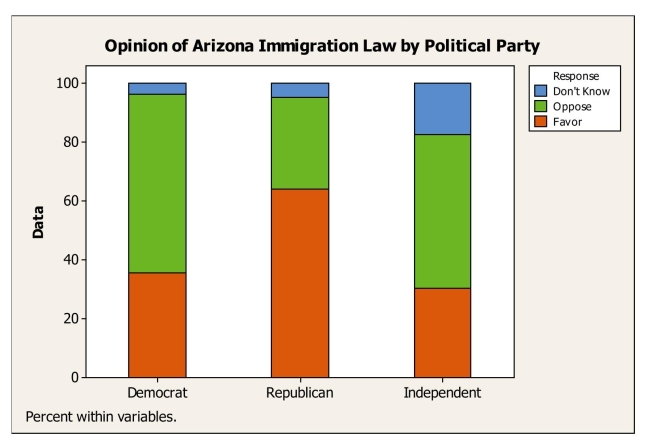
A)A greater percentage of Republicans oppose the law compared to Democrats.
B)A greater percentage of Republicans oppose the law compared to Independents.
C)Opinion about the law appears to be independent of political party affiliation.
D)A greater percentage of Democrats oppose the law compared to Republicans.
E)The segmented bar chart is not appropriate for these data.
سؤال
A restaurant uses comment cards to get feedback from its customers about newly added items to the menu.It recently introduced homemade organic veggie burgers.
Customers who tried the new burger were asked if they would order it again.The data
Are summarized in the table below.What percentage of customers would definitely order
The veggie burger again?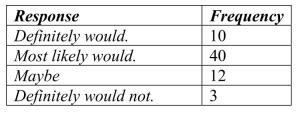
A)10%
B)15%
C)20%
D)40%
E)77%
Customers who tried the new burger were asked if they would order it again.The data
Are summarized in the table below.What percentage of customers would definitely order
The veggie burger again?
A)10%
B)15%
C)20%
D)40%
E)77%
سؤال
A regional survey was carried out to gauge public opinion on the controversial Arizona Immigration Law (results shown below).Of respondents who oppose the law,
What percent is Democrat?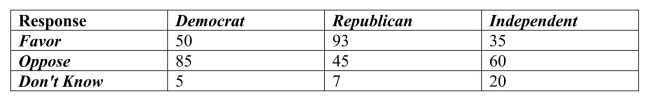
A)13%
B)35%
C)22%
D)45%
E)61%
What percent is Democrat?
A)13%
B)35%
C)22%
D)45%
E)61%
سؤال
A regional survey was carried out to gauge public opinion on the controversial Arizona Immigration Law (results shown below).How many respondents are
Republican and favor the law?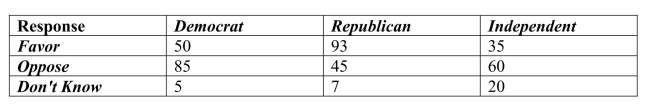
A)93
B)45
C)145
D)7
E)85
Republican and favor the law?
A)93
B)45
C)145
D)7
E)85

فتح الحزمة
قم بالتسجيل لفتح البطاقات في هذه المجموعة!
Unlock Deck
Unlock Deck
1/32
العب
ملء الشاشة (f)
Deck 4: Displaying and Describing Categorical Data
1
A full service brokerage firm gathered information on how their clients were investing
for retirement.Based on age, clients were categorized according to where the largest
percentage of their retirement portfolio was invested.The table below summarized the
data.
Find each of the following percentages.
a.What percent of the clients are over age 50 who invests in mutual funds?
b.What percent of clients over age 50 invest in mutual funds?
c.What percent of the mutual fund investors are over age 50?
a.18.1% (34/188)
b.33.3% (34/102)
c.53.1% (34/64)
b.33.3% (34/102)
c.53.1% (34/64)
2
A full service brokerage firm gathered information on how their clients were investing for retirement.Based on age, clients were categorized according to where the largest
Percentage of their retirement portfolio was invested and shown in the table below. 4-14 Chapter 4 Displaying and Describing Categorical Data
Of the clients over age 50, the percentage who invest in mutual funds is
A)3.1% (34/64).
B)33.3% (34/102).
C)18.1% (34/188).
D)34% (64/188).
E)54.3% (102/188).
Percentage of their retirement portfolio was invested and shown in the table below.
4-14 Chapter 4 Displaying and Describing Categorical DataOf the clients over age 50, the percentage who invest in mutual funds is
A)3.1% (34/64).
B)33.3% (34/102).
C)18.1% (34/188).
D)34% (64/188).
E)54.3% (102/188).
B
3
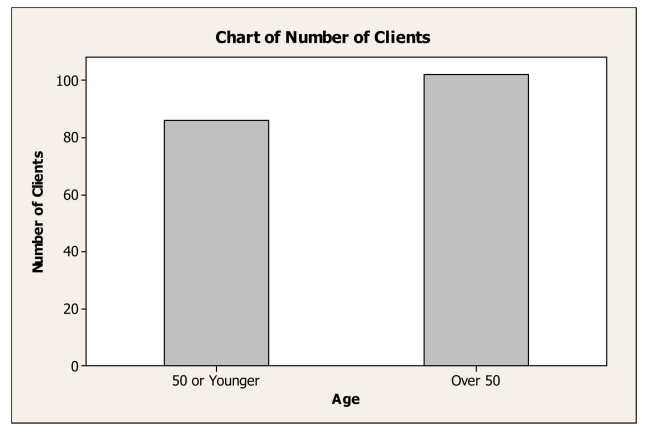
Prepare an appropriate chart to display the marginal distribution of age.
Either a bar chart (shown below) or a pie chart is appropriate.
4
A automobile marketing firm conducts a study to see what types of cars people owned before buying an American car.The results are shown below. The relative frequency of those who owned Japanese cars previously who now bought
American cars is
A)59.9 %
B)29.6%
C)5.7%
D)14.9%
E)2.9%
The relative frequency of those who owned Japanese cars previously who now boughtAmerican cars is
A)59.9 %
B)29.6%
C)5.7%
D)14.9%
E)2.9%
فتح الحزمة
افتح القفل للوصول البطاقات البالغ عددها 32 في هذه المجموعة.
فتح الحزمة
k this deck
5
Prepare an appropriate chart to display the marginal distribution of brands.
فتح الحزمة
افتح القفل للوصول البطاقات البالغ عددها 32 في هذه المجموعة.
فتح الحزمة
k this deck
6
A full service brokerage firm gathered information on how their clients were investing for retirement.Based on age, clients were categorized according to where the largest
Percentage of their retirement portfolio was invested and shown in the table below. The percentage of clients who are over age 50 and invest in mutual funds is
A)3.1% (34/64).
B)33.3% (34/102).
C)18.1% (34/188).
D)34% (64/188).
E)54.3% (102/188).
Percentage of their retirement portfolio was invested and shown in the table below.
The percentage of clients who are over age 50 and invest in mutual funds isA)3.1% (34/64).
B)33.3% (34/102).
C)18.1% (34/188).
D)34% (64/188).
E)54.3% (102/188).
فتح الحزمة
افتح القفل للوصول البطاقات البالغ عددها 32 في هذه المجموعة.
فتح الحزمة
k this deck
7
A full service brokerage firm gathered information on how their clients were investing
for retirement.Based on age, clients were categorized according to where the largest
percentage of their retirement portfolio was invested.The table below summarized the
data.
Identify the variables and tell whether each is categorical or quantitative.
for retirement.Based on age, clients were categorized according to where the largest
percentage of their retirement portfolio was invested.The table below summarized the
data.
Identify the variables and tell whether each is categorical or quantitative.
فتح الحزمة
افتح القفل للوصول البطاقات البالغ عددها 32 في هذه المجموعة.
فتح الحزمة
k this deck
8
A large national retailer of electronics conducted a survey to determine consumer preferences for various brands of digital cameras and the data are summarized in the table
Shown below.Of the consumers who prefer Pentax, what percentage is male?
A)44.1 % (275/623).
B)6.6% (41/623).
C)52.6% (41/78).
D)14.9% (41/275).
E)12.5% (78/623).
Shown below.Of the consumers who prefer Pentax, what percentage is male?
A)44.1 % (275/623).
B)6.6% (41/623).
C)52.6% (41/78).
D)14.9% (41/275).
E)12.5% (78/623).
فتح الحزمة
افتح القفل للوصول البطاقات البالغ عددها 32 في هذه المجموعة.
فتح الحزمة
k this deck
9
A large national retailer of electronics conducted a survey to determine consumer preferences for various brands of digital cameras and the data are summarized in the table
Shown below. The percentage of consumers who are male and prefer Pentax is
A)44.1 % (275/623).
B)6.6% (41/623).
C)52.6% (41/78).
D)14.9% (41/275).
E)12.5% (78/623).
Shown below.
The percentage of consumers who are male and prefer Pentax isA)44.1 % (275/623).
B)6.6% (41/623).
C)52.6% (41/78).
D)14.9% (41/275).
E)12.5% (78/623).
فتح الحزمة
افتح القفل للوصول البطاقات البالغ عددها 32 في هذه المجموعة.
فتح الحزمة
k this deck
10
What is the marginal distribution of brands?
فتح الحزمة
افتح القفل للوصول البطاقات البالغ عددها 32 في هذه المجموعة.
فتح الحزمة
k this deck
11
The following is a bar chart summarizing consumer preferences for various brands of digital cameras.
A)the marginal distribution of brands.
B)the conditional distribution of brands.
C)the contingency distribution of brands.
D)the distribution for a quantitative variable.
E)none of the above.
A)the marginal distribution of brands.
B)the conditional distribution of brands.
C)the contingency distribution of brands.
D)the distribution for a quantitative variable.
E)none of the above.
فتح الحزمة
افتح القفل للوصول البطاقات البالغ عددها 32 في هذه المجموعة.
فتح الحزمة
k this deck
12
Write a sentence or two about the conditional relative frequency distribution of mode
of investment for clients age 50 or younger.
of investment for clients age 50 or younger.
فتح الحزمة
افتح القفل للوصول البطاقات البالغ عددها 32 في هذه المجموعة.
فتح الحزمة
k this deck
13
Find each of the following percentages.
a.What percent of the responses were males who prefer Pentax?
b.What percent of the male responses prefer Pentax?
c.What percent of the consumers who choose Pentax were males?
a.What percent of the responses were males who prefer Pentax?
b.What percent of the male responses prefer Pentax?
c.What percent of the consumers who choose Pentax were males?
فتح الحزمة
افتح القفل للوصول البطاقات البالغ عددها 32 في هذه المجموعة.
فتح الحزمة
k this deck
14
Write a sentence or two about the conditional relative frequency distribution of the
brands among female respondents.
brands among female respondents.
فتح الحزمة
افتح القفل للوصول البطاقات البالغ عددها 32 في هذه المجموعة.
فتح الحزمة
k this deck
15
Identify the variables and tell whether each is categorical or quantitative.
فتح الحزمة
افتح القفل للوصول البطاقات البالغ عددها 32 في هذه المجموعة.
فتح الحزمة
k this deck
16
A full service brokerage firm gathered information on how their clients were investing
for retirement.Based on age, clients were categorized according to where the largest
percentage of their retirement portfolio was invested.The table below summarized the
data.
What is the marginal distribution of age?
for retirement.Based on age, clients were categorized according to where the largest
percentage of their retirement portfolio was invested.The table below summarized the
data.
What is the marginal distribution of age?
فتح الحزمة
افتح القفل للوصول البطاقات البالغ عددها 32 في هذه المجموعة.
فتح الحزمة
k this deck
17
A large national retailer of electronics conducted a survey to determine consumer preferences for various brands of digital cameras and the data are summarized in the table
Shown below. Of the consumers who are male, the percentage who prefer Pentax is
A)44.1 % (275/623).
B)6.6% (41/623).
C)52.6% (41/78).
D)14.9% (41/275).
E)12.5% (78/623).
Shown below.
Of the consumers who are male, the percentage who prefer Pentax isA)44.1 % (275/623).
B)6.6% (41/623).
C)52.6% (41/78).
D)14.9% (41/275).
E)12.5% (78/623).
فتح الحزمة
افتح القفل للوصول البطاقات البالغ عددها 32 في هذه المجموعة.
فتح الحزمة
k this deck
18
Based on the side-by-side bar chart summarizing consumer preferences for various brands of digital cameras by gender, which of the following statements is (are) true?
A)It appears that camera preference and gender are not related.
B)It appears that camera preference and gender are not independent.
C)It appears that camera preference and gender are independent.
D)More males than females prefer Cannon.
E)More females than males prefer Pentax.
A)It appears that camera preference and gender are not related.
B)It appears that camera preference and gender are not independent.
C)It appears that camera preference and gender are independent.
D)More males than females prefer Cannon.
E)More females than males prefer Pentax.
فتح الحزمة
افتح القفل للوصول البطاقات البالغ عددها 32 في هذه المجموعة.
فتح الحزمة
k this deck
19
Consider the following side by side bar chart for the data above: Does the chart indicate that brand preference is independent of gender? Explain.
Does the chart indicate that brand preference is independent of gender? Explain. فتح الحزمة
افتح القفل للوصول البطاقات البالغ عددها 32 في هذه المجموعة.
فتح الحزمة
k this deck
20
Consider the following side by side bar chart for the data above: Does the chart indicate that mode of investment is independent of age? Explain.
Does the chart indicate that mode of investment is independent of age? Explain. فتح الحزمة
افتح القفل للوصول البطاقات البالغ عددها 32 في هذه المجموعة.
فتح الحزمة
k this deck
21
A regional survey was carried out to gauge public opinion on the controversial Arizona Immigration Law (results shown below).What percent oppose the law?
A)48%
B)45%
C)32%
D)25%
E)61%
A)48%
B)45%
C)32%
D)25%
E)61%
فتح الحزمة
افتح القفل للوصول البطاقات البالغ عددها 32 في هذه المجموعة.
فتح الحزمة
k this deck
22
A full service brokerage firm gathered information on how their clients were investing for retirement.Based on age, clients were categorized according to where the
Largest percentage of their retirement portfolio was invested and shown in the table
Below.
A)3.1% (34/64).
B)33.3% (34/102).
C)18.1% (34/188).
D)34% (64/188).
E)54.3% (102/188).
Largest percentage of their retirement portfolio was invested and shown in the table
Below.
A)3.1% (34/64).
B)33.3% (34/102).
C)18.1% (34/188).
D)34% (64/188).
E)54.3% (102/188).
فتح الحزمة
افتح القفل للوصول البطاقات البالغ عددها 32 في هذه المجموعة.
فتح الحزمة
k this deck
23
A full service brokerage firm gathered information on how their clients were investing for retirement.Based on age, clients were categorized according to where the largest
Percentage of their retirement portfolio was invested and shown in the table below. Of the clients who invest in mutual funds, the percentage over age 50 is
A)53.1% (34/64).
B)33.3% (34/102).
C)18.1% (34/188).
D)34% (64/188).
E)54.3% (102/188).
Percentage of their retirement portfolio was invested and shown in the table below.
Of the clients who invest in mutual funds, the percentage over age 50 isA)53.1% (34/64).
B)33.3% (34/102).
C)18.1% (34/188).
D)34% (64/188).
E)54.3% (102/188).
فتح الحزمة
افتح القفل للوصول البطاقات البالغ عددها 32 في هذه المجموعة.
فتح الحزمة
k this deck
24
A regional survey was carried out to gauge public opinion on the controversial Arizona Immigration Law.Based on the results displayed in the table below, what
Percent of respondents is Independent?
A)35%
B)9%
C)29%
D)45%
E)25%
Percent of respondents is Independent?
A)35%
B)9%
C)29%
D)45%
E)25%
فتح الحزمة
افتح القفل للوصول البطاقات البالغ عددها 32 في هذه المجموعة.
فتح الحزمة
k this deck
25
A regional survey was carried out to gauge public opinion on the controversial Arizona Immigration Law (results shown below).Of respondents who are Democrat,
What percent oppose the law?
A)13%
B)35%
C)22%
D)45%
E)61%
What percent oppose the law?
A)13%
B)35%
C)22%
D)45%
E)61%
فتح الحزمة
افتح القفل للوصول البطاقات البالغ عددها 32 في هذه المجموعة.
فتح الحزمة
k this deck
26
In May, 2010, the Pew Research Center for the People & the Press carried out a national survey to gauge opinion on the Arizona Immigration Law.Responses (Favor,
Oppose, Don't Know) were examined according to groups defined by political party
Affiliation (Democrat, Republican, Independent).Which of the following would be
Appropriate for displaying these data?
A)Contingency table.
B)Pie charts.
C)Segmented bar chart.
D)Side by side bar chart.
E)All of the above.
فتح الحزمة
افتح القفل للوصول البطاقات البالغ عددها 32 في هذه المجموعة.
فتح الحزمة
k this deck
27
Here is a pie chart for data collected about clients of brokerage firm. The pie chart shows
A)the distribution of a quantitative variable.
B)the contingency distribution of investment type.
C)the conditional distribution of investment type.
D)the marginal distribution of investment type.
E)the joint distribution of investment type.
The pie chart showsA)the distribution of a quantitative variable.
B)the contingency distribution of investment type.
C)the conditional distribution of investment type.
D)the marginal distribution of investment type.
E)the joint distribution of investment type.
فتح الحزمة
افتح القفل للوصول البطاقات البالغ عددها 32 في هذه المجموعة.
فتح الحزمة
k this deck
28
A restaurant uses comment cards to get feedback from its customers about newly added items to the menu.It recently introduced homemade organic veggie burgers.
Customers who tried the new burger were asked if they would order it again.The data
Are summarized in the table below.What percentage of customers would most likely or
Definitely order the veggie burger again?
A)10%
B)15%
C)40%
D)50%
E)77%
Customers who tried the new burger were asked if they would order it again.The data
Are summarized in the table below.What percentage of customers would most likely or
Definitely order the veggie burger again?
A)10%
B)15%
C)40%
D)50%
E)77%
فتح الحزمة
افتح القفل للوصول البطاقات البالغ عددها 32 في هذه المجموعة.
فتح الحزمة
k this deck
29
A regional survey was carried out to gauge public opinion on the controversial Arizona Immigration Law.The results are displayed in the segmented bar chart below.
Which of the following statements is true?
A)A greater percentage of Republicans oppose the law compared to Democrats.
B)A greater percentage of Republicans oppose the law compared to Independents.
C)Opinion about the law appears to be independent of political party affiliation.
D)A greater percentage of Democrats oppose the law compared to Republicans.
E)The segmented bar chart is not appropriate for these data.
Which of the following statements is true?
A)A greater percentage of Republicans oppose the law compared to Democrats.
B)A greater percentage of Republicans oppose the law compared to Independents.
C)Opinion about the law appears to be independent of political party affiliation.
D)A greater percentage of Democrats oppose the law compared to Republicans.
E)The segmented bar chart is not appropriate for these data.
فتح الحزمة
افتح القفل للوصول البطاقات البالغ عددها 32 في هذه المجموعة.
فتح الحزمة
k this deck
30
A restaurant uses comment cards to get feedback from its customers about newly added items to the menu.It recently introduced homemade organic veggie burgers.
Customers who tried the new burger were asked if they would order it again.The data
Are summarized in the table below.What percentage of customers would definitely order
The veggie burger again?
A)10%
B)15%
C)20%
D)40%
E)77%
Customers who tried the new burger were asked if they would order it again.The data
Are summarized in the table below.What percentage of customers would definitely order
The veggie burger again?
A)10%
B)15%
C)20%
D)40%
E)77%
فتح الحزمة
افتح القفل للوصول البطاقات البالغ عددها 32 في هذه المجموعة.
فتح الحزمة
k this deck
31
A regional survey was carried out to gauge public opinion on the controversial Arizona Immigration Law (results shown below).Of respondents who oppose the law,
What percent is Democrat?
A)13%
B)35%
C)22%
D)45%
E)61%
What percent is Democrat?
A)13%
B)35%
C)22%
D)45%
E)61%
فتح الحزمة
افتح القفل للوصول البطاقات البالغ عددها 32 في هذه المجموعة.
فتح الحزمة
k this deck
32
A regional survey was carried out to gauge public opinion on the controversial Arizona Immigration Law (results shown below).How many respondents are
Republican and favor the law?
A)93
B)45
C)145
D)7
E)85
Republican and favor the law?
A)93
B)45
C)145
D)7
E)85
فتح الحزمة
افتح القفل للوصول البطاقات البالغ عددها 32 في هذه المجموعة.
فتح الحزمة
k this deck
فتح الحزمة
افتح القفل للوصول البطاقات البالغ عددها 32 في هذه المجموعة.


