Deck 14: Management Accounting in a Changing Environment
ملء الشاشة (f)
سؤال
سؤال
سؤال
سؤال
Software Development Inc.
Software Development Inc. (SDI) produces and markets software for personal computers, including spreadsheet, word processing, desktop publishing, and database management programs. SDI has annual sales of $800 million.
Producing software is a time-consuming, labor-intensive process. Software quality is an extremely important aspect of success in computer software markets. One aspect of quality is program reliability. Does the software perform as expected? Does it work with other software in terms of data transfers and interfaces? Does it terminate abnormally? In spite of extensive testing of the software, programs always contain some bugs. Once the software is released, SDI stands behind the product with phone-in customer service consultants who answer questions and help the customer work around problems in the software. SDI's software maintenance group fixes bugs and sends out revised versions of the programs to customers.
SDI tracks the relation between quality costs and quality. The quality measure it uses is the number of documented bugs in a software package. These bugs are counted when a customer calls in with a complaint and the SDI customer service representative determines that this is a new problem. The software maintenance programmers then attempt to fix the program and eliminate the bug. To manage quality, SDI tracks quality costs. It has released 38 new packages or major revisions in existing packages in the last three years. The accompanying table reports the number of defects (bugs) documented in the first six months following release. Also listed in the table are total product cost and quality cost per software package release.
Product costs include all the costs incurred to produce and market the software, excluding the quality costs in the table. Quality costs consist of three components: training, prevention, and software maintenance and customer service costs. Training costs are expenditures for educating the programmers and updating their training. Better-educated programmers produce fewer bugs. Prevention costs include expenditures for testing the software before it is released. Maintenance and customer service costs include (1) the programmers charged with fixing the bugs and reissuing the revised software and (2) the customer service representatives answering phone questions. The training and prevention costs are measured over the period the software was being developed. The number of defects and maintenance and service costs are measured in the first six months following release.
SDI Defects and Quality Costs by Program Release*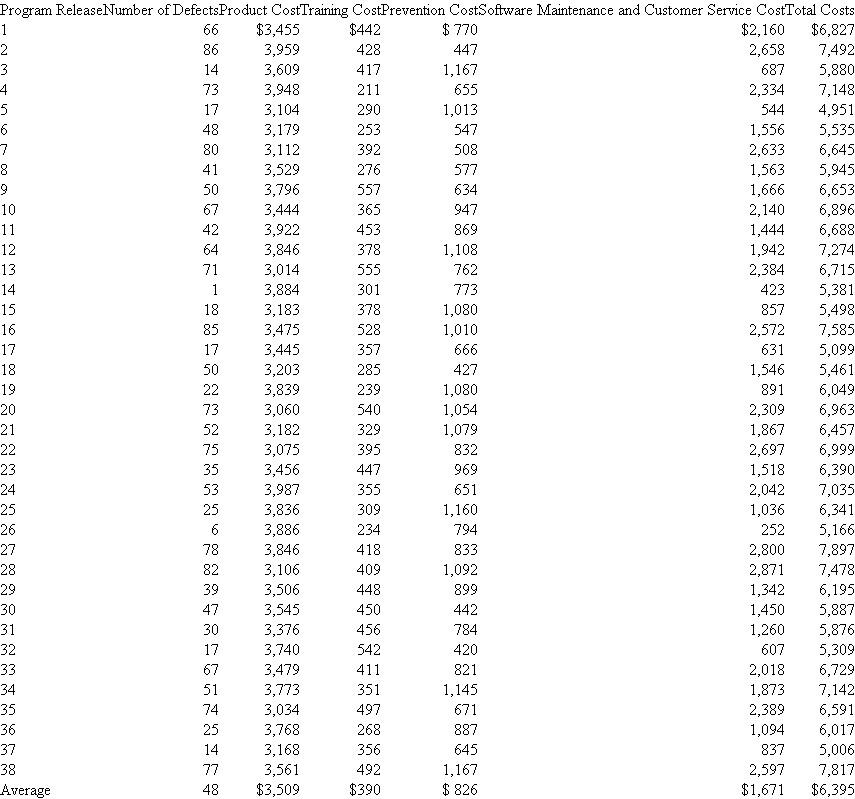 * Per 100,000 lines of computer code.
All the numbers in the table have been divided by lines of computer code in the particular program release. Programs with more lines of code cost more and also have more bugs. Prior studies find that using lines of code is an acceptable way to control for program complexity. Thus, the numbers in the table are stated in terms of defects and cost per 100,000 lines of code.
The figure below plots the relation between total cost and number of defects. The vice president of quality of SDI likes to use it to emphasize that costs and quality are inversely related. She is fond of saying, "Quality pays! Our total costs fall as the number of defects declines. The more we spend on quality, the lower our costs."
SDI total costs by defects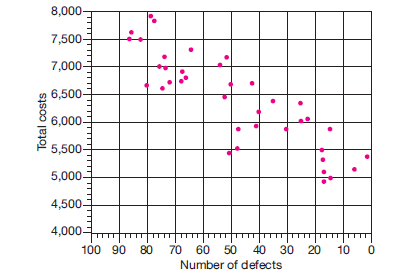
Required:
Critically evaluate the vice president's analysis.
Software Development Inc. (SDI) produces and markets software for personal computers, including spreadsheet, word processing, desktop publishing, and database management programs. SDI has annual sales of $800 million.
Producing software is a time-consuming, labor-intensive process. Software quality is an extremely important aspect of success in computer software markets. One aspect of quality is program reliability. Does the software perform as expected? Does it work with other software in terms of data transfers and interfaces? Does it terminate abnormally? In spite of extensive testing of the software, programs always contain some bugs. Once the software is released, SDI stands behind the product with phone-in customer service consultants who answer questions and help the customer work around problems in the software. SDI's software maintenance group fixes bugs and sends out revised versions of the programs to customers.
SDI tracks the relation between quality costs and quality. The quality measure it uses is the number of documented bugs in a software package. These bugs are counted when a customer calls in with a complaint and the SDI customer service representative determines that this is a new problem. The software maintenance programmers then attempt to fix the program and eliminate the bug. To manage quality, SDI tracks quality costs. It has released 38 new packages or major revisions in existing packages in the last three years. The accompanying table reports the number of defects (bugs) documented in the first six months following release. Also listed in the table are total product cost and quality cost per software package release.
Product costs include all the costs incurred to produce and market the software, excluding the quality costs in the table. Quality costs consist of three components: training, prevention, and software maintenance and customer service costs. Training costs are expenditures for educating the programmers and updating their training. Better-educated programmers produce fewer bugs. Prevention costs include expenditures for testing the software before it is released. Maintenance and customer service costs include (1) the programmers charged with fixing the bugs and reissuing the revised software and (2) the customer service representatives answering phone questions. The training and prevention costs are measured over the period the software was being developed. The number of defects and maintenance and service costs are measured in the first six months following release.
SDI Defects and Quality Costs by Program Release*
* Per 100,000 lines of computer code.All the numbers in the table have been divided by lines of computer code in the particular program release. Programs with more lines of code cost more and also have more bugs. Prior studies find that using lines of code is an acceptable way to control for program complexity. Thus, the numbers in the table are stated in terms of defects and cost per 100,000 lines of code.
The figure below plots the relation between total cost and number of defects. The vice president of quality of SDI likes to use it to emphasize that costs and quality are inversely related. She is fond of saying, "Quality pays! Our total costs fall as the number of defects declines. The more we spend on quality, the lower our costs."
SDI total costs by defects
Required:
Critically evaluate the vice president's analysis.
سؤال
سؤال
TQM at the Stowbridge Division
The Stowbridge Division is analyzing expanding its Total Quality Management program. It already has a TQM program in place. However, one of its customers, Amlan Equipment, is asking all suppliers to become ISO 9000-qualified, a process that certifies that the firm meets various standards. Once suppliers are ISO 9000-qualified, Amlan can reduce its inspection costs. Not all of the suppliers will be certified, and those that are will receive more business from Amlan.
Amlan purchases a stainless steel rotor from Stowbridge. After earning ISO 9000 certification, Stowbridge estimates that it will have to incur the following annual incremental costs as long as it wants to maintain its certification: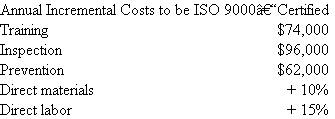 To manufacture the current quality of the rotors (before ISO 9000 certification), the budgeted selling price and standard cost data per rotor follow.
 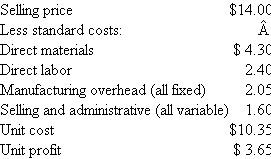 Unless Stowbridge receives ISO 9000 certification, it will lose Amlan's business of 120,000 units per year. Management estimates that the higher quality of the rotor that meets quality criteria will allow Stowbridge to add 14,000 rotors to its existing sales from new and continuing customers. Stowbridge is currently selling 480,000 rotors per year, including the Amlan sales. The 480,000 current sales amount to 63 percent of plant capacity. The additional 14,000 units sold can be manufactured without exceeding plant capacity. The higher-quality process after ISO 9000 certification is received would apply to all the rotors produced.
Required:
Should Stowbridge seek ISO 9000 certification? Support your recommendation with an analysis of the costs and benefits of certification.
The Stowbridge Division is analyzing expanding its Total Quality Management program. It already has a TQM program in place. However, one of its customers, Amlan Equipment, is asking all suppliers to become ISO 9000-qualified, a process that certifies that the firm meets various standards. Once suppliers are ISO 9000-qualified, Amlan can reduce its inspection costs. Not all of the suppliers will be certified, and those that are will receive more business from Amlan.
Amlan purchases a stainless steel rotor from Stowbridge. After earning ISO 9000 certification, Stowbridge estimates that it will have to incur the following annual incremental costs as long as it wants to maintain its certification:
To manufacture the current quality of the rotors (before ISO 9000 certification), the budgeted selling price and standard cost data per rotor follow. Unless Stowbridge receives ISO 9000 certification, it will lose Amlan's business of 120,000 units per year. Management estimates that the higher quality of the rotor that meets quality criteria will allow Stowbridge to add 14,000 rotors to its existing sales from new and continuing customers. Stowbridge is currently selling 480,000 rotors per year, including the Amlan sales. The 480,000 current sales amount to 63 percent of plant capacity. The additional 14,000 units sold can be manufactured without exceeding plant capacity. The higher-quality process after ISO 9000 certification is received would apply to all the rotors produced.Required:
Should Stowbridge seek ISO 9000 certification? Support your recommendation with an analysis of the costs and benefits of certification.
سؤال
Winter Games
Winter Games manufactures a competitive line of skis and sells its skis to retailers at a price of $225 per pair. Based on an annual volume of 5,000 pairs, the cost per pair is $185: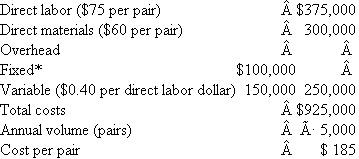 "Composed of depreciation, property taxes, charitable contributions, insurance, and so on.
Sports Palace, a discount sporting goods store, currently purchases 500 pairs of skis from Winter Games. Sports Palace has asked to purchase 1,000 pairs of skis under a private brand label, at a price of $200 per pair. The skis would be identical to those normally sold for $225.
Winter Games believes that if it accepts the order, Sports Palace will cancel its usual order of 500 pairs. These sales cannot be recouped elsewhere. If this special order is accepted, the direct labor hours for the additional 500 skis would have to be compensated at overtime rates (at 1 1 / 2 times the base rate). Analysis shows that variable overhead varies with total direct labor dollars at the rate of $0.40 per direct labor dollar.
Should Winter Games accept the special order from Sports Palace?
Winter Games manufactures a competitive line of skis and sells its skis to retailers at a price of $225 per pair. Based on an annual volume of 5,000 pairs, the cost per pair is $185:
"Composed of depreciation, property taxes, charitable contributions, insurance, and so on.Sports Palace, a discount sporting goods store, currently purchases 500 pairs of skis from Winter Games. Sports Palace has asked to purchase 1,000 pairs of skis under a private brand label, at a price of $200 per pair. The skis would be identical to those normally sold for $225.
Winter Games believes that if it accepts the order, Sports Palace will cancel its usual order of 500 pairs. These sales cannot be recouped elsewhere. If this special order is accepted, the direct labor hours for the additional 500 skis would have to be compensated at overtime rates (at 1 1 / 2 times the base rate). Analysis shows that variable overhead varies with total direct labor dollars at the rate of $0.40 per direct labor dollar.
Should Winter Games accept the special order from Sports Palace?
سؤال
Warren City Parts Manufacturing
Warren City, with sales of $2 billion, produces and sells farm equipment. The manufacturing division produces some parts internally and purchases other parts from external suppliers and assembles farm equipment including tractors, combines, and plows. Within the manufacturing division is parts manufacturing, which fabricates a large variety of parts. Parts manufacturing is further subdivided into 12 departments, including screw products, metal stamping and fabrication, plastic injection molding, and steel castings. Each of these parts departments is headed by a department manager whose performance is evaluated along several dimensions: meeting budgeted costs, meeting delivery schedules, improving quality, achieving affirmative action and employee satisfaction goals, and minimizing inventory adjustments.
Inventory adjustments occur twice a year after internal auditors conduct a physical inventory of the parts department's work in process and compare it with the amount of inventory as reported in the work-in-process (WIP) account. For example, if on June 30 the auditors take a physical inventory count and find $130,000 of physical WIP inventory in the steel castings department but the WIP account reports an inventory balance of $143,000, then a negative inventory adjustment of -9.1 percent (-$13,000 ÷ $143,000) is made. Any inventory adjustment, positive or negative, reflects unfavorably on the parts department manager's performance and results in a reduction in the manager's bonus. The parts department manager is expected to maintain a tight control of WIP inventories, including ensuring the integrity of his or her department's accounting reports of WIP. Large inventory adjustments indicate that the manager does not have good control of WIP.
Four years ago Warren City adopted JIT production procedures. The result has been a drastic reduction of WIP inventories. For example, the following data illustrate the steel castings department's WIP account balance before adjustments, inventory adjustment, and throughput for the last seven years.
Warren City Steel Castings Department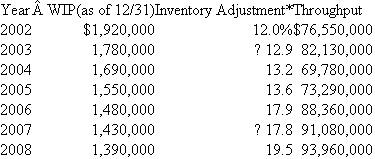 * Deflated by 12/31 WIP.
Throughput is the total dollar cost of parts manufactured in the year. It is the sum of the beginning inventory plus direct labor and materials and overhead, less ending inventory. Warren City uses a standard cost system and all inventories are valued at standard cost. When a batch of parts completes production, the WIP inventory is reduced by the standard cost of the part times the standard number of parts in the batch. Each part is manufactured in standard lot sizes.
Inventory adjustments can result for a number of reasons:
1. Different batch sizes. The department manager decides to deviate from standard batch sizes. Unless a special entry is recorded, the accounting system assumes that the number of units in the batch is the standard number. Sometimes the manager has some excess production capacity and decides to increase the standard batch size. In some cases, the manager produces fewer parts than called for by the standard lot size because of machine breakdowns or bottlenecks. For example, suppose a certain part calls for a standard batch size of 150 but the manager decides to produce 200 parts, keeps 50 as spares, but fails to update the WIP account for the additional 50 units. The WIP account contains only 150 at standard cost but the auditors count 200, causing a positive inventory adjustment.
2. Timing differences. The accounting system charges some expenses in a different time period than the department manager expects. This causes the dollar amount of the WIP balance to differ from standard cost.
3. Standard cost revisions. The standard cost of a part is revised and the auditors use a different standard cost in valuing the ending WIP inventory than was used in the WIP account.
4. Audit mistakes. The internal auditors make mistakes in counting the final physical WIP inventory.
The first two reasons are by far the most prevalent causes of inventory adjustments.
Required:
a. Management is concerned that the magnitude of the inventory adjustment has increased over time. What are some likely reasons that the absolute value of the inventory adjustment has grown?
b. Evaluate the use of the inventory adjustment described above to measure a parts department manager's performance.
Warren City, with sales of $2 billion, produces and sells farm equipment. The manufacturing division produces some parts internally and purchases other parts from external suppliers and assembles farm equipment including tractors, combines, and plows. Within the manufacturing division is parts manufacturing, which fabricates a large variety of parts. Parts manufacturing is further subdivided into 12 departments, including screw products, metal stamping and fabrication, plastic injection molding, and steel castings. Each of these parts departments is headed by a department manager whose performance is evaluated along several dimensions: meeting budgeted costs, meeting delivery schedules, improving quality, achieving affirmative action and employee satisfaction goals, and minimizing inventory adjustments.
Inventory adjustments occur twice a year after internal auditors conduct a physical inventory of the parts department's work in process and compare it with the amount of inventory as reported in the work-in-process (WIP) account. For example, if on June 30 the auditors take a physical inventory count and find $130,000 of physical WIP inventory in the steel castings department but the WIP account reports an inventory balance of $143,000, then a negative inventory adjustment of -9.1 percent (-$13,000 ÷ $143,000) is made. Any inventory adjustment, positive or negative, reflects unfavorably on the parts department manager's performance and results in a reduction in the manager's bonus. The parts department manager is expected to maintain a tight control of WIP inventories, including ensuring the integrity of his or her department's accounting reports of WIP. Large inventory adjustments indicate that the manager does not have good control of WIP.
Four years ago Warren City adopted JIT production procedures. The result has been a drastic reduction of WIP inventories. For example, the following data illustrate the steel castings department's WIP account balance before adjustments, inventory adjustment, and throughput for the last seven years.
Warren City Steel Castings Department
* Deflated by 12/31 WIP.Throughput is the total dollar cost of parts manufactured in the year. It is the sum of the beginning inventory plus direct labor and materials and overhead, less ending inventory. Warren City uses a standard cost system and all inventories are valued at standard cost. When a batch of parts completes production, the WIP inventory is reduced by the standard cost of the part times the standard number of parts in the batch. Each part is manufactured in standard lot sizes.
Inventory adjustments can result for a number of reasons:
1. Different batch sizes. The department manager decides to deviate from standard batch sizes. Unless a special entry is recorded, the accounting system assumes that the number of units in the batch is the standard number. Sometimes the manager has some excess production capacity and decides to increase the standard batch size. In some cases, the manager produces fewer parts than called for by the standard lot size because of machine breakdowns or bottlenecks. For example, suppose a certain part calls for a standard batch size of 150 but the manager decides to produce 200 parts, keeps 50 as spares, but fails to update the WIP account for the additional 50 units. The WIP account contains only 150 at standard cost but the auditors count 200, causing a positive inventory adjustment.
2. Timing differences. The accounting system charges some expenses in a different time period than the department manager expects. This causes the dollar amount of the WIP balance to differ from standard cost.
3. Standard cost revisions. The standard cost of a part is revised and the auditors use a different standard cost in valuing the ending WIP inventory than was used in the WIP account.
4. Audit mistakes. The internal auditors make mistakes in counting the final physical WIP inventory.
The first two reasons are by far the most prevalent causes of inventory adjustments.
Required:
a. Management is concerned that the magnitude of the inventory adjustment has increased over time. What are some likely reasons that the absolute value of the inventory adjustment has grown?
b. Evaluate the use of the inventory adjustment described above to measure a parts department manager's performance.
سؤال
Secure Servers Inc.
Secure Servers Inc. (SSI) is one of the largest software and service providers directed at providing high levels of backup and security for computer servers to the financial community, military, and other clients requiring off-site backup and security systems. SSI's software packages include encryption, downloading, and data warehousing of large amounts of data to various SSI sites in dedicated locations. SSI backup locations are designed to survive virtually all natural disasters and terrorist attacks.
SSI employs 6,000 people in Dayton, Ohio. Being one of Dayton's largest employers, it has a deep commitment to the community and supports local educational, cultural, and philanthropic activities. SSI also believes strongly in both customer and employee satisfaction. To achieve these objectives, SSI employs a balanced scorecard to evaluate and reward senior managers. One-fourth of each senior executive's bonus is tied to the following objectively determined performance measures:
Community engagement (independent survey of local leaders).
Customer satisfaction (independent survey of customers).
Employee satisfaction (independent survey of employees).
Corporate profit (audited net income before taxes).
The annual surveys of local leaders, customers, and employees are conducted by an independent opinion survey firm that reports directly to the board of directors. Corporate profit is the firm's reported net income before taxes as audited by an international public accounting firm. SSI's senior management team believes strongly in the concept of the balanced scorecard and accepts it as a valid and productive performance measurement and incentive tool.
Senior management is tasked with determining how much to spend on further improvements in community engagement, customer satisfaction, and employee satisfaction. The following table captures the relations among additional spending in each area and the expected improvements from such expenditures (in millions).![Secure Servers Inc. Secure Servers Inc. (SSI) is one of the largest software and service providers directed at providing high levels of backup and security for computer servers to the financial community, military, and other clients requiring off-site backup and security systems. SSI's software packages include encryption, downloading, and data warehousing of large amounts of data to various SSI sites in dedicated locations. SSI backup locations are designed to survive virtually all natural disasters and terrorist attacks. SSI employs 6,000 people in Dayton, Ohio. Being one of Dayton's largest employers, it has a deep commitment to the community and supports local educational, cultural, and philanthropic activities. SSI also believes strongly in both customer and employee satisfaction. To achieve these objectives, SSI employs a balanced scorecard to evaluate and reward senior managers. One-fourth of each senior executive's bonus is tied to the following objectively determined performance measures: Community engagement (independent survey of local leaders). Customer satisfaction (independent survey of customers). Employee satisfaction (independent survey of employees). Corporate profit (audited net income before taxes). The annual surveys of local leaders, customers, and employees are conducted by an independent opinion survey firm that reports directly to the board of directors. Corporate profit is the firm's reported net income before taxes as audited by an international public accounting firm. SSI's senior management team believes strongly in the concept of the balanced scorecard and accepts it as a valid and productive performance measurement and incentive tool. Senior management is tasked with determining how much to spend on further improvements in community engagement, customer satisfaction, and employee satisfaction. The following table captures the relations among additional spending in each area and the expected improvements from such expenditures (in millions). For example, by spending an additional $3 million on customer service (improved call centers, training, etc.), a 95 percent customer satisfaction can be achieved. Or, by spending an additional $2 million on employee-related activities (improved child care, athletic facilities, fringe benefits), a 90 percent employee satisfaction can be achieved. Or spending $1 million on additional community projects can raise SSI's community rating survey to 50 percent. Besides raising the satisfaction scores as detailed above, making additional expenditures on these three areas also generates additional net cash flows to the firm. The following table estimates the additional cash flows SSI receives from making the additional expenditures. For example, spending $3 million for community projects yields a community rating index of 90 percent and additional cash flows of $4.0 million, which increases net income before taxes by $1.0 million ($4.0 ? $3.0). To convert audited net income into a percentage index that can be averaged with the other three survey metrics, SSI uses the following formula: Profit index = ?3 + 0.05 × Net income So, if net income is $74 million, the profit index for use in the balanced scorecard is 70 percent [?3 + (0.05 × 74)]. The four indexes are averaged to get an overall index for determining the bonus for each senior executive of SSI. For example, the following four indexes yield a balanced scorecard of 79.75 percent: SSI expects audited net income before taxes for the year before making any additional expenditures on customer satisfaction, employee satisfaction, and community engagement to be $72 million. Required: a. What levels of additional spending do you expect the senior management team of SSI will select for: (1) Customer satisfaction. (2) Community engagement. (3) Employee satisfaction. Be sure to justify your answers with appropriate analysis. b. Given the levels of additional spending on the three items you recommended in ( a ), what is the expected balanced scorecard index? That is, calculate the average balanced scorecard management expects to generate if they make the expenditure decisions you predict in ( a ). Show calculations. c. What level of spending would you expect a profit-maximizing owner of SSI to select for: (1) Customer satisfaction. (2) Community engagement. (3) Employee satisfaction. What is the expected balanced scorecard resulting from these spending levels?<div style=padding-top: 35px>](https://d2lvgg3v3hfg70.cloudfront.net/SM1503/11eb559c_84e6_32eb_a8c8_37eddf32638f_SM1503_00.jpg) For example, by spending an additional $3 million on customer service (improved call centers, training, etc.), a 95 percent customer satisfaction can be achieved. Or, by spending an additional $2 million on employee-related activities (improved child care, athletic facilities, fringe benefits), a 90 percent employee satisfaction can be achieved. Or spending $1 million on additional community projects can raise SSI's community rating survey to 50 percent.
For example, by spending an additional $3 million on customer service (improved call centers, training, etc.), a 95 percent customer satisfaction can be achieved. Or, by spending an additional $2 million on employee-related activities (improved child care, athletic facilities, fringe benefits), a 90 percent employee satisfaction can be achieved. Or spending $1 million on additional community projects can raise SSI's community rating survey to 50 percent.
Besides raising the satisfaction scores as detailed above, making additional expenditures on these three areas also generates additional net cash flows to the firm. The following table estimates the additional cash flows SSI receives from making the additional expenditures.![Secure Servers Inc. Secure Servers Inc. (SSI) is one of the largest software and service providers directed at providing high levels of backup and security for computer servers to the financial community, military, and other clients requiring off-site backup and security systems. SSI's software packages include encryption, downloading, and data warehousing of large amounts of data to various SSI sites in dedicated locations. SSI backup locations are designed to survive virtually all natural disasters and terrorist attacks. SSI employs 6,000 people in Dayton, Ohio. Being one of Dayton's largest employers, it has a deep commitment to the community and supports local educational, cultural, and philanthropic activities. SSI also believes strongly in both customer and employee satisfaction. To achieve these objectives, SSI employs a balanced scorecard to evaluate and reward senior managers. One-fourth of each senior executive's bonus is tied to the following objectively determined performance measures: Community engagement (independent survey of local leaders). Customer satisfaction (independent survey of customers). Employee satisfaction (independent survey of employees). Corporate profit (audited net income before taxes). The annual surveys of local leaders, customers, and employees are conducted by an independent opinion survey firm that reports directly to the board of directors. Corporate profit is the firm's reported net income before taxes as audited by an international public accounting firm. SSI's senior management team believes strongly in the concept of the balanced scorecard and accepts it as a valid and productive performance measurement and incentive tool. Senior management is tasked with determining how much to spend on further improvements in community engagement, customer satisfaction, and employee satisfaction. The following table captures the relations among additional spending in each area and the expected improvements from such expenditures (in millions). For example, by spending an additional $3 million on customer service (improved call centers, training, etc.), a 95 percent customer satisfaction can be achieved. Or, by spending an additional $2 million on employee-related activities (improved child care, athletic facilities, fringe benefits), a 90 percent employee satisfaction can be achieved. Or spending $1 million on additional community projects can raise SSI's community rating survey to 50 percent. Besides raising the satisfaction scores as detailed above, making additional expenditures on these three areas also generates additional net cash flows to the firm. The following table estimates the additional cash flows SSI receives from making the additional expenditures. For example, spending $3 million for community projects yields a community rating index of 90 percent and additional cash flows of $4.0 million, which increases net income before taxes by $1.0 million ($4.0 ? $3.0). To convert audited net income into a percentage index that can be averaged with the other three survey metrics, SSI uses the following formula: Profit index = ?3 + 0.05 × Net income So, if net income is $74 million, the profit index for use in the balanced scorecard is 70 percent [?3 + (0.05 × 74)]. The four indexes are averaged to get an overall index for determining the bonus for each senior executive of SSI. For example, the following four indexes yield a balanced scorecard of 79.75 percent: SSI expects audited net income before taxes for the year before making any additional expenditures on customer satisfaction, employee satisfaction, and community engagement to be $72 million. Required: a. What levels of additional spending do you expect the senior management team of SSI will select for: (1) Customer satisfaction. (2) Community engagement. (3) Employee satisfaction. Be sure to justify your answers with appropriate analysis. b. Given the levels of additional spending on the three items you recommended in ( a ), what is the expected balanced scorecard index? That is, calculate the average balanced scorecard management expects to generate if they make the expenditure decisions you predict in ( a ). Show calculations. c. What level of spending would you expect a profit-maximizing owner of SSI to select for: (1) Customer satisfaction. (2) Community engagement. (3) Employee satisfaction. What is the expected balanced scorecard resulting from these spending levels?<div style=padding-top: 35px>](https://d2lvgg3v3hfg70.cloudfront.net/SM1503/11eb559c_84e6_32ec_a8c8_ebd250aa3031_SM1503_00.jpg) For example, spending $3 million for community projects yields a community rating index of 90 percent and additional cash flows of $4.0 million, which increases net income before taxes by $1.0 million ($4.0 ? $3.0).
For example, spending $3 million for community projects yields a community rating index of 90 percent and additional cash flows of $4.0 million, which increases net income before taxes by $1.0 million ($4.0 ? $3.0).
To convert audited net income into a percentage index that can be averaged with the other three survey metrics, SSI uses the following formula:
Profit index = ?3 + 0.05 × Net income
So, if net income is $74 million, the profit index for use in the balanced scorecard is 70 percent [?3 + (0.05 × 74)].
The four indexes are averaged to get an overall index for determining the bonus for each senior executive of SSI. For example, the following four indexes yield a balanced scorecard of 79.75 percent:![Secure Servers Inc. Secure Servers Inc. (SSI) is one of the largest software and service providers directed at providing high levels of backup and security for computer servers to the financial community, military, and other clients requiring off-site backup and security systems. SSI's software packages include encryption, downloading, and data warehousing of large amounts of data to various SSI sites in dedicated locations. SSI backup locations are designed to survive virtually all natural disasters and terrorist attacks. SSI employs 6,000 people in Dayton, Ohio. Being one of Dayton's largest employers, it has a deep commitment to the community and supports local educational, cultural, and philanthropic activities. SSI also believes strongly in both customer and employee satisfaction. To achieve these objectives, SSI employs a balanced scorecard to evaluate and reward senior managers. One-fourth of each senior executive's bonus is tied to the following objectively determined performance measures: Community engagement (independent survey of local leaders). Customer satisfaction (independent survey of customers). Employee satisfaction (independent survey of employees). Corporate profit (audited net income before taxes). The annual surveys of local leaders, customers, and employees are conducted by an independent opinion survey firm that reports directly to the board of directors. Corporate profit is the firm's reported net income before taxes as audited by an international public accounting firm. SSI's senior management team believes strongly in the concept of the balanced scorecard and accepts it as a valid and productive performance measurement and incentive tool. Senior management is tasked with determining how much to spend on further improvements in community engagement, customer satisfaction, and employee satisfaction. The following table captures the relations among additional spending in each area and the expected improvements from such expenditures (in millions). For example, by spending an additional $3 million on customer service (improved call centers, training, etc.), a 95 percent customer satisfaction can be achieved. Or, by spending an additional $2 million on employee-related activities (improved child care, athletic facilities, fringe benefits), a 90 percent employee satisfaction can be achieved. Or spending $1 million on additional community projects can raise SSI's community rating survey to 50 percent. Besides raising the satisfaction scores as detailed above, making additional expenditures on these three areas also generates additional net cash flows to the firm. The following table estimates the additional cash flows SSI receives from making the additional expenditures. For example, spending $3 million for community projects yields a community rating index of 90 percent and additional cash flows of $4.0 million, which increases net income before taxes by $1.0 million ($4.0 ? $3.0). To convert audited net income into a percentage index that can be averaged with the other three survey metrics, SSI uses the following formula: Profit index = ?3 + 0.05 × Net income So, if net income is $74 million, the profit index for use in the balanced scorecard is 70 percent [?3 + (0.05 × 74)]. The four indexes are averaged to get an overall index for determining the bonus for each senior executive of SSI. For example, the following four indexes yield a balanced scorecard of 79.75 percent: SSI expects audited net income before taxes for the year before making any additional expenditures on customer satisfaction, employee satisfaction, and community engagement to be $72 million. Required: a. What levels of additional spending do you expect the senior management team of SSI will select for: (1) Customer satisfaction. (2) Community engagement. (3) Employee satisfaction. Be sure to justify your answers with appropriate analysis. b. Given the levels of additional spending on the three items you recommended in ( a ), what is the expected balanced scorecard index? That is, calculate the average balanced scorecard management expects to generate if they make the expenditure decisions you predict in ( a ). Show calculations. c. What level of spending would you expect a profit-maximizing owner of SSI to select for: (1) Customer satisfaction. (2) Community engagement. (3) Employee satisfaction. What is the expected balanced scorecard resulting from these spending levels?<div style=padding-top: 35px>](https://d2lvgg3v3hfg70.cloudfront.net/SM1503/11eb559c_84e6_32ed_a8c8_9141453d16c7_SM1503_00.jpg) SSI expects audited net income before taxes for the year before making any additional expenditures on customer satisfaction, employee satisfaction, and community engagement to be $72 million.
SSI expects audited net income before taxes for the year before making any additional expenditures on customer satisfaction, employee satisfaction, and community engagement to be $72 million.
Required:
a. What levels of additional spending do you expect the senior management team of SSI will select for:
(1) Customer satisfaction.
(2) Community engagement.
(3) Employee satisfaction.
Be sure to justify your answers with appropriate analysis.
b. Given the levels of additional spending on the three items you recommended in ( a ), what is the expected balanced scorecard index? That is, calculate the average balanced scorecard management expects to generate if they make the expenditure decisions you predict in ( a ). Show calculations.
c. What level of spending would you expect a profit-maximizing owner of SSI to select for:
(1) Customer satisfaction.
(2) Community engagement.
(3) Employee satisfaction.
What is the expected balanced scorecard resulting from these spending levels?
Secure Servers Inc. (SSI) is one of the largest software and service providers directed at providing high levels of backup and security for computer servers to the financial community, military, and other clients requiring off-site backup and security systems. SSI's software packages include encryption, downloading, and data warehousing of large amounts of data to various SSI sites in dedicated locations. SSI backup locations are designed to survive virtually all natural disasters and terrorist attacks.
SSI employs 6,000 people in Dayton, Ohio. Being one of Dayton's largest employers, it has a deep commitment to the community and supports local educational, cultural, and philanthropic activities. SSI also believes strongly in both customer and employee satisfaction. To achieve these objectives, SSI employs a balanced scorecard to evaluate and reward senior managers. One-fourth of each senior executive's bonus is tied to the following objectively determined performance measures:
Community engagement (independent survey of local leaders).
Customer satisfaction (independent survey of customers).
Employee satisfaction (independent survey of employees).
Corporate profit (audited net income before taxes).
The annual surveys of local leaders, customers, and employees are conducted by an independent opinion survey firm that reports directly to the board of directors. Corporate profit is the firm's reported net income before taxes as audited by an international public accounting firm. SSI's senior management team believes strongly in the concept of the balanced scorecard and accepts it as a valid and productive performance measurement and incentive tool.
Senior management is tasked with determining how much to spend on further improvements in community engagement, customer satisfaction, and employee satisfaction. The following table captures the relations among additional spending in each area and the expected improvements from such expenditures (in millions).
For example, by spending an additional $3 million on customer service (improved call centers, training, etc.), a 95 percent customer satisfaction can be achieved. Or, by spending an additional $2 million on employee-related activities (improved child care, athletic facilities, fringe benefits), a 90 percent employee satisfaction can be achieved. Or spending $1 million on additional community projects can raise SSI's community rating survey to 50 percent.Besides raising the satisfaction scores as detailed above, making additional expenditures on these three areas also generates additional net cash flows to the firm. The following table estimates the additional cash flows SSI receives from making the additional expenditures.
For example, spending $3 million for community projects yields a community rating index of 90 percent and additional cash flows of $4.0 million, which increases net income before taxes by $1.0 million ($4.0 ? $3.0).To convert audited net income into a percentage index that can be averaged with the other three survey metrics, SSI uses the following formula:
Profit index = ?3 + 0.05 × Net income
So, if net income is $74 million, the profit index for use in the balanced scorecard is 70 percent [?3 + (0.05 × 74)].
The four indexes are averaged to get an overall index for determining the bonus for each senior executive of SSI. For example, the following four indexes yield a balanced scorecard of 79.75 percent:
SSI expects audited net income before taxes for the year before making any additional expenditures on customer satisfaction, employee satisfaction, and community engagement to be $72 million.Required:
a. What levels of additional spending do you expect the senior management team of SSI will select for:
(1) Customer satisfaction.
(2) Community engagement.
(3) Employee satisfaction.
Be sure to justify your answers with appropriate analysis.
b. Given the levels of additional spending on the three items you recommended in ( a ), what is the expected balanced scorecard index? That is, calculate the average balanced scorecard management expects to generate if they make the expenditure decisions you predict in ( a ). Show calculations.
c. What level of spending would you expect a profit-maximizing owner of SSI to select for:
(1) Customer satisfaction.
(2) Community engagement.
(3) Employee satisfaction.
What is the expected balanced scorecard resulting from these spending levels?
سؤال
British Airways
British Airways (BA) has implemented the balanced scorecard. Match the following performance indicators: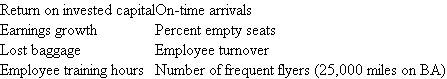 to these four balanced scorecard perspectives:
 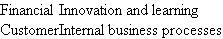 Note: Performance indicators may be used for more than one perspective.
British Airways (BA) has implemented the balanced scorecard. Match the following performance indicators:
to these four balanced scorecard perspectives: Note: Performance indicators may be used for more than one perspective. سؤال
Kollel Hospital
Kollel is a private hospital that operates in a large metropolitan area. The hospital admits "regular" patients and "private" patients. Regular patients are admitted and treated by staff doctors who are fulltime employees of Kollel Hospital. Private patients are admitted and treated by private physicians (physicians in private practice who have admitting privileges to Kollel). To maintain its leadership role in the community, Kollel is deeply committed to its Total Quality Management program. Management and staff form multidisciplinary teams to study various hospital functions. This year, one team reviewed a hospital unit that exclusively treated a particular type of medical admittance. (All patients of this type of admittance were treated in this unit.) The team found that patients preferred to be discharged sooner rather than later and that, overall, the patients felt that they were kept in the hospital too long.
The specific unit under review consists of 16 beds. Last year the unit treated 300 patients. The patients were heterogeneous with respect to their level of illness. Properly diagnosed and treated, patients should have been discharged in an average of 16 days. Nevertheless, the TQM study showed that patients remain in the hospital an average of 19 days. Furthermore, research showed that the average stay of regular patients was shorter than the average stay of private patients, even though the private physicians did not handle more difficult cases at the time of admission. The study found that private doctors took longer to diagnose their patients and spent less time with them during treatment. As a result, these doctors did not promptly recognize whether a treatment was working or whether the patient was ready to be discharged.
In order to increase the quality of care, hospital management is studying plans to lower the average stay of these patients. One alternative being considered is preventing the private doctors, who are keeping their patients in the unit the longest, from admitting patients into the unit. Some, but not all, of these patients can be replaced by patients admitted by staff doctors. The trade-off between the number of patients admitted and the length of a patient's stay is shown in the following table. Last year 150 regular and 150 private patients were admitted. The average stay was 16 days for regular patients and 22 days for private patients, making an overall average of 19 days per patient.
Admissions as a Function of Reducing Length of Stay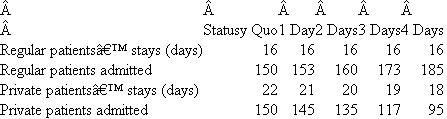 For this specific type of admittance, the hospital collects $10,000 per stay from the insurance companies, regardless of whether the patient is admitted regularly or privately. This amount is used to cover the unit's fixed cost of $1,752,000 per year (365 days) and a variable cost of $150 per patient per day. Note that the charges for the doctor's services are handled separately and are not considered for purposes of this analysis.
Required:
a. Calculate the average hospital stay for all patients under each scenario listed in the table. Also, for each case calculate the occupancy rate (percentage of beds filled on average). Discuss the relation between the average length of stay and the occupancy rate.
b. Prepare an income statement showing the net income for each scenario, separating the margin earned on regular and private patients. Where is profit maximized? What are the components of the change in net income?
Kollel is a private hospital that operates in a large metropolitan area. The hospital admits "regular" patients and "private" patients. Regular patients are admitted and treated by staff doctors who are fulltime employees of Kollel Hospital. Private patients are admitted and treated by private physicians (physicians in private practice who have admitting privileges to Kollel). To maintain its leadership role in the community, Kollel is deeply committed to its Total Quality Management program. Management and staff form multidisciplinary teams to study various hospital functions. This year, one team reviewed a hospital unit that exclusively treated a particular type of medical admittance. (All patients of this type of admittance were treated in this unit.) The team found that patients preferred to be discharged sooner rather than later and that, overall, the patients felt that they were kept in the hospital too long.
The specific unit under review consists of 16 beds. Last year the unit treated 300 patients. The patients were heterogeneous with respect to their level of illness. Properly diagnosed and treated, patients should have been discharged in an average of 16 days. Nevertheless, the TQM study showed that patients remain in the hospital an average of 19 days. Furthermore, research showed that the average stay of regular patients was shorter than the average stay of private patients, even though the private physicians did not handle more difficult cases at the time of admission. The study found that private doctors took longer to diagnose their patients and spent less time with them during treatment. As a result, these doctors did not promptly recognize whether a treatment was working or whether the patient was ready to be discharged.
In order to increase the quality of care, hospital management is studying plans to lower the average stay of these patients. One alternative being considered is preventing the private doctors, who are keeping their patients in the unit the longest, from admitting patients into the unit. Some, but not all, of these patients can be replaced by patients admitted by staff doctors. The trade-off between the number of patients admitted and the length of a patient's stay is shown in the following table. Last year 150 regular and 150 private patients were admitted. The average stay was 16 days for regular patients and 22 days for private patients, making an overall average of 19 days per patient.
Admissions as a Function of Reducing Length of Stay
For this specific type of admittance, the hospital collects $10,000 per stay from the insurance companies, regardless of whether the patient is admitted regularly or privately. This amount is used to cover the unit's fixed cost of $1,752,000 per year (365 days) and a variable cost of $150 per patient per day. Note that the charges for the doctor's services are handled separately and are not considered for purposes of this analysis.Required:
a. Calculate the average hospital stay for all patients under each scenario listed in the table. Also, for each case calculate the occupancy rate (percentage of beds filled on average). Discuss the relation between the average length of stay and the occupancy rate.
b. Prepare an income statement showing the net income for each scenario, separating the margin earned on regular and private patients. Where is profit maximized? What are the components of the change in net income?
سؤال
سؤال
سؤال
Chateau Napa
Chateau Napa purchased a small vineyard and is now producing magnum bottles (1.5 liters) of Redwood Cabernet Sauvignon. This wine is much sought after, and bottling the wine in larger bottles enhances its quality, prestige, and demand. Because of the limited size of the vineyard, the quantity of wine produced is fixed. The only decision variable is the quality of the wine produced. Quality is a function of a host of factors: the quality of oak barrels used to age the wine, the ability of the oenologist (winemaker), the length of time it is aged, and so forth. In general, the more money spent on quality, the higher the price of the wine. Several experts rate wines, and the Wine Spectator ' s rating has become the industry standard. The following table summarizes how quality (as measured in expected Wine Spectator points with a scale of 0-100) varies with the amount of spending on quality and how various quality levels translate into price:![Chateau Napa Chateau Napa purchased a small vineyard and is now producing magnum bottles (1.5 liters) of Redwood Cabernet Sauvignon. This wine is much sought after, and bottling the wine in larger bottles enhances its quality, prestige, and demand. Because of the limited size of the vineyard, the quantity of wine produced is fixed. The only decision variable is the quality of the wine produced. Quality is a function of a host of factors: the quality of oak barrels used to age the wine, the ability of the oenologist (winemaker), the length of time it is aged, and so forth. In general, the more money spent on quality, the higher the price of the wine. Several experts rate wines, and the Wine Spectator ' s rating has become the industry standard. The following table summarizes how quality (as measured in expected Wine Spectator points with a scale of 0-100) varies with the amount of spending on quality and how various quality levels translate into price: Note: Magnums are produced in two-bottle sets. So if $115 is spent on enhancing the quality of a two-bottle set, a quality rating of 94.90 is expected and a final wholesale price Chateau Napa expects to receive is $598.52 per two-bottle set. The managers producing and marketing the Redwood Cabernet Sauvignon are evaluated and compensated based on the balanced scorecard. Just two metrics are used in their scorecard: actual quality achieved and profits per two-bottle set. Half the bonus is based on quality achieved using the following formula: Quality bonus = Maximum (0, quality achieved - 90) × 5% In other words, the managers must receive a quality rating of at least 90 points before any bonus is paid. If they achieve a perfect rating of 100 points, they receive 50 percent of their bonus [5% × (100 - 90)]. The other 50 percent of their bonus is tied to profits achieved from selling the two-bottle sets. Profits consist of the wholesale selling price less quality costs less all other operating costs ($450 per two-bottle set 12 ). The profit bonus is based on the following formula: Profit bonus = Maximum (0, profit - $30) × 10% Managers are expected to achieve profits between $30 and $35. For every dollar of profit they generate above $30, they receive 10 percent of their bonus. So if they have profits of $33.15 per set, they receive 31.5 percent [10% × ($33.15 - $30)] of their bonus. (All bonus computations are rounded to three significant digits, i.e., 46.7 percent.) Required: a. Given the balanced scorecard incentive scheme being used to reward the Redwood Cabernet Sauvignon managers, how much do you expect them to spend on quality? What quality level do they expect to achieve? How much profit per two-bottle set do they expect to earn, and what is their expected total bonus (in percent)? b. To maximize firm value, how much would Chateau Napa want the managers of Redwood Cabernet Sauvignon to spend on quality; what quality level would this spending likely yield; and how much profit does this quality level produce? c. Explain why your answers in parts ( a ) and ( b ) are either the same or different. d. Using the setting in the problem, explain what is meant by the saying You can only maximize in one dimension at a time.<div style=padding-top: 35px>](https://d2lvgg3v3hfg70.cloudfront.net/SM1503/11eb559c_84c7_fc5d_a8c8_6544d8d2e86b_SM1503_00.jpg) Note: Magnums are produced in two-bottle sets. So if $115 is spent on enhancing the quality of a two-bottle set, a quality rating of 94.90 is expected and a final wholesale price Chateau Napa expects to receive is $598.52 per two-bottle set.
Note: Magnums are produced in two-bottle sets. So if $115 is spent on enhancing the quality of a two-bottle set, a quality rating of 94.90 is expected and a final wholesale price Chateau Napa expects to receive is $598.52 per two-bottle set.
The managers producing and marketing the Redwood Cabernet Sauvignon are evaluated and compensated based on the balanced scorecard. Just two metrics are used in their scorecard: actual quality achieved and profits per two-bottle set. Half the bonus is based on quality achieved using the following formula:
Quality bonus = Maximum (0, quality achieved - 90) × 5%
In other words, the managers must receive a quality rating of at least 90 points before any bonus is paid. If they achieve a perfect rating of 100 points, they receive 50 percent of their bonus [5% × (100 - 90)]. The other 50 percent of their bonus is tied to profits achieved from selling the two-bottle sets. Profits consist of the wholesale selling price less quality costs less all other operating costs ($450 per two-bottle set 12 ). The profit bonus is based on the following formula:
Profit bonus = Maximum (0, profit - $30) × 10%
Managers are expected to achieve profits between $30 and $35. For every dollar of profit they generate above $30, they receive 10 percent of their bonus. So if they have profits of $33.15 per set, they receive 31.5 percent [10% × ($33.15 - $30)] of their bonus. (All bonus computations are rounded to three significant digits, i.e., 46.7 percent.)
Required:
a. Given the balanced scorecard incentive scheme being used to reward the Redwood Cabernet Sauvignon managers, how much do you expect them to spend on quality? What quality level do they expect to achieve? How much profit per two-bottle set do they expect to earn, and what is their expected total bonus (in percent)?
b. To maximize firm value, how much would Chateau Napa want the managers of Redwood Cabernet Sauvignon to spend on quality; what quality level would this spending likely yield; and how much profit does this quality level produce?
c. Explain why your answers in parts ( a ) and ( b ) are either the same or different.
d. Using the setting in the problem, explain what is meant by the saying "You can only maximize in one dimension at a time."
Chateau Napa purchased a small vineyard and is now producing magnum bottles (1.5 liters) of Redwood Cabernet Sauvignon. This wine is much sought after, and bottling the wine in larger bottles enhances its quality, prestige, and demand. Because of the limited size of the vineyard, the quantity of wine produced is fixed. The only decision variable is the quality of the wine produced. Quality is a function of a host of factors: the quality of oak barrels used to age the wine, the ability of the oenologist (winemaker), the length of time it is aged, and so forth. In general, the more money spent on quality, the higher the price of the wine. Several experts rate wines, and the Wine Spectator ' s rating has become the industry standard. The following table summarizes how quality (as measured in expected Wine Spectator points with a scale of 0-100) varies with the amount of spending on quality and how various quality levels translate into price:
Note: Magnums are produced in two-bottle sets. So if $115 is spent on enhancing the quality of a two-bottle set, a quality rating of 94.90 is expected and a final wholesale price Chateau Napa expects to receive is $598.52 per two-bottle set.The managers producing and marketing the Redwood Cabernet Sauvignon are evaluated and compensated based on the balanced scorecard. Just two metrics are used in their scorecard: actual quality achieved and profits per two-bottle set. Half the bonus is based on quality achieved using the following formula:
Quality bonus = Maximum (0, quality achieved - 90) × 5%
In other words, the managers must receive a quality rating of at least 90 points before any bonus is paid. If they achieve a perfect rating of 100 points, they receive 50 percent of their bonus [5% × (100 - 90)]. The other 50 percent of their bonus is tied to profits achieved from selling the two-bottle sets. Profits consist of the wholesale selling price less quality costs less all other operating costs ($450 per two-bottle set 12 ). The profit bonus is based on the following formula:
Profit bonus = Maximum (0, profit - $30) × 10%
Managers are expected to achieve profits between $30 and $35. For every dollar of profit they generate above $30, they receive 10 percent of their bonus. So if they have profits of $33.15 per set, they receive 31.5 percent [10% × ($33.15 - $30)] of their bonus. (All bonus computations are rounded to three significant digits, i.e., 46.7 percent.)
Required:
a. Given the balanced scorecard incentive scheme being used to reward the Redwood Cabernet Sauvignon managers, how much do you expect them to spend on quality? What quality level do they expect to achieve? How much profit per two-bottle set do they expect to earn, and what is their expected total bonus (in percent)?
b. To maximize firm value, how much would Chateau Napa want the managers of Redwood Cabernet Sauvignon to spend on quality; what quality level would this spending likely yield; and how much profit does this quality level produce?
c. Explain why your answers in parts ( a ) and ( b ) are either the same or different.
d. Using the setting in the problem, explain what is meant by the saying "You can only maximize in one dimension at a time."
سؤال
Telephone Computer Corporation (TCC)
Telephone Computer Corporation (TCC) manufactures and sells two computerized directory assistance computers to telephone companies. The firm has its own sales force that sells directly to the phone companies. TCC currently sells two computer systems: the Alpha and the Beta. TCC has 90 percent of the high-end market (Beta) and 50 percent of the low-end market (Alpha). The Alpha sells for $100,000. The Beta sells for $200,000 but has three times the capacity of the Alpha.
TCC has developed a new high-volume machine, Zeta, that has four times the capacity of the Beta and lower operating costs, but a price of $300,000. The unit manufacturing cost is $170,000. Users can connect the Zeta directly to mainframe computers for customer billing as well as to future expected telecommunications advancements. If the Zeta is introduced, management expects that its closest competition will be from the Beta, so most initial sales of the Zeta will come at the expense of Beta sales.
Senior management has invested considerable resources in Zeta. It believes that the future of the company is tied closely to the success of this project. Next year's operations of TCC (if the Zeta is not introduced) are:
Next Year's Projected Profits by Product without Zet a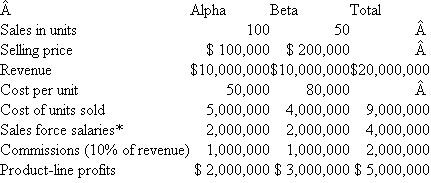 * Assigned based on commissions.
The existing sales force will sell all three types of machines. Salespeople are paid a salary plus 10 percent of sales. To sell the Zeta, salespeople with more knowledge of telecommunications and computer systems will be hired. The additional salary cost of these new employees will be $500,000. The existing sales force will still sell the Zeta but will call in these system experts to assist with the sale. The Zeta system experts are paid a flat salary, and the existing sales force's 10 percent commission incentive will not change with the introduction of the Zeta.
If the Zeta is not introduced, Alpha unit sales are projected to grow at 5 percent per year and Beta unit sales are projected to grow at 10 percent per year. Selling prices will remain constant in real terms. (Prices and salaries will grow at the inflation rate. To keep the analysis simple, all numbers should be projected in real, not nominal, terms. That is, do not adjust the numbers for inflation.)
If the Zeta is introduced, Alpha unit sales will not be affected. But Beta unit sales will be affected: All the Zeta sales will come from the Beta sales in the first year and then Beta unit sales will grow only 2 percent per year. Zeta sales will grow at 9 percent per year from an initial base of 25 machines.
Required:
Management wants to see how the preceding table on product-line profitability will appear when the Zeta model is added. In particular, management asks you to project profits for the Alpha, Beta, and Zeta for the next five years and to make a recommendation on this project. Discuss how the five-year product-line profitability projections should be presented to senior management.
Telephone Computer Corporation (TCC) manufactures and sells two computerized directory assistance computers to telephone companies. The firm has its own sales force that sells directly to the phone companies. TCC currently sells two computer systems: the Alpha and the Beta. TCC has 90 percent of the high-end market (Beta) and 50 percent of the low-end market (Alpha). The Alpha sells for $100,000. The Beta sells for $200,000 but has three times the capacity of the Alpha.
TCC has developed a new high-volume machine, Zeta, that has four times the capacity of the Beta and lower operating costs, but a price of $300,000. The unit manufacturing cost is $170,000. Users can connect the Zeta directly to mainframe computers for customer billing as well as to future expected telecommunications advancements. If the Zeta is introduced, management expects that its closest competition will be from the Beta, so most initial sales of the Zeta will come at the expense of Beta sales.
Senior management has invested considerable resources in Zeta. It believes that the future of the company is tied closely to the success of this project. Next year's operations of TCC (if the Zeta is not introduced) are:
Next Year's Projected Profits by Product without Zet a
* Assigned based on commissions.The existing sales force will sell all three types of machines. Salespeople are paid a salary plus 10 percent of sales. To sell the Zeta, salespeople with more knowledge of telecommunications and computer systems will be hired. The additional salary cost of these new employees will be $500,000. The existing sales force will still sell the Zeta but will call in these system experts to assist with the sale. The Zeta system experts are paid a flat salary, and the existing sales force's 10 percent commission incentive will not change with the introduction of the Zeta.
If the Zeta is not introduced, Alpha unit sales are projected to grow at 5 percent per year and Beta unit sales are projected to grow at 10 percent per year. Selling prices will remain constant in real terms. (Prices and salaries will grow at the inflation rate. To keep the analysis simple, all numbers should be projected in real, not nominal, terms. That is, do not adjust the numbers for inflation.)
If the Zeta is introduced, Alpha unit sales will not be affected. But Beta unit sales will be affected: All the Zeta sales will come from the Beta sales in the first year and then Beta unit sales will grow only 2 percent per year. Zeta sales will grow at 9 percent per year from an initial base of 25 machines.
Required:
Management wants to see how the preceding table on product-line profitability will appear when the Zeta model is added. In particular, management asks you to project profits for the Alpha, Beta, and Zeta for the next five years and to make a recommendation on this project. Discuss how the five-year product-line profitability projections should be presented to senior management.
سؤال
Fiedler International
You work on a team that reports to the chief financial officer of Fiedler International, a consumer products company that manages a variety of consumer beauty brands (shampoos, facial soaps, deodorants). Your team evaluates possible acquisitions. You are currently analyzing the possible purchase of Lush, a manufacturer of face moisturizers with UV sun blockers. Lush is a small publicly traded company that has no single large shareholder. Most of the stock is held by institutional investors and Lush managers hold a small percentage of the stock.
The materials you have received from Lush include information about its senior management performance evaluation and incentive compensation plans. Lush uses a balanced scorecard to evaluate and reward senior managers. Managers can earn up to 50 percent of their salary as a bonus depending on four balanced scorecard metrics: customer service, human resources and innovation, operational efficiency, and financial performance. Each of the four metrics is scaled between 0 and 1. Senior managers receive up to 25 percent of their bonus for each metric. If the customer service metric is 0.67, and a particular manager's salary is $400,000, then for customer service, that manager receives $33,500 (50% × $400,000 × 0.67 × 25%). The compensation committee of Lush's board of directors sets the scale for each of the four metrics. For example, the financial performance metric is economic value added, or EVA. Last year's EVA was $13 million. The compensation committee sets the lower and upper bound of EVA as $12 million and $16 million. Hence, if the current year's EVA is $12 million, the financial performance metric is 0. If EVA is $15 million, the metric is 0.75 [($15 - $12)/($16 - 12)], and the manager earning the $400,000 salary would receive a bonus of $37,500 (50% × $400,000 × 0.75 × 25%).
Fourteen separate metrics are used to compute the four metrics. The following metrics are computed and then aggregated to form the four metrics:![Fiedler International You work on a team that reports to the chief financial officer of Fiedler International, a consumer products company that manages a variety of consumer beauty brands (shampoos, facial soaps, deodorants). Your team evaluates possible acquisitions. You are currently analyzing the possible purchase of Lush, a manufacturer of face moisturizers with UV sun blockers. Lush is a small publicly traded company that has no single large shareholder. Most of the stock is held by institutional investors and Lush managers hold a small percentage of the stock. The materials you have received from Lush include information about its senior management performance evaluation and incentive compensation plans. Lush uses a balanced scorecard to evaluate and reward senior managers. Managers can earn up to 50 percent of their salary as a bonus depending on four balanced scorecard metrics: customer service, human resources and innovation, operational efficiency, and financial performance. Each of the four metrics is scaled between 0 and 1. Senior managers receive up to 25 percent of their bonus for each metric. If the customer service metric is 0.67, and a particular manager's salary is $400,000, then for customer service, that manager receives $33,500 (50% × $400,000 × 0.67 × 25%). The compensation committee of Lush's board of directors sets the scale for each of the four metrics. For example, the financial performance metric is economic value added, or EVA. Last year's EVA was $13 million. The compensation committee sets the lower and upper bound of EVA as $12 million and $16 million. Hence, if the current year's EVA is $12 million, the financial performance metric is 0. If EVA is $15 million, the metric is 0.75 [($15 - $12)/($16 - 12)], and the manager earning the $400,000 salary would receive a bonus of $37,500 (50% × $400,000 × 0.75 × 25%). Fourteen separate metrics are used to compute the four metrics. The following metrics are computed and then aggregated to form the four metrics: Lush has been using the balanced scorecard for three years and the achieved levels of each metric for the last three years are: Required: Write a memo to your acquisition team describing balanced scorecards and the primary reasons they are used, and the likely affect of Lush's use of the balanced scorecard in terms of how Fiedler should be evaluating Lush. Specifically: ( a ) briefly describe balanced scorecards and why firms use them and ( b ) analyze Lush's use of the balanced scorecard and how this might affect Fiedler's evaluation of Lush as a possible takeover target.<div style=padding-top: 35px>](https://d2lvgg3v3hfg70.cloudfront.net/SM1503/11eb559c_84cc_9046_a8c8_95c910fd1e89_SM1503_00.jpg) Lush has been using the balanced scorecard for three years and the achieved levels of each metric for the last three years are:
Lush has been using the balanced scorecard for three years and the achieved levels of each metric for the last three years are: ![Fiedler International You work on a team that reports to the chief financial officer of Fiedler International, a consumer products company that manages a variety of consumer beauty brands (shampoos, facial soaps, deodorants). Your team evaluates possible acquisitions. You are currently analyzing the possible purchase of Lush, a manufacturer of face moisturizers with UV sun blockers. Lush is a small publicly traded company that has no single large shareholder. Most of the stock is held by institutional investors and Lush managers hold a small percentage of the stock. The materials you have received from Lush include information about its senior management performance evaluation and incentive compensation plans. Lush uses a balanced scorecard to evaluate and reward senior managers. Managers can earn up to 50 percent of their salary as a bonus depending on four balanced scorecard metrics: customer service, human resources and innovation, operational efficiency, and financial performance. Each of the four metrics is scaled between 0 and 1. Senior managers receive up to 25 percent of their bonus for each metric. If the customer service metric is 0.67, and a particular manager's salary is $400,000, then for customer service, that manager receives $33,500 (50% × $400,000 × 0.67 × 25%). The compensation committee of Lush's board of directors sets the scale for each of the four metrics. For example, the financial performance metric is economic value added, or EVA. Last year's EVA was $13 million. The compensation committee sets the lower and upper bound of EVA as $12 million and $16 million. Hence, if the current year's EVA is $12 million, the financial performance metric is 0. If EVA is $15 million, the metric is 0.75 [($15 - $12)/($16 - 12)], and the manager earning the $400,000 salary would receive a bonus of $37,500 (50% × $400,000 × 0.75 × 25%). Fourteen separate metrics are used to compute the four metrics. The following metrics are computed and then aggregated to form the four metrics: Lush has been using the balanced scorecard for three years and the achieved levels of each metric for the last three years are: Required: Write a memo to your acquisition team describing balanced scorecards and the primary reasons they are used, and the likely affect of Lush's use of the balanced scorecard in terms of how Fiedler should be evaluating Lush. Specifically: ( a ) briefly describe balanced scorecards and why firms use them and ( b ) analyze Lush's use of the balanced scorecard and how this might affect Fiedler's evaluation of Lush as a possible takeover target.<div style=padding-top: 35px>](https://d2lvgg3v3hfg70.cloudfront.net/SM1503/11eb559c_84cc_9047_a8c8_5b51a7500ff0_SM1503_00.jpg) Required:
Required:
Write a memo to your acquisition team describing balanced scorecards and the primary reasons they are used, and the likely affect of Lush's use of the balanced scorecard in terms of how Fiedler should be evaluating Lush. Specifically: ( a ) briefly describe balanced scorecards and why firms use them and ( b ) analyze Lush's use of the balanced scorecard and how this might affect Fiedler's evaluation of Lush as a possible takeover target.
You work on a team that reports to the chief financial officer of Fiedler International, a consumer products company that manages a variety of consumer beauty brands (shampoos, facial soaps, deodorants). Your team evaluates possible acquisitions. You are currently analyzing the possible purchase of Lush, a manufacturer of face moisturizers with UV sun blockers. Lush is a small publicly traded company that has no single large shareholder. Most of the stock is held by institutional investors and Lush managers hold a small percentage of the stock.
The materials you have received from Lush include information about its senior management performance evaluation and incentive compensation plans. Lush uses a balanced scorecard to evaluate and reward senior managers. Managers can earn up to 50 percent of their salary as a bonus depending on four balanced scorecard metrics: customer service, human resources and innovation, operational efficiency, and financial performance. Each of the four metrics is scaled between 0 and 1. Senior managers receive up to 25 percent of their bonus for each metric. If the customer service metric is 0.67, and a particular manager's salary is $400,000, then for customer service, that manager receives $33,500 (50% × $400,000 × 0.67 × 25%). The compensation committee of Lush's board of directors sets the scale for each of the four metrics. For example, the financial performance metric is economic value added, or EVA. Last year's EVA was $13 million. The compensation committee sets the lower and upper bound of EVA as $12 million and $16 million. Hence, if the current year's EVA is $12 million, the financial performance metric is 0. If EVA is $15 million, the metric is 0.75 [($15 - $12)/($16 - 12)], and the manager earning the $400,000 salary would receive a bonus of $37,500 (50% × $400,000 × 0.75 × 25%).
Fourteen separate metrics are used to compute the four metrics. The following metrics are computed and then aggregated to form the four metrics:
Lush has been using the balanced scorecard for three years and the achieved levels of each metric for the last three years are: Required: Write a memo to your acquisition team describing balanced scorecards and the primary reasons they are used, and the likely affect of Lush's use of the balanced scorecard in terms of how Fiedler should be evaluating Lush. Specifically: ( a ) briefly describe balanced scorecards and why firms use them and ( b ) analyze Lush's use of the balanced scorecard and how this might affect Fiedler's evaluation of Lush as a possible takeover target.
سؤال
Productivity Measures
Background
Economists and managers have long recognized the importance of productivity in determining an organization's success. Productivity is the relation between the firm's output of goods and services and the inputs necessary to produce that output. If a firm is able to produce more output with the same inputs, we say it has improved its productivity. Likewise, if two firms produce the same quantity of goods and services but one firm uses less input, that firm is called more productive. Countries that produce more output per person generate more consumable wealth. Economists keep productivity statistics, and these numbers are reported in the financial press as measuring the competitiveness and well-being of that country.
In the 1970s many of the largest U.S. firms became interested in productivity and better ways to measure and improve their firms' productivity. Largely driven by foreign competition, these American firms were losing market share to Japanese and European rivals. Japanese auto companies were producing cars with fewer employee hours per car than American companies, thus offering lower-priced and often higher-quality cars than U.S. automakers. Foreign steel producers were more productive than their U.S. counterparts. Concerned about their declining relative productivity in 1977, large U.S. firms financed the formation of the American Productivity Center (later the American Productivity and Quality Center). To become more productive, some firms experimented with various productivity measures.
In its most basic form, productivity is defined as: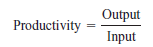
If the firm uses a single input (steel) to produce a single homogeneous product (horseshoes) that never changes over time, then the measure of productivity is the units of output per quantity of input, or the number of horseshoes per pound of steel. If steel waste is reduced, more horseshoes can be produced with the same amount of steel. One measure of productivity is the ratio of horseshoes to steel, in terms of physical volume. Steel is not the only input to making horseshoes. Labor is also an input, and labor is usually the input of most interest to managers. Productivity is usually thought of as the amount of output per unit of labor. Most managers want to know the number of horseshoes produced per person and how this number changes over time and compares to the competition.
Proponents of productivity measurement systems argue that managers should focus on productivity instead of accounting profits. A firm can appear profitable but can be experiencing declining productivity if selling prices are rising faster than input prices. Productivity measures help identify these cases. Managers control the physical aspects of the manufacturing process, such as the amount of steel scrap in making horseshoes, but they cannot control the price of steel or the price of horseshoes. For the most part, managers cannot influence prices but must take them as a given and try to produce more output from a given physical input or the same output using less physical input.
Proponents of productivity measures argue that basing managerial performance on productivity, which does not include uncontrollable price changes, yields a better indicator of the manager's performance. They argue that traditional accounting measures, such as net income, include many factors that managers cannot control and do not focus enough attention on factors that managers can control such as labor productivity. The following example illustrates productivity measurement systems in more detail.
Measuring productivity
If the firm produces several types of outputs (large and small horseshoes) and the mix of output varies over time, then the productivity measure must somehow aggregate the quantities of outputs into a single aggregate quantity. Likewise, several inputs must be aggregated to derive a homogeneous input measure. The measure of productivity (outputs/inputs) must aggregate the multiple inputs and the multiple outputs.
To measure firmwide productivity when multiple inputs and outputs exist, prices are used as the weighting factors. The productivity measure with two outputs and three inputs becomes: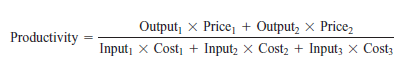
Output ( i = 1 or 2) and input j ( j = 1, 2, or 3) denote the physical quantities of the i th output and the j th input. Price i and cost j are the corresponding output prices and input costs. If one then compares how productivity changes over time, this aggregate measure of productivity will vary with changes in both physical quantities and relative prices. But productivity measures should exclude noncontrollable price and cost changes, thereby focusing managers' attention on physical quantities.
To exclude price and cost changes from the performance measure, yet still have a way to aggregate multiple inputs and outputs, the following scheme is used:
1. Choose a base period year and use that year's prices and costs as the weights for future years. The base year should be one of high production, and a new base year should be chosen about every five years as the structures of production and prices change.
2. Weight the physical quantity of each input and output using the base period cost or price for that input or output.
3. Divide the weighted outputs by weighted inputs to compute the productivity index for the year.
4. Divide this year's productivity index by last year's to get the change in productivity.
A simple example with two inputs (steel and labor) and two outputs (small and large horseshoes) illustrates the mechanics of the computations. The following data summarize operations for the last two years:
TABLE 1 Physical Quantitie s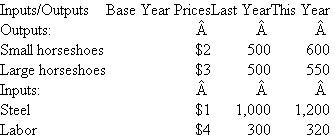 Based on these data, the productivity measures are calculated as:
TABLE 2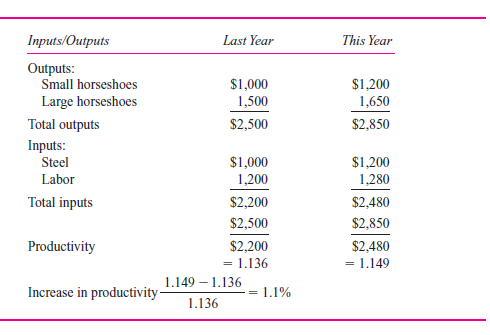
Total productivity increased from 1.136 last year to 1.149 this year, or a 1.1 percent increase. Using base period prices, the productivity measure indicates that more output was produced using relatively less input.
In a study of productivity systems in Canada, few firms were found to measure aggregate firmwide productivity as the ratio of firm outputs to firm inputs. Instead, firms develop a few distinct nonfinancial measures that capture the essential strategic elements of their business. For example, a steel company tracks tons of steel shipped divided by tons of iron purchased and tons of steel shipped divided by number of employees. In an insurance company, the number of policies processed per employee in a particular department is reported. Other companies measure yield rates, defect rates, and production rates. The study concludes (p. 132), "We believe that productivity measures are operational aids in the strategic process that helps organization members keep track of what is required for the organization to achieve its long-run goals."
Required:
a. Critically analyze the productivity calculations in Table 2. Did the managers of the firm perform better this year compared with last year, as the productivity measures indicate?
b. Discuss some plausible reasons why comprehensive productivity systems have not been widely adopted by organizations.
c. Consider the situation of Burk Wheels. Burk Wheels manufactures aluminum automobile wheels (onto which rubber tires are mounted). The owner, Gerry Burk, is worried about increased competition from foreign countries (with lower labor costs) and is seeking to increase the productivity of her workers. She decides to implement a bonus system for direct line supervisors and department managers to reward them for improving labor productivity. In particular, supervisors will receive bonuses if they improve their department's labor productivity, defined as Output ÷ Labor hours. The casting department is the primary production process whereby molten aluminum is poured into molds, cooled, and then removed to form the wheels. Operating data for the casting department for the last two months prior to announcing the labor productivity incentive program are: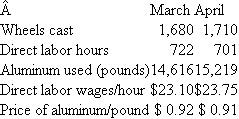 Calculate the productivity of direct labor for March and April and discuss how labor productivity changed between March and April. Gerry Burk asks your opinion of her proposal to increase productivity by rewarding production supervisors and plant departmental managers for increasing labor productivity. Write Ms. Burk a memo outlining your views of her plan.
Background
Economists and managers have long recognized the importance of productivity in determining an organization's success. Productivity is the relation between the firm's output of goods and services and the inputs necessary to produce that output. If a firm is able to produce more output with the same inputs, we say it has improved its productivity. Likewise, if two firms produce the same quantity of goods and services but one firm uses less input, that firm is called more productive. Countries that produce more output per person generate more consumable wealth. Economists keep productivity statistics, and these numbers are reported in the financial press as measuring the competitiveness and well-being of that country.
In the 1970s many of the largest U.S. firms became interested in productivity and better ways to measure and improve their firms' productivity. Largely driven by foreign competition, these American firms were losing market share to Japanese and European rivals. Japanese auto companies were producing cars with fewer employee hours per car than American companies, thus offering lower-priced and often higher-quality cars than U.S. automakers. Foreign steel producers were more productive than their U.S. counterparts. Concerned about their declining relative productivity in 1977, large U.S. firms financed the formation of the American Productivity Center (later the American Productivity and Quality Center). To become more productive, some firms experimented with various productivity measures.
In its most basic form, productivity is defined as:
If the firm uses a single input (steel) to produce a single homogeneous product (horseshoes) that never changes over time, then the measure of productivity is the units of output per quantity of input, or the number of horseshoes per pound of steel. If steel waste is reduced, more horseshoes can be produced with the same amount of steel. One measure of productivity is the ratio of horseshoes to steel, in terms of physical volume. Steel is not the only input to making horseshoes. Labor is also an input, and labor is usually the input of most interest to managers. Productivity is usually thought of as the amount of output per unit of labor. Most managers want to know the number of horseshoes produced per person and how this number changes over time and compares to the competition.
Proponents of productivity measurement systems argue that managers should focus on productivity instead of accounting profits. A firm can appear profitable but can be experiencing declining productivity if selling prices are rising faster than input prices. Productivity measures help identify these cases. Managers control the physical aspects of the manufacturing process, such as the amount of steel scrap in making horseshoes, but they cannot control the price of steel or the price of horseshoes. For the most part, managers cannot influence prices but must take them as a given and try to produce more output from a given physical input or the same output using less physical input.
Proponents of productivity measures argue that basing managerial performance on productivity, which does not include uncontrollable price changes, yields a better indicator of the manager's performance. They argue that traditional accounting measures, such as net income, include many factors that managers cannot control and do not focus enough attention on factors that managers can control such as labor productivity. The following example illustrates productivity measurement systems in more detail.
Measuring productivity
If the firm produces several types of outputs (large and small horseshoes) and the mix of output varies over time, then the productivity measure must somehow aggregate the quantities of outputs into a single aggregate quantity. Likewise, several inputs must be aggregated to derive a homogeneous input measure. The measure of productivity (outputs/inputs) must aggregate the multiple inputs and the multiple outputs.
To measure firmwide productivity when multiple inputs and outputs exist, prices are used as the weighting factors. The productivity measure with two outputs and three inputs becomes:
Output ( i = 1 or 2) and input j ( j = 1, 2, or 3) denote the physical quantities of the i th output and the j th input. Price i and cost j are the corresponding output prices and input costs. If one then compares how productivity changes over time, this aggregate measure of productivity will vary with changes in both physical quantities and relative prices. But productivity measures should exclude noncontrollable price and cost changes, thereby focusing managers' attention on physical quantities.
To exclude price and cost changes from the performance measure, yet still have a way to aggregate multiple inputs and outputs, the following scheme is used:
1. Choose a base period year and use that year's prices and costs as the weights for future years. The base year should be one of high production, and a new base year should be chosen about every five years as the structures of production and prices change.
2. Weight the physical quantity of each input and output using the base period cost or price for that input or output.
3. Divide the weighted outputs by weighted inputs to compute the productivity index for the year.
4. Divide this year's productivity index by last year's to get the change in productivity.
A simple example with two inputs (steel and labor) and two outputs (small and large horseshoes) illustrates the mechanics of the computations. The following data summarize operations for the last two years:
TABLE 1 Physical Quantitie s
Based on these data, the productivity measures are calculated as:TABLE 2
Total productivity increased from 1.136 last year to 1.149 this year, or a 1.1 percent increase. Using base period prices, the productivity measure indicates that more output was produced using relatively less input.
In a study of productivity systems in Canada, few firms were found to measure aggregate firmwide productivity as the ratio of firm outputs to firm inputs. Instead, firms develop a few distinct nonfinancial measures that capture the essential strategic elements of their business. For example, a steel company tracks tons of steel shipped divided by tons of iron purchased and tons of steel shipped divided by number of employees. In an insurance company, the number of policies processed per employee in a particular department is reported. Other companies measure yield rates, defect rates, and production rates. The study concludes (p. 132), "We believe that productivity measures are operational aids in the strategic process that helps organization members keep track of what is required for the organization to achieve its long-run goals."
Required:
a. Critically analyze the productivity calculations in Table 2. Did the managers of the firm perform better this year compared with last year, as the productivity measures indicate?
b. Discuss some plausible reasons why comprehensive productivity systems have not been widely adopted by organizations.
c. Consider the situation of Burk Wheels. Burk Wheels manufactures aluminum automobile wheels (onto which rubber tires are mounted). The owner, Gerry Burk, is worried about increased competition from foreign countries (with lower labor costs) and is seeking to increase the productivity of her workers. She decides to implement a bonus system for direct line supervisors and department managers to reward them for improving labor productivity. In particular, supervisors will receive bonuses if they improve their department's labor productivity, defined as Output ÷ Labor hours. The casting department is the primary production process whereby molten aluminum is poured into molds, cooled, and then removed to form the wheels. Operating data for the casting department for the last two months prior to announcing the labor productivity incentive program are:
Calculate the productivity of direct labor for March and April and discuss how labor productivity changed between March and April. Gerry Burk asks your opinion of her proposal to increase productivity by rewarding production supervisors and plant departmental managers for increasing labor productivity. Write Ms. Burk a memo outlining your views of her plan. سؤال
Guest Watches
Guest Watches is a division of Guest Fashions, a large, international fashion designer. Guest Watches manufactures highly stylish watches for young adults (age 18 to 30) who are fashion conscious. It is a profit center and its senior management's compensation is tied closely to the reported profits. While Guest Watches has succeeded in capturing the fashion market, product dependability is eroding these gains. A number of retailers have dropped or are threatening to drop the Guest watch line because of customer returns. Guest watches carry a one-year warranty and 12 percent are returned, compared with an industry average of 4 percent. Besides high warranty costs and lost sales due to reputation, Guest Watches has higher-than-industry-average manufacturing scrap and rework costs.
Senior management, worried about these trends and the possible erosion of its market dominance, hired a consulting firm to study the problem and make recommendations for reversing the situation. After a thorough analysis of Guest Watches's customers, suppliers, and manufacturing facilities, the consultants recommended five possible actions ranging from the status quo to a complete Total Quality Management, Zero Defects program (level IV). The accompanying table outlines the various alternatives for Guest Watches. (Dollar figures are in thousands.)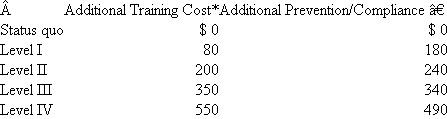 * Includes the annual costs of training employees in TQM methods.
† All annual costs including certifying suppliers, redesigning the product, and
inspection costs to reduce defects.
The consultants emphasized that while first-year startup costs are slightly higher than in subsequent years, management must really view the above cost estimates as annual ongoing costs. Given employee turnover and supplier changes, training, prevention, and compliance costs are not likely to decline over time.
The consulting firm and the newly appointed vice president for quality programs estimated that under level IV, rework and scrap would be $25,000 and warranty costs zero. Level IV was needed to get the firm to zero defects. A task force was convened and after several meetings generated the following estimates of rework/scrap and warranty costs for the various levels of firm commitment: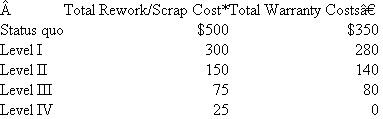 * The costs of manufacturing scrap and rework.
† The costs of repairing and replacing products that fail in the hands of customers.
There was considerable discussion and debate about the quantitative impact of increased quality on additional sales. While no hard and fast numbers could be derived, the consensus view was that the total net cash flows (contribution margin) from additional sales as retailers and customers learn of the reduced defect rate would be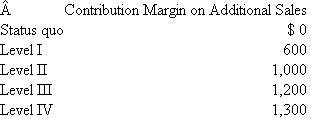 Required:
a. Assuming that the data as presented are reasonably accurate, what should Guest Watches do about its deteriorating quality situation? Should it maintain the status quo or should it adopt the consultants' recommendation and implement level I, II, III, or IV?
b. Evaluate the analysis underlying your policy recommendation in ( a ). Will the senior management of the Watch Division make the same decision as the senior management of Guest Fashions?
Guest Watches is a division of Guest Fashions, a large, international fashion designer. Guest Watches manufactures highly stylish watches for young adults (age 18 to 30) who are fashion conscious. It is a profit center and its senior management's compensation is tied closely to the reported profits. While Guest Watches has succeeded in capturing the fashion market, product dependability is eroding these gains. A number of retailers have dropped or are threatening to drop the Guest watch line because of customer returns. Guest watches carry a one-year warranty and 12 percent are returned, compared with an industry average of 4 percent. Besides high warranty costs and lost sales due to reputation, Guest Watches has higher-than-industry-average manufacturing scrap and rework costs.
Senior management, worried about these trends and the possible erosion of its market dominance, hired a consulting firm to study the problem and make recommendations for reversing the situation. After a thorough analysis of Guest Watches's customers, suppliers, and manufacturing facilities, the consultants recommended five possible actions ranging from the status quo to a complete Total Quality Management, Zero Defects program (level IV). The accompanying table outlines the various alternatives for Guest Watches. (Dollar figures are in thousands.)
* Includes the annual costs of training employees in TQM methods.† All annual costs including certifying suppliers, redesigning the product, and
inspection costs to reduce defects.
The consultants emphasized that while first-year startup costs are slightly higher than in subsequent years, management must really view the above cost estimates as annual ongoing costs. Given employee turnover and supplier changes, training, prevention, and compliance costs are not likely to decline over time.
The consulting firm and the newly appointed vice president for quality programs estimated that under level IV, rework and scrap would be $25,000 and warranty costs zero. Level IV was needed to get the firm to zero defects. A task force was convened and after several meetings generated the following estimates of rework/scrap and warranty costs for the various levels of firm commitment:
* The costs of manufacturing scrap and rework.† The costs of repairing and replacing products that fail in the hands of customers.
There was considerable discussion and debate about the quantitative impact of increased quality on additional sales. While no hard and fast numbers could be derived, the consensus view was that the total net cash flows (contribution margin) from additional sales as retailers and customers learn of the reduced defect rate would be
Required: a. Assuming that the data as presented are reasonably accurate, what should Guest Watches do about its deteriorating quality situation? Should it maintain the status quo or should it adopt the consultants' recommendation and implement level I, II, III, or IV?
b. Evaluate the analysis underlying your policy recommendation in ( a ). Will the senior management of the Watch Division make the same decision as the senior management of Guest Fashions?

فتح الحزمة
قم بالتسجيل لفتح البطاقات في هذه المجموعة!
Unlock Deck
Unlock Deck
1/18
العب
ملء الشاشة (f)
Deck 14: Management Accounting in a Changing Environment
1
Applying TQM in Manufacturing versus Administration
One large company that has been successful in applying Total Quality Management (TQM) principles in manufacturing reports that it has had less success in applying the same techniques in improving administrative functions such as order taking, distribution, and human resources. This company (which has won several quality awards and has significantly improved its product quality) used state-of-the-art TQM methods to train all of its employees in how to apply TQM. However, the company has not been able to achieve the same cost reductions and service quality enhancements in administrative areas as it has in the manufacturing area. Assuming that this phenomenon extends to other companies, why do you think that TQM works better in manufacturing than in nonmanufacturing/service areas?
One large company that has been successful in applying Total Quality Management (TQM) principles in manufacturing reports that it has had less success in applying the same techniques in improving administrative functions such as order taking, distribution, and human resources. This company (which has won several quality awards and has significantly improved its product quality) used state-of-the-art TQM methods to train all of its employees in how to apply TQM. However, the company has not been able to achieve the same cost reductions and service quality enhancements in administrative areas as it has in the manufacturing area. Assuming that this phenomenon extends to other companies, why do you think that TQM works better in manufacturing than in nonmanufacturing/service areas?
The ability of TQM to deliver cost savings and performance enhancements depends directly on how easy it is to measure and observe the output of the process. If a TQM team's output is easy to measure, it is easier to hold the team members responsible for improving quality. If quality improvements are difficult to observe, then holding team members responsible imposes more risk on them. It is easier for them to argue that they didn't achieve their goals because they were hard to observe. If the benefits from TQM are lower because it is more difficult to observe the TQM output, less will be invested in such activities.
Measuring quality improvements in a manufactured process tends to be easier than a service. Engineering standards can be set for a manufactured good and conformance to the standards can be relatively easy to measure. But the output of many administrative departments is multidimensional and often hard to observe. Manufacturing involves repetitive processes with few exceptions. Administrative functions often involve handling numerous exceptions. It is likely to be easier to observe quality improvements in a television set than it is in a human resources department or a legal department.
Measuring quality improvements in a manufactured process tends to be easier than a service. Engineering standards can be set for a manufactured good and conformance to the standards can be relatively easy to measure. But the output of many administrative departments is multidimensional and often hard to observe. Manufacturing involves repetitive processes with few exceptions. Administrative functions often involve handling numerous exceptions. It is likely to be easier to observe quality improvements in a television set than it is in a human resources department or a legal department.
2
Old Town Roasters
Old Town Roasters (OTR) owns and operates a chain of 12 coffee shops around town. OTR's strategy is to provide the highest-quality coffee and baked goods in a warm, friendly environment. Each OTR provides its customers Internet access and current newspapers. Some shops are open 24 hours a day, especially those located around college campuses. Each shop manager is responsible for deciding the hours that the store is open, the selection of baked goods to stock, and the number of Internet terminals to provide in the store.
Required:
Design a balanced scorecard to evaluate and reward the manager of each shop.
Balance Scorecard:
It is a planning tool or technique which is being used by many organizations worldwide. It helps in using the main products or services of the organization towards the completion of objectives and plans of the organization.
Balance Scorecard also helps in formulating various techniques due to which the daily working is aligned in connection with the goals of the organization.
For any organization, balance scorecard plays an important for its stability and providing various ways to counter many difficult situations. The balanced scorecard should have many important aspects of influencing the organization team for the betterment of work and results. The four main perspective of the balanced scorecard is as follows:
1.Perspective Related to Finance:
Under this, the management of the company should try to increase the wealth of the company by investing in higher return generating projects with a lower rate of interest as per the rules of the balance scorecard techniques.
2.Perspective Related to Customer:
Every organization who has adopted the balanced scorecard should always keen towards increasing its customer base and work towards the satisfaction of their customers.
3.The perspective of Internal Business:
This perspective is linked with the internal controls implemented by the organization. These controls help the staff and the management to work efficiently and proving the services to the customers on time so that they do not have to wait for getting the service.
4.Perspective in relation to learning and growth:
This perspective is completely focused upon the working of the employees in the organization as it deals with the training of employees from time to time. The employees are also ordered to learn new innovative ideas which will help the company in the long run.
3
The Pottery Store
The Pottery Store is a chain of retail stores in upscale malls that sells pottery, woodcarvings, and other craft items. The typical customer is shopping for a gift and spends between $50 and $200. Buyers in the corporate office contact artists around the country and buy inventory for the stores. Corporate headquarters sets the final selling price for each item and determines when to mark them down for sales. Each store manager is responsible for store staffing and layout. Store managers do not have responsibility for choosing the merchandise, store hours (set by the mall), or pricing decisions.
Required:
a. Design a balanced scorecard for the store managers.
b. How would your answer to ( a ) change if the store managers also had decision-making responsibilities for both selecting the merchandise to carry in the store and pricing?
a.The balanced scorecard should have four measures:
Financial perspective. Sales less the cost of labor and any other expenses the store manager controls (such as utilities and maintenance)
Customer perspective. Customer satisfaction as measured by survey cards asking feedback on the store's appearance, service, friendliness of service providers, and so forth. Sales growth.
Internal business perspective. Breakage and shrinkage.
Learning and growth perspective. Employee turnover.
b.If the manager has decision-making responsibilities over inventory and pricing, the financial perspective should include either return on assets or economic value added. These metrics create better incentives to control excessive inventory and also reward managers for setting prices that maximize firm value.
4
Software Development Inc.
Software Development Inc. (SDI) produces and markets software for personal computers, including spreadsheet, word processing, desktop publishing, and database management programs. SDI has annual sales of $800 million.
Producing software is a time-consuming, labor-intensive process. Software quality is an extremely important aspect of success in computer software markets. One aspect of quality is program reliability. Does the software perform as expected? Does it work with other software in terms of data transfers and interfaces? Does it terminate abnormally? In spite of extensive testing of the software, programs always contain some bugs. Once the software is released, SDI stands behind the product with phone-in customer service consultants who answer questions and help the customer work around problems in the software. SDI's software maintenance group fixes bugs and sends out revised versions of the programs to customers.
SDI tracks the relation between quality costs and quality. The quality measure it uses is the number of documented bugs in a software package. These bugs are counted when a customer calls in with a complaint and the SDI customer service representative determines that this is a new problem. The software maintenance programmers then attempt to fix the program and eliminate the bug. To manage quality, SDI tracks quality costs. It has released 38 new packages or major revisions in existing packages in the last three years. The accompanying table reports the number of defects (bugs) documented in the first six months following release. Also listed in the table are total product cost and quality cost per software package release.
Product costs include all the costs incurred to produce and market the software, excluding the quality costs in the table. Quality costs consist of three components: training, prevention, and software maintenance and customer service costs. Training costs are expenditures for educating the programmers and updating their training. Better-educated programmers produce fewer bugs. Prevention costs include expenditures for testing the software before it is released. Maintenance and customer service costs include (1) the programmers charged with fixing the bugs and reissuing the revised software and (2) the customer service representatives answering phone questions. The training and prevention costs are measured over the period the software was being developed. The number of defects and maintenance and service costs are measured in the first six months following release.
SDI Defects and Quality Costs by Program Release* * Per 100,000 lines of computer code.
All the numbers in the table have been divided by lines of computer code in the particular program release. Programs with more lines of code cost more and also have more bugs. Prior studies find that using lines of code is an acceptable way to control for program complexity. Thus, the numbers in the table are stated in terms of defects and cost per 100,000 lines of code.
The figure below plots the relation between total cost and number of defects. The vice president of quality of SDI likes to use it to emphasize that costs and quality are inversely related. She is fond of saying, "Quality pays! Our total costs fall as the number of defects declines. The more we spend on quality, the lower our costs."
SDI total costs by defects
Required:
Critically evaluate the vice president's analysis.
Software Development Inc. (SDI) produces and markets software for personal computers, including spreadsheet, word processing, desktop publishing, and database management programs. SDI has annual sales of $800 million.
Producing software is a time-consuming, labor-intensive process. Software quality is an extremely important aspect of success in computer software markets. One aspect of quality is program reliability. Does the software perform as expected? Does it work with other software in terms of data transfers and interfaces? Does it terminate abnormally? In spite of extensive testing of the software, programs always contain some bugs. Once the software is released, SDI stands behind the product with phone-in customer service consultants who answer questions and help the customer work around problems in the software. SDI's software maintenance group fixes bugs and sends out revised versions of the programs to customers.
SDI tracks the relation between quality costs and quality. The quality measure it uses is the number of documented bugs in a software package. These bugs are counted when a customer calls in with a complaint and the SDI customer service representative determines that this is a new problem. The software maintenance programmers then attempt to fix the program and eliminate the bug. To manage quality, SDI tracks quality costs. It has released 38 new packages or major revisions in existing packages in the last three years. The accompanying table reports the number of defects (bugs) documented in the first six months following release. Also listed in the table are total product cost and quality cost per software package release.
Product costs include all the costs incurred to produce and market the software, excluding the quality costs in the table. Quality costs consist of three components: training, prevention, and software maintenance and customer service costs. Training costs are expenditures for educating the programmers and updating their training. Better-educated programmers produce fewer bugs. Prevention costs include expenditures for testing the software before it is released. Maintenance and customer service costs include (1) the programmers charged with fixing the bugs and reissuing the revised software and (2) the customer service representatives answering phone questions. The training and prevention costs are measured over the period the software was being developed. The number of defects and maintenance and service costs are measured in the first six months following release.
SDI Defects and Quality Costs by Program Release*
* Per 100,000 lines of computer code.All the numbers in the table have been divided by lines of computer code in the particular program release. Programs with more lines of code cost more and also have more bugs. Prior studies find that using lines of code is an acceptable way to control for program complexity. Thus, the numbers in the table are stated in terms of defects and cost per 100,000 lines of code.
The figure below plots the relation between total cost and number of defects. The vice president of quality of SDI likes to use it to emphasize that costs and quality are inversely related. She is fond of saying, "Quality pays! Our total costs fall as the number of defects declines. The more we spend on quality, the lower our costs."
SDI total costs by defects
Required:
Critically evaluate the vice president's analysis.
فتح الحزمة
افتح القفل للوصول البطاقات البالغ عددها 18 في هذه المجموعة.
فتح الحزمة
k this deck
5
Stirling Acquisition
You are working for an investment banking firm. One of your clients is examining the possibility of purchasing Stirling Manufacturing, a parts supplier (specifically, tail-light assemblies) to the automobile industry. Stirling has sales of $130 million and assets of $93 million.
Your client has asked your firm to evaluate Stirling (a privately held company) and indicate how much should be paid for Stirling. Stirling has a batch-manufacturing process. Raw materials inventories are held until they are placed into production. Batches of between 2,000 and 2,500 tail-light assemblies are manufactured. These are then delivered daily, 100 to 150 at a time, to satisfy Stirling's customers' demand for just-in-time (JIT) deliveries. Your client is considering installing JIT production methods at Stirling if the acquisition is completed.
Your boss asks you to write a memo that outlines the various likely results if Stirling adopts JIT production techniques and the likely impact on Stirling's cash flows and eventual market value. Your memo will provide background information for your colleagues who are actually estimating Stirling's current price and future value after acquisition. Your client is planning on making a number of changes at Stirling. JIT is just one of them. Your memo will assist the analysts in your firm and should direct them in their data gathering and valuation efforts. Your memo should describe specifically what additional data your colleagues should collect in order to estimate JIT's cash flow effects.
فتح الحزمة
افتح القفل للوصول البطاقات البالغ عددها 18 في هذه المجموعة.
فتح الحزمة
k this deck
6
TQM at the Stowbridge Division
The Stowbridge Division is analyzing expanding its Total Quality Management program. It already has a TQM program in place. However, one of its customers, Amlan Equipment, is asking all suppliers to become ISO 9000-qualified, a process that certifies that the firm meets various standards. Once suppliers are ISO 9000-qualified, Amlan can reduce its inspection costs. Not all of the suppliers will be certified, and those that are will receive more business from Amlan.
Amlan purchases a stainless steel rotor from Stowbridge. After earning ISO 9000 certification, Stowbridge estimates that it will have to incur the following annual incremental costs as long as it wants to maintain its certification: To manufacture the current quality of the rotors (before ISO 9000 certification), the budgeted selling price and standard cost data per rotor follow. Unless Stowbridge receives ISO 9000 certification, it will lose Amlan's business of 120,000 units per year. Management estimates that the higher quality of the rotor that meets quality criteria will allow Stowbridge to add 14,000 rotors to its existing sales from new and continuing customers. Stowbridge is currently selling 480,000 rotors per year, including the Amlan sales. The 480,000 current sales amount to 63 percent of plant capacity. The additional 14,000 units sold can be manufactured without exceeding plant capacity. The higher-quality process after ISO 9000 certification is received would apply to all the rotors produced.
Required:
Should Stowbridge seek ISO 9000 certification? Support your recommendation with an analysis of the costs and benefits of certification.
The Stowbridge Division is analyzing expanding its Total Quality Management program. It already has a TQM program in place. However, one of its customers, Amlan Equipment, is asking all suppliers to become ISO 9000-qualified, a process that certifies that the firm meets various standards. Once suppliers are ISO 9000-qualified, Amlan can reduce its inspection costs. Not all of the suppliers will be certified, and those that are will receive more business from Amlan.
Amlan purchases a stainless steel rotor from Stowbridge. After earning ISO 9000 certification, Stowbridge estimates that it will have to incur the following annual incremental costs as long as it wants to maintain its certification:
To manufacture the current quality of the rotors (before ISO 9000 certification), the budgeted selling price and standard cost data per rotor follow. Unless Stowbridge receives ISO 9000 certification, it will lose Amlan's business of 120,000 units per year. Management estimates that the higher quality of the rotor that meets quality criteria will allow Stowbridge to add 14,000 rotors to its existing sales from new and continuing customers. Stowbridge is currently selling 480,000 rotors per year, including the Amlan sales. The 480,000 current sales amount to 63 percent of plant capacity. The additional 14,000 units sold can be manufactured without exceeding plant capacity. The higher-quality process after ISO 9000 certification is received would apply to all the rotors produced.Required:
Should Stowbridge seek ISO 9000 certification? Support your recommendation with an analysis of the costs and benefits of certification.
فتح الحزمة
افتح القفل للوصول البطاقات البالغ عددها 18 في هذه المجموعة.
فتح الحزمة
k this deck
7
Winter Games
Winter Games manufactures a competitive line of skis and sells its skis to retailers at a price of $225 per pair. Based on an annual volume of 5,000 pairs, the cost per pair is $185: "Composed of depreciation, property taxes, charitable contributions, insurance, and so on.
Sports Palace, a discount sporting goods store, currently purchases 500 pairs of skis from Winter Games. Sports Palace has asked to purchase 1,000 pairs of skis under a private brand label, at a price of $200 per pair. The skis would be identical to those normally sold for $225.
Winter Games believes that if it accepts the order, Sports Palace will cancel its usual order of 500 pairs. These sales cannot be recouped elsewhere. If this special order is accepted, the direct labor hours for the additional 500 skis would have to be compensated at overtime rates (at 1 1 / 2 times the base rate). Analysis shows that variable overhead varies with total direct labor dollars at the rate of $0.40 per direct labor dollar.
Should Winter Games accept the special order from Sports Palace?
Winter Games manufactures a competitive line of skis and sells its skis to retailers at a price of $225 per pair. Based on an annual volume of 5,000 pairs, the cost per pair is $185:
"Composed of depreciation, property taxes, charitable contributions, insurance, and so on.Sports Palace, a discount sporting goods store, currently purchases 500 pairs of skis from Winter Games. Sports Palace has asked to purchase 1,000 pairs of skis under a private brand label, at a price of $200 per pair. The skis would be identical to those normally sold for $225.
Winter Games believes that if it accepts the order, Sports Palace will cancel its usual order of 500 pairs. These sales cannot be recouped elsewhere. If this special order is accepted, the direct labor hours for the additional 500 skis would have to be compensated at overtime rates (at 1 1 / 2 times the base rate). Analysis shows that variable overhead varies with total direct labor dollars at the rate of $0.40 per direct labor dollar.
Should Winter Games accept the special order from Sports Palace?
فتح الحزمة
افتح القفل للوصول البطاقات البالغ عددها 18 في هذه المجموعة.
فتح الحزمة
k this deck
8
Warren City Parts Manufacturing
Warren City, with sales of $2 billion, produces and sells farm equipment. The manufacturing division produces some parts internally and purchases other parts from external suppliers and assembles farm equipment including tractors, combines, and plows. Within the manufacturing division is parts manufacturing, which fabricates a large variety of parts. Parts manufacturing is further subdivided into 12 departments, including screw products, metal stamping and fabrication, plastic injection molding, and steel castings. Each of these parts departments is headed by a department manager whose performance is evaluated along several dimensions: meeting budgeted costs, meeting delivery schedules, improving quality, achieving affirmative action and employee satisfaction goals, and minimizing inventory adjustments.
Inventory adjustments occur twice a year after internal auditors conduct a physical inventory of the parts department's work in process and compare it with the amount of inventory as reported in the work-in-process (WIP) account. For example, if on June 30 the auditors take a physical inventory count and find $130,000 of physical WIP inventory in the steel castings department but the WIP account reports an inventory balance of $143,000, then a negative inventory adjustment of -9.1 percent (-$13,000 ÷ $143,000) is made. Any inventory adjustment, positive or negative, reflects unfavorably on the parts department manager's performance and results in a reduction in the manager's bonus. The parts department manager is expected to maintain a tight control of WIP inventories, including ensuring the integrity of his or her department's accounting reports of WIP. Large inventory adjustments indicate that the manager does not have good control of WIP.
Four years ago Warren City adopted JIT production procedures. The result has been a drastic reduction of WIP inventories. For example, the following data illustrate the steel castings department's WIP account balance before adjustments, inventory adjustment, and throughput for the last seven years.
Warren City Steel Castings Department * Deflated by 12/31 WIP.
Throughput is the total dollar cost of parts manufactured in the year. It is the sum of the beginning inventory plus direct labor and materials and overhead, less ending inventory. Warren City uses a standard cost system and all inventories are valued at standard cost. When a batch of parts completes production, the WIP inventory is reduced by the standard cost of the part times the standard number of parts in the batch. Each part is manufactured in standard lot sizes.
Inventory adjustments can result for a number of reasons:
1. Different batch sizes. The department manager decides to deviate from standard batch sizes. Unless a special entry is recorded, the accounting system assumes that the number of units in the batch is the standard number. Sometimes the manager has some excess production capacity and decides to increase the standard batch size. In some cases, the manager produces fewer parts than called for by the standard lot size because of machine breakdowns or bottlenecks. For example, suppose a certain part calls for a standard batch size of 150 but the manager decides to produce 200 parts, keeps 50 as spares, but fails to update the WIP account for the additional 50 units. The WIP account contains only 150 at standard cost but the auditors count 200, causing a positive inventory adjustment.
2. Timing differences. The accounting system charges some expenses in a different time period than the department manager expects. This causes the dollar amount of the WIP balance to differ from standard cost.
3. Standard cost revisions. The standard cost of a part is revised and the auditors use a different standard cost in valuing the ending WIP inventory than was used in the WIP account.
4. Audit mistakes. The internal auditors make mistakes in counting the final physical WIP inventory.
The first two reasons are by far the most prevalent causes of inventory adjustments.
Required:
a. Management is concerned that the magnitude of the inventory adjustment has increased over time. What are some likely reasons that the absolute value of the inventory adjustment has grown?
b. Evaluate the use of the inventory adjustment described above to measure a parts department manager's performance.
Warren City, with sales of $2 billion, produces and sells farm equipment. The manufacturing division produces some parts internally and purchases other parts from external suppliers and assembles farm equipment including tractors, combines, and plows. Within the manufacturing division is parts manufacturing, which fabricates a large variety of parts. Parts manufacturing is further subdivided into 12 departments, including screw products, metal stamping and fabrication, plastic injection molding, and steel castings. Each of these parts departments is headed by a department manager whose performance is evaluated along several dimensions: meeting budgeted costs, meeting delivery schedules, improving quality, achieving affirmative action and employee satisfaction goals, and minimizing inventory adjustments.
Inventory adjustments occur twice a year after internal auditors conduct a physical inventory of the parts department's work in process and compare it with the amount of inventory as reported in the work-in-process (WIP) account. For example, if on June 30 the auditors take a physical inventory count and find $130,000 of physical WIP inventory in the steel castings department but the WIP account reports an inventory balance of $143,000, then a negative inventory adjustment of -9.1 percent (-$13,000 ÷ $143,000) is made. Any inventory adjustment, positive or negative, reflects unfavorably on the parts department manager's performance and results in a reduction in the manager's bonus. The parts department manager is expected to maintain a tight control of WIP inventories, including ensuring the integrity of his or her department's accounting reports of WIP. Large inventory adjustments indicate that the manager does not have good control of WIP.
Four years ago Warren City adopted JIT production procedures. The result has been a drastic reduction of WIP inventories. For example, the following data illustrate the steel castings department's WIP account balance before adjustments, inventory adjustment, and throughput for the last seven years.
Warren City Steel Castings Department
* Deflated by 12/31 WIP.Throughput is the total dollar cost of parts manufactured in the year. It is the sum of the beginning inventory plus direct labor and materials and overhead, less ending inventory. Warren City uses a standard cost system and all inventories are valued at standard cost. When a batch of parts completes production, the WIP inventory is reduced by the standard cost of the part times the standard number of parts in the batch. Each part is manufactured in standard lot sizes.
Inventory adjustments can result for a number of reasons:
1. Different batch sizes. The department manager decides to deviate from standard batch sizes. Unless a special entry is recorded, the accounting system assumes that the number of units in the batch is the standard number. Sometimes the manager has some excess production capacity and decides to increase the standard batch size. In some cases, the manager produces fewer parts than called for by the standard lot size because of machine breakdowns or bottlenecks. For example, suppose a certain part calls for a standard batch size of 150 but the manager decides to produce 200 parts, keeps 50 as spares, but fails to update the WIP account for the additional 50 units. The WIP account contains only 150 at standard cost but the auditors count 200, causing a positive inventory adjustment.
2. Timing differences. The accounting system charges some expenses in a different time period than the department manager expects. This causes the dollar amount of the WIP balance to differ from standard cost.
3. Standard cost revisions. The standard cost of a part is revised and the auditors use a different standard cost in valuing the ending WIP inventory than was used in the WIP account.
4. Audit mistakes. The internal auditors make mistakes in counting the final physical WIP inventory.
The first two reasons are by far the most prevalent causes of inventory adjustments.
Required:
a. Management is concerned that the magnitude of the inventory adjustment has increased over time. What are some likely reasons that the absolute value of the inventory adjustment has grown?
b. Evaluate the use of the inventory adjustment described above to measure a parts department manager's performance.
فتح الحزمة
افتح القفل للوصول البطاقات البالغ عددها 18 في هذه المجموعة.
فتح الحزمة
k this deck
9
Secure Servers Inc.
Secure Servers Inc. (SSI) is one of the largest software and service providers directed at providing high levels of backup and security for computer servers to the financial community, military, and other clients requiring off-site backup and security systems. SSI's software packages include encryption, downloading, and data warehousing of large amounts of data to various SSI sites in dedicated locations. SSI backup locations are designed to survive virtually all natural disasters and terrorist attacks.
SSI employs 6,000 people in Dayton, Ohio. Being one of Dayton's largest employers, it has a deep commitment to the community and supports local educational, cultural, and philanthropic activities. SSI also believes strongly in both customer and employee satisfaction. To achieve these objectives, SSI employs a balanced scorecard to evaluate and reward senior managers. One-fourth of each senior executive's bonus is tied to the following objectively determined performance measures:
Community engagement (independent survey of local leaders).
Customer satisfaction (independent survey of customers).
Employee satisfaction (independent survey of employees).
Corporate profit (audited net income before taxes).
The annual surveys of local leaders, customers, and employees are conducted by an independent opinion survey firm that reports directly to the board of directors. Corporate profit is the firm's reported net income before taxes as audited by an international public accounting firm. SSI's senior management team believes strongly in the concept of the balanced scorecard and accepts it as a valid and productive performance measurement and incentive tool.
Senior management is tasked with determining how much to spend on further improvements in community engagement, customer satisfaction, and employee satisfaction. The following table captures the relations among additional spending in each area and the expected improvements from such expenditures (in millions). For example, by spending an additional $3 million on customer service (improved call centers, training, etc.), a 95 percent customer satisfaction can be achieved. Or, by spending an additional $2 million on employee-related activities (improved child care, athletic facilities, fringe benefits), a 90 percent employee satisfaction can be achieved. Or spending $1 million on additional community projects can raise SSI's community rating survey to 50 percent.
Besides raising the satisfaction scores as detailed above, making additional expenditures on these three areas also generates additional net cash flows to the firm. The following table estimates the additional cash flows SSI receives from making the additional expenditures. For example, spending $3 million for community projects yields a community rating index of 90 percent and additional cash flows of $4.0 million, which increases net income before taxes by $1.0 million ($4.0 ? $3.0).
To convert audited net income into a percentage index that can be averaged with the other three survey metrics, SSI uses the following formula:
Profit index = ?3 + 0.05 × Net income
So, if net income is $74 million, the profit index for use in the balanced scorecard is 70 percent [?3 + (0.05 × 74)].
The four indexes are averaged to get an overall index for determining the bonus for each senior executive of SSI. For example, the following four indexes yield a balanced scorecard of 79.75 percent: SSI expects audited net income before taxes for the year before making any additional expenditures on customer satisfaction, employee satisfaction, and community engagement to be $72 million.
Required:
a. What levels of additional spending do you expect the senior management team of SSI will select for:
(1) Customer satisfaction.
(2) Community engagement.
(3) Employee satisfaction.
Be sure to justify your answers with appropriate analysis.
b. Given the levels of additional spending on the three items you recommended in ( a ), what is the expected balanced scorecard index? That is, calculate the average balanced scorecard management expects to generate if they make the expenditure decisions you predict in ( a ). Show calculations.
c. What level of spending would you expect a profit-maximizing owner of SSI to select for:
(1) Customer satisfaction.
(2) Community engagement.
(3) Employee satisfaction.
What is the expected balanced scorecard resulting from these spending levels?
Secure Servers Inc. (SSI) is one of the largest software and service providers directed at providing high levels of backup and security for computer servers to the financial community, military, and other clients requiring off-site backup and security systems. SSI's software packages include encryption, downloading, and data warehousing of large amounts of data to various SSI sites in dedicated locations. SSI backup locations are designed to survive virtually all natural disasters and terrorist attacks.
SSI employs 6,000 people in Dayton, Ohio. Being one of Dayton's largest employers, it has a deep commitment to the community and supports local educational, cultural, and philanthropic activities. SSI also believes strongly in both customer and employee satisfaction. To achieve these objectives, SSI employs a balanced scorecard to evaluate and reward senior managers. One-fourth of each senior executive's bonus is tied to the following objectively determined performance measures:
Community engagement (independent survey of local leaders).
Customer satisfaction (independent survey of customers).
Employee satisfaction (independent survey of employees).
Corporate profit (audited net income before taxes).
The annual surveys of local leaders, customers, and employees are conducted by an independent opinion survey firm that reports directly to the board of directors. Corporate profit is the firm's reported net income before taxes as audited by an international public accounting firm. SSI's senior management team believes strongly in the concept of the balanced scorecard and accepts it as a valid and productive performance measurement and incentive tool.
Senior management is tasked with determining how much to spend on further improvements in community engagement, customer satisfaction, and employee satisfaction. The following table captures the relations among additional spending in each area and the expected improvements from such expenditures (in millions).
For example, by spending an additional $3 million on customer service (improved call centers, training, etc.), a 95 percent customer satisfaction can be achieved. Or, by spending an additional $2 million on employee-related activities (improved child care, athletic facilities, fringe benefits), a 90 percent employee satisfaction can be achieved. Or spending $1 million on additional community projects can raise SSI's community rating survey to 50 percent.Besides raising the satisfaction scores as detailed above, making additional expenditures on these three areas also generates additional net cash flows to the firm. The following table estimates the additional cash flows SSI receives from making the additional expenditures.
For example, spending $3 million for community projects yields a community rating index of 90 percent and additional cash flows of $4.0 million, which increases net income before taxes by $1.0 million ($4.0 ? $3.0).To convert audited net income into a percentage index that can be averaged with the other three survey metrics, SSI uses the following formula:
Profit index = ?3 + 0.05 × Net income
So, if net income is $74 million, the profit index for use in the balanced scorecard is 70 percent [?3 + (0.05 × 74)].
The four indexes are averaged to get an overall index for determining the bonus for each senior executive of SSI. For example, the following four indexes yield a balanced scorecard of 79.75 percent:
SSI expects audited net income before taxes for the year before making any additional expenditures on customer satisfaction, employee satisfaction, and community engagement to be $72 million.Required:
a. What levels of additional spending do you expect the senior management team of SSI will select for:
(1) Customer satisfaction.
(2) Community engagement.
(3) Employee satisfaction.
Be sure to justify your answers with appropriate analysis.
b. Given the levels of additional spending on the three items you recommended in ( a ), what is the expected balanced scorecard index? That is, calculate the average balanced scorecard management expects to generate if they make the expenditure decisions you predict in ( a ). Show calculations.
c. What level of spending would you expect a profit-maximizing owner of SSI to select for:
(1) Customer satisfaction.
(2) Community engagement.
(3) Employee satisfaction.
What is the expected balanced scorecard resulting from these spending levels?
فتح الحزمة
افتح القفل للوصول البطاقات البالغ عددها 18 في هذه المجموعة.
فتح الحزمة
k this deck
10
British Airways
British Airways (BA) has implemented the balanced scorecard. Match the following performance indicators: to these four balanced scorecard perspectives: Note: Performance indicators may be used for more than one perspective.
British Airways (BA) has implemented the balanced scorecard. Match the following performance indicators:
to these four balanced scorecard perspectives: Note: Performance indicators may be used for more than one perspective. فتح الحزمة
افتح القفل للوصول البطاقات البالغ عددها 18 في هذه المجموعة.
فتح الحزمة
k this deck
11
Kollel Hospital
Kollel is a private hospital that operates in a large metropolitan area. The hospital admits "regular" patients and "private" patients. Regular patients are admitted and treated by staff doctors who are fulltime employees of Kollel Hospital. Private patients are admitted and treated by private physicians (physicians in private practice who have admitting privileges to Kollel). To maintain its leadership role in the community, Kollel is deeply committed to its Total Quality Management program. Management and staff form multidisciplinary teams to study various hospital functions. This year, one team reviewed a hospital unit that exclusively treated a particular type of medical admittance. (All patients of this type of admittance were treated in this unit.) The team found that patients preferred to be discharged sooner rather than later and that, overall, the patients felt that they were kept in the hospital too long.
The specific unit under review consists of 16 beds. Last year the unit treated 300 patients. The patients were heterogeneous with respect to their level of illness. Properly diagnosed and treated, patients should have been discharged in an average of 16 days. Nevertheless, the TQM study showed that patients remain in the hospital an average of 19 days. Furthermore, research showed that the average stay of regular patients was shorter than the average stay of private patients, even though the private physicians did not handle more difficult cases at the time of admission. The study found that private doctors took longer to diagnose their patients and spent less time with them during treatment. As a result, these doctors did not promptly recognize whether a treatment was working or whether the patient was ready to be discharged.
In order to increase the quality of care, hospital management is studying plans to lower the average stay of these patients. One alternative being considered is preventing the private doctors, who are keeping their patients in the unit the longest, from admitting patients into the unit. Some, but not all, of these patients can be replaced by patients admitted by staff doctors. The trade-off between the number of patients admitted and the length of a patient's stay is shown in the following table. Last year 150 regular and 150 private patients were admitted. The average stay was 16 days for regular patients and 22 days for private patients, making an overall average of 19 days per patient.
Admissions as a Function of Reducing Length of Stay For this specific type of admittance, the hospital collects $10,000 per stay from the insurance companies, regardless of whether the patient is admitted regularly or privately. This amount is used to cover the unit's fixed cost of $1,752,000 per year (365 days) and a variable cost of $150 per patient per day. Note that the charges for the doctor's services are handled separately and are not considered for purposes of this analysis.
Required:
a. Calculate the average hospital stay for all patients under each scenario listed in the table. Also, for each case calculate the occupancy rate (percentage of beds filled on average). Discuss the relation between the average length of stay and the occupancy rate.
b. Prepare an income statement showing the net income for each scenario, separating the margin earned on regular and private patients. Where is profit maximized? What are the components of the change in net income?
Kollel is a private hospital that operates in a large metropolitan area. The hospital admits "regular" patients and "private" patients. Regular patients are admitted and treated by staff doctors who are fulltime employees of Kollel Hospital. Private patients are admitted and treated by private physicians (physicians in private practice who have admitting privileges to Kollel). To maintain its leadership role in the community, Kollel is deeply committed to its Total Quality Management program. Management and staff form multidisciplinary teams to study various hospital functions. This year, one team reviewed a hospital unit that exclusively treated a particular type of medical admittance. (All patients of this type of admittance were treated in this unit.) The team found that patients preferred to be discharged sooner rather than later and that, overall, the patients felt that they were kept in the hospital too long.
The specific unit under review consists of 16 beds. Last year the unit treated 300 patients. The patients were heterogeneous with respect to their level of illness. Properly diagnosed and treated, patients should have been discharged in an average of 16 days. Nevertheless, the TQM study showed that patients remain in the hospital an average of 19 days. Furthermore, research showed that the average stay of regular patients was shorter than the average stay of private patients, even though the private physicians did not handle more difficult cases at the time of admission. The study found that private doctors took longer to diagnose their patients and spent less time with them during treatment. As a result, these doctors did not promptly recognize whether a treatment was working or whether the patient was ready to be discharged.
In order to increase the quality of care, hospital management is studying plans to lower the average stay of these patients. One alternative being considered is preventing the private doctors, who are keeping their patients in the unit the longest, from admitting patients into the unit. Some, but not all, of these patients can be replaced by patients admitted by staff doctors. The trade-off between the number of patients admitted and the length of a patient's stay is shown in the following table. Last year 150 regular and 150 private patients were admitted. The average stay was 16 days for regular patients and 22 days for private patients, making an overall average of 19 days per patient.
Admissions as a Function of Reducing Length of Stay
For this specific type of admittance, the hospital collects $10,000 per stay from the insurance companies, regardless of whether the patient is admitted regularly or privately. This amount is used to cover the unit's fixed cost of $1,752,000 per year (365 days) and a variable cost of $150 per patient per day. Note that the charges for the doctor's services are handled separately and are not considered for purposes of this analysis.Required:
a. Calculate the average hospital stay for all patients under each scenario listed in the table. Also, for each case calculate the occupancy rate (percentage of beds filled on average). Discuss the relation between the average length of stay and the occupancy rate.
b. Prepare an income statement showing the net income for each scenario, separating the margin earned on regular and private patients. Where is profit maximized? What are the components of the change in net income?
فتح الحزمة
افتح القفل للوصول البطاقات البالغ عددها 18 في هذه المجموعة.
فتح الحزمة
k this deck
12
Global Oil 13
In 1995 Global Oil Corporation's Marketing and Refining (M R) Division was the fifth largest U.S. refiner with 7,700 Global-branded service stations selling about 23 million gallons per day, or 7 percent of the nation's gasoline. All the service stations are company owned. In 1990, M R ranked last among its peers in profitability and was annually draining $500 million of cash from the corporation.
In 1993, M R reorganized from a centralized functional organization (Refineries, Transportation, Warehousing, Retail, and Marketing) into 17 geographic business units (sales and distribution) and 14 service companies. The functional organization was slow to react to changing market conditions and the special customer needs that differed across the country. The new decentralized organization was designed to better focus on the customer. New marketing strategies could be better tailored to local markets by giving local managers more decision-making authority.
A new corporate strategy to focus on the less price-sensitive customer who would not only buy Global gas but also shop in its convenience gas-store outlets was implemented simultaneously with the reorganization. Global's new strategy was to redesign its convenience stores so they would become a "destination stop," offering one-stop shopping for gas and snacks.
The old organization used a variety of functional measures: manufacturing cost, sales margins and volumes, and health and safety metrics. After changing its corporate strategy and organizational structure, M R decided to change its performance metrics and began investigating the balanced scorecard.
Balanced scorecard (BSC) at M R
M R formed project teams of managers to design performance metrics for its operations. Thirty-two different metrics were identified. These included Financial (ROA, cash flow, volume growth, etc.), Customer (share of segment, mystery shopper, etc.), Internal (safety incidents, refinery ROA, inventory level, etc.), and Learning (strategic skills accumulation, quality of information system, etc.). The "mystery shopper" is a third-party vendor who purchases gas and snacks at each station monthly. During each visit, the mystery shopper rates the station on 23 items related to external appearance, rest rooms, and so forth. A brochure describing the BSC was prepared and distributed to M R's 11,000 employees in August of 1994. Extensive meetings with employees explained the new metrics and the BSC concept.
Compensation plans
All salaried employees of M R received up to a 10 percent bonus if Global ranked first among its seven competitors on ROA and earnings per share (EPS) growth. In addition to this existing plan, a new program was added that awarded bonuses up to 20 percent to managers. The size of the bonus depends on the average performance of three factors:
• Global's competitive ranking on ROA and EPS growth.
• M R's balanced scorecard metrics.
• Own business unit's balanced scorecard.
In 1995, M R generated more income per barrel of oil than the industry average, and its ROA exceeded the industry's average.
Required:
a. Critically evaluate M R's implementation of the balanced scorecard. Identify any strengths and weaknesses of the program.
b. Was the adoption of the balanced scorecard at M R responsible for the turnaround in its financial performance?
فتح الحزمة
افتح القفل للوصول البطاقات البالغ عددها 18 في هذه المجموعة.
فتح الحزمة
k this deck
13
Tagway 4000
Tagway 4000 is a computer manufacturer based in Montana. One component of the computer is an internal battery that keeps track of the time and date while the computer is turned off. Tagway produces the batteries in-house. The division that produces the batteries (one million each year) is treated as a cost center. The manager of the division is compensated based on her ability to keep total costs low and meet quality control measures of numbers of defects and delivery time. She has a base salary of $144,000. She is eligible for a $34,000 bonus if total costs do not exceed $2 million, not including her compensation. She is eligible for a $40,000 bonus if there are 32 or fewer defects per one million units produced. Finally, she is eligible for a $22,000 bonus if she delivers batteries on time. On time is defined as averaging two days between the order from the assembly department and delivery to the assembly department.
The basic cost of producing a battery is $1.55. However, current methods have an inherent defect rate of 1,032 defects per million (approximately four standard deviations or 4 sigma). The cost of improving the defect rate involves using higher-quality materials and more experienced labor. Down to 32 defects per million (approximately 5 sigma) the costs are linear. (Based on currently available inputs, improving the defect rate below 32 per million is impossible.) For every additional $450, one defect per million can be removed. In other words, the cost to reduce defects to the desired level of 32 per million is $450,000.
The current production method delivers the batteries in an average of four days. The cost of overtime necessary to lower the average to three days is $90,000. The cost of speeding up delivery another day is $95,000, making the cumulative cost of lowering the average to two days $185,000. The marginal cost of reducing the average delivery a third day is $115,000, making the total cost of reducing the average delivery time to one day $300,000.
Required:
a. Create a table showing the production costs for defect rates of 1,032; 500; 100; 50; and 32 per million and average delivery times of one to four days. Do not include the manager's salary. Note the minimum cost.
b. Create a table showing the manager's compensation for defect rates of 1,032; 500; 100; 50; and 32 and average delivery times of one to four days. Note the maximum compensation level.
c. Comment on the ideal number of defects and delivery times necessary to achieve the minimum costs and the maximum compensation level.
d. Assume that the company as a whole can measure the financial losses related to defects and late deliveries. The costs would include warranty costs, express delivery charges, lost sales, and lost goodwill. These costs do not affect the manager's compensation. The cost for each defect is $460. The cost for each day above one-day average delivery is $500,000 per day late. That is $0 for one-day average delivery, $500,000 for two days, and so on. Create a table showing the firm's total costs-including production costs, costs of defects, costs of delays, and the cost of the manager's compensation (including applicable bonus)-for defect rates of 1,032; 500; 100; 50; and 32 per million and average delivery times of one to four days. Note the minimum cost.
e. Comment on the optimum delivery times and number of defects necessary to achieve the minimum costs to the firm and the maximum compensation level now that the firm's total costs are considered.
فتح الحزمة
افتح القفل للوصول البطاقات البالغ عددها 18 في هذه المجموعة.
فتح الحزمة
k this deck
14
Chateau Napa
Chateau Napa purchased a small vineyard and is now producing magnum bottles (1.5 liters) of Redwood Cabernet Sauvignon. This wine is much sought after, and bottling the wine in larger bottles enhances its quality, prestige, and demand. Because of the limited size of the vineyard, the quantity of wine produced is fixed. The only decision variable is the quality of the wine produced. Quality is a function of a host of factors: the quality of oak barrels used to age the wine, the ability of the oenologist (winemaker), the length of time it is aged, and so forth. In general, the more money spent on quality, the higher the price of the wine. Several experts rate wines, and the Wine Spectator ' s rating has become the industry standard. The following table summarizes how quality (as measured in expected Wine Spectator points with a scale of 0-100) varies with the amount of spending on quality and how various quality levels translate into price: Note: Magnums are produced in two-bottle sets. So if $115 is spent on enhancing the quality of a two-bottle set, a quality rating of 94.90 is expected and a final wholesale price Chateau Napa expects to receive is $598.52 per two-bottle set.
The managers producing and marketing the Redwood Cabernet Sauvignon are evaluated and compensated based on the balanced scorecard. Just two metrics are used in their scorecard: actual quality achieved and profits per two-bottle set. Half the bonus is based on quality achieved using the following formula:
Quality bonus = Maximum (0, quality achieved - 90) × 5%
In other words, the managers must receive a quality rating of at least 90 points before any bonus is paid. If they achieve a perfect rating of 100 points, they receive 50 percent of their bonus [5% × (100 - 90)]. The other 50 percent of their bonus is tied to profits achieved from selling the two-bottle sets. Profits consist of the wholesale selling price less quality costs less all other operating costs ($450 per two-bottle set 12 ). The profit bonus is based on the following formula:
Profit bonus = Maximum (0, profit - $30) × 10%
Managers are expected to achieve profits between $30 and $35. For every dollar of profit they generate above $30, they receive 10 percent of their bonus. So if they have profits of $33.15 per set, they receive 31.5 percent [10% × ($33.15 - $30)] of their bonus. (All bonus computations are rounded to three significant digits, i.e., 46.7 percent.)
Required:
a. Given the balanced scorecard incentive scheme being used to reward the Redwood Cabernet Sauvignon managers, how much do you expect them to spend on quality? What quality level do they expect to achieve? How much profit per two-bottle set do they expect to earn, and what is their expected total bonus (in percent)?
b. To maximize firm value, how much would Chateau Napa want the managers of Redwood Cabernet Sauvignon to spend on quality; what quality level would this spending likely yield; and how much profit does this quality level produce?
c. Explain why your answers in parts ( a ) and ( b ) are either the same or different.
d. Using the setting in the problem, explain what is meant by the saying "You can only maximize in one dimension at a time."
Chateau Napa purchased a small vineyard and is now producing magnum bottles (1.5 liters) of Redwood Cabernet Sauvignon. This wine is much sought after, and bottling the wine in larger bottles enhances its quality, prestige, and demand. Because of the limited size of the vineyard, the quantity of wine produced is fixed. The only decision variable is the quality of the wine produced. Quality is a function of a host of factors: the quality of oak barrels used to age the wine, the ability of the oenologist (winemaker), the length of time it is aged, and so forth. In general, the more money spent on quality, the higher the price of the wine. Several experts rate wines, and the Wine Spectator ' s rating has become the industry standard. The following table summarizes how quality (as measured in expected Wine Spectator points with a scale of 0-100) varies with the amount of spending on quality and how various quality levels translate into price:
Note: Magnums are produced in two-bottle sets. So if $115 is spent on enhancing the quality of a two-bottle set, a quality rating of 94.90 is expected and a final wholesale price Chateau Napa expects to receive is $598.52 per two-bottle set.The managers producing and marketing the Redwood Cabernet Sauvignon are evaluated and compensated based on the balanced scorecard. Just two metrics are used in their scorecard: actual quality achieved and profits per two-bottle set. Half the bonus is based on quality achieved using the following formula:
Quality bonus = Maximum (0, quality achieved - 90) × 5%
In other words, the managers must receive a quality rating of at least 90 points before any bonus is paid. If they achieve a perfect rating of 100 points, they receive 50 percent of their bonus [5% × (100 - 90)]. The other 50 percent of their bonus is tied to profits achieved from selling the two-bottle sets. Profits consist of the wholesale selling price less quality costs less all other operating costs ($450 per two-bottle set 12 ). The profit bonus is based on the following formula:
Profit bonus = Maximum (0, profit - $30) × 10%
Managers are expected to achieve profits between $30 and $35. For every dollar of profit they generate above $30, they receive 10 percent of their bonus. So if they have profits of $33.15 per set, they receive 31.5 percent [10% × ($33.15 - $30)] of their bonus. (All bonus computations are rounded to three significant digits, i.e., 46.7 percent.)
Required:
a. Given the balanced scorecard incentive scheme being used to reward the Redwood Cabernet Sauvignon managers, how much do you expect them to spend on quality? What quality level do they expect to achieve? How much profit per two-bottle set do they expect to earn, and what is their expected total bonus (in percent)?
b. To maximize firm value, how much would Chateau Napa want the managers of Redwood Cabernet Sauvignon to spend on quality; what quality level would this spending likely yield; and how much profit does this quality level produce?
c. Explain why your answers in parts ( a ) and ( b ) are either the same or different.
d. Using the setting in the problem, explain what is meant by the saying "You can only maximize in one dimension at a time."
فتح الحزمة
افتح القفل للوصول البطاقات البالغ عددها 18 في هذه المجموعة.
فتح الحزمة
k this deck
15
Telephone Computer Corporation (TCC)
Telephone Computer Corporation (TCC) manufactures and sells two computerized directory assistance computers to telephone companies. The firm has its own sales force that sells directly to the phone companies. TCC currently sells two computer systems: the Alpha and the Beta. TCC has 90 percent of the high-end market (Beta) and 50 percent of the low-end market (Alpha). The Alpha sells for $100,000. The Beta sells for $200,000 but has three times the capacity of the Alpha.
TCC has developed a new high-volume machine, Zeta, that has four times the capacity of the Beta and lower operating costs, but a price of $300,000. The unit manufacturing cost is $170,000. Users can connect the Zeta directly to mainframe computers for customer billing as well as to future expected telecommunications advancements. If the Zeta is introduced, management expects that its closest competition will be from the Beta, so most initial sales of the Zeta will come at the expense of Beta sales.
Senior management has invested considerable resources in Zeta. It believes that the future of the company is tied closely to the success of this project. Next year's operations of TCC (if the Zeta is not introduced) are:
Next Year's Projected Profits by Product without Zet a * Assigned based on commissions.
The existing sales force will sell all three types of machines. Salespeople are paid a salary plus 10 percent of sales. To sell the Zeta, salespeople with more knowledge of telecommunications and computer systems will be hired. The additional salary cost of these new employees will be $500,000. The existing sales force will still sell the Zeta but will call in these system experts to assist with the sale. The Zeta system experts are paid a flat salary, and the existing sales force's 10 percent commission incentive will not change with the introduction of the Zeta.
If the Zeta is not introduced, Alpha unit sales are projected to grow at 5 percent per year and Beta unit sales are projected to grow at 10 percent per year. Selling prices will remain constant in real terms. (Prices and salaries will grow at the inflation rate. To keep the analysis simple, all numbers should be projected in real, not nominal, terms. That is, do not adjust the numbers for inflation.)
If the Zeta is introduced, Alpha unit sales will not be affected. But Beta unit sales will be affected: All the Zeta sales will come from the Beta sales in the first year and then Beta unit sales will grow only 2 percent per year. Zeta sales will grow at 9 percent per year from an initial base of 25 machines.
Required:
Management wants to see how the preceding table on product-line profitability will appear when the Zeta model is added. In particular, management asks you to project profits for the Alpha, Beta, and Zeta for the next five years and to make a recommendation on this project. Discuss how the five-year product-line profitability projections should be presented to senior management.
Telephone Computer Corporation (TCC) manufactures and sells two computerized directory assistance computers to telephone companies. The firm has its own sales force that sells directly to the phone companies. TCC currently sells two computer systems: the Alpha and the Beta. TCC has 90 percent of the high-end market (Beta) and 50 percent of the low-end market (Alpha). The Alpha sells for $100,000. The Beta sells for $200,000 but has three times the capacity of the Alpha.
TCC has developed a new high-volume machine, Zeta, that has four times the capacity of the Beta and lower operating costs, but a price of $300,000. The unit manufacturing cost is $170,000. Users can connect the Zeta directly to mainframe computers for customer billing as well as to future expected telecommunications advancements. If the Zeta is introduced, management expects that its closest competition will be from the Beta, so most initial sales of the Zeta will come at the expense of Beta sales.
Senior management has invested considerable resources in Zeta. It believes that the future of the company is tied closely to the success of this project. Next year's operations of TCC (if the Zeta is not introduced) are:
Next Year's Projected Profits by Product without Zet a
* Assigned based on commissions.The existing sales force will sell all three types of machines. Salespeople are paid a salary plus 10 percent of sales. To sell the Zeta, salespeople with more knowledge of telecommunications and computer systems will be hired. The additional salary cost of these new employees will be $500,000. The existing sales force will still sell the Zeta but will call in these system experts to assist with the sale. The Zeta system experts are paid a flat salary, and the existing sales force's 10 percent commission incentive will not change with the introduction of the Zeta.
If the Zeta is not introduced, Alpha unit sales are projected to grow at 5 percent per year and Beta unit sales are projected to grow at 10 percent per year. Selling prices will remain constant in real terms. (Prices and salaries will grow at the inflation rate. To keep the analysis simple, all numbers should be projected in real, not nominal, terms. That is, do not adjust the numbers for inflation.)
If the Zeta is introduced, Alpha unit sales will not be affected. But Beta unit sales will be affected: All the Zeta sales will come from the Beta sales in the first year and then Beta unit sales will grow only 2 percent per year. Zeta sales will grow at 9 percent per year from an initial base of 25 machines.
Required:
Management wants to see how the preceding table on product-line profitability will appear when the Zeta model is added. In particular, management asks you to project profits for the Alpha, Beta, and Zeta for the next five years and to make a recommendation on this project. Discuss how the five-year product-line profitability projections should be presented to senior management.
فتح الحزمة
افتح القفل للوصول البطاقات البالغ عددها 18 في هذه المجموعة.
فتح الحزمة
k this deck
16
Fiedler International
You work on a team that reports to the chief financial officer of Fiedler International, a consumer products company that manages a variety of consumer beauty brands (shampoos, facial soaps, deodorants). Your team evaluates possible acquisitions. You are currently analyzing the possible purchase of Lush, a manufacturer of face moisturizers with UV sun blockers. Lush is a small publicly traded company that has no single large shareholder. Most of the stock is held by institutional investors and Lush managers hold a small percentage of the stock.
The materials you have received from Lush include information about its senior management performance evaluation and incentive compensation plans. Lush uses a balanced scorecard to evaluate and reward senior managers. Managers can earn up to 50 percent of their salary as a bonus depending on four balanced scorecard metrics: customer service, human resources and innovation, operational efficiency, and financial performance. Each of the four metrics is scaled between 0 and 1. Senior managers receive up to 25 percent of their bonus for each metric. If the customer service metric is 0.67, and a particular manager's salary is $400,000, then for customer service, that manager receives $33,500 (50% × $400,000 × 0.67 × 25%). The compensation committee of Lush's board of directors sets the scale for each of the four metrics. For example, the financial performance metric is economic value added, or EVA. Last year's EVA was $13 million. The compensation committee sets the lower and upper bound of EVA as $12 million and $16 million. Hence, if the current year's EVA is $12 million, the financial performance metric is 0. If EVA is $15 million, the metric is 0.75 [($15 - $12)/($16 - 12)], and the manager earning the $400,000 salary would receive a bonus of $37,500 (50% × $400,000 × 0.75 × 25%).
Fourteen separate metrics are used to compute the four metrics. The following metrics are computed and then aggregated to form the four metrics: Lush has been using the balanced scorecard for three years and the achieved levels of each metric for the last three years are: Required:
Write a memo to your acquisition team describing balanced scorecards and the primary reasons they are used, and the likely affect of Lush's use of the balanced scorecard in terms of how Fiedler should be evaluating Lush. Specifically: ( a ) briefly describe balanced scorecards and why firms use them and ( b ) analyze Lush's use of the balanced scorecard and how this might affect Fiedler's evaluation of Lush as a possible takeover target.
You work on a team that reports to the chief financial officer of Fiedler International, a consumer products company that manages a variety of consumer beauty brands (shampoos, facial soaps, deodorants). Your team evaluates possible acquisitions. You are currently analyzing the possible purchase of Lush, a manufacturer of face moisturizers with UV sun blockers. Lush is a small publicly traded company that has no single large shareholder. Most of the stock is held by institutional investors and Lush managers hold a small percentage of the stock.
The materials you have received from Lush include information about its senior management performance evaluation and incentive compensation plans. Lush uses a balanced scorecard to evaluate and reward senior managers. Managers can earn up to 50 percent of their salary as a bonus depending on four balanced scorecard metrics: customer service, human resources and innovation, operational efficiency, and financial performance. Each of the four metrics is scaled between 0 and 1. Senior managers receive up to 25 percent of their bonus for each metric. If the customer service metric is 0.67, and a particular manager's salary is $400,000, then for customer service, that manager receives $33,500 (50% × $400,000 × 0.67 × 25%). The compensation committee of Lush's board of directors sets the scale for each of the four metrics. For example, the financial performance metric is economic value added, or EVA. Last year's EVA was $13 million. The compensation committee sets the lower and upper bound of EVA as $12 million and $16 million. Hence, if the current year's EVA is $12 million, the financial performance metric is 0. If EVA is $15 million, the metric is 0.75 [($15 - $12)/($16 - 12)], and the manager earning the $400,000 salary would receive a bonus of $37,500 (50% × $400,000 × 0.75 × 25%).
Fourteen separate metrics are used to compute the four metrics. The following metrics are computed and then aggregated to form the four metrics:
Lush has been using the balanced scorecard for three years and the achieved levels of each metric for the last three years are: Required: Write a memo to your acquisition team describing balanced scorecards and the primary reasons they are used, and the likely affect of Lush's use of the balanced scorecard in terms of how Fiedler should be evaluating Lush. Specifically: ( a ) briefly describe balanced scorecards and why firms use them and ( b ) analyze Lush's use of the balanced scorecard and how this might affect Fiedler's evaluation of Lush as a possible takeover target.
فتح الحزمة
افتح القفل للوصول البطاقات البالغ عددها 18 في هذه المجموعة.
فتح الحزمة
k this deck
17
Productivity Measures
Background
Economists and managers have long recognized the importance of productivity in determining an organization's success. Productivity is the relation between the firm's output of goods and services and the inputs necessary to produce that output. If a firm is able to produce more output with the same inputs, we say it has improved its productivity. Likewise, if two firms produce the same quantity of goods and services but one firm uses less input, that firm is called more productive. Countries that produce more output per person generate more consumable wealth. Economists keep productivity statistics, and these numbers are reported in the financial press as measuring the competitiveness and well-being of that country.
In the 1970s many of the largest U.S. firms became interested in productivity and better ways to measure and improve their firms' productivity. Largely driven by foreign competition, these American firms were losing market share to Japanese and European rivals. Japanese auto companies were producing cars with fewer employee hours per car than American companies, thus offering lower-priced and often higher-quality cars than U.S. automakers. Foreign steel producers were more productive than their U.S. counterparts. Concerned about their declining relative productivity in 1977, large U.S. firms financed the formation of the American Productivity Center (later the American Productivity and Quality Center). To become more productive, some firms experimented with various productivity measures.
In its most basic form, productivity is defined as:
If the firm uses a single input (steel) to produce a single homogeneous product (horseshoes) that never changes over time, then the measure of productivity is the units of output per quantity of input, or the number of horseshoes per pound of steel. If steel waste is reduced, more horseshoes can be produced with the same amount of steel. One measure of productivity is the ratio of horseshoes to steel, in terms of physical volume. Steel is not the only input to making horseshoes. Labor is also an input, and labor is usually the input of most interest to managers. Productivity is usually thought of as the amount of output per unit of labor. Most managers want to know the number of horseshoes produced per person and how this number changes over time and compares to the competition.
Proponents of productivity measurement systems argue that managers should focus on productivity instead of accounting profits. A firm can appear profitable but can be experiencing declining productivity if selling prices are rising faster than input prices. Productivity measures help identify these cases. Managers control the physical aspects of the manufacturing process, such as the amount of steel scrap in making horseshoes, but they cannot control the price of steel or the price of horseshoes. For the most part, managers cannot influence prices but must take them as a given and try to produce more output from a given physical input or the same output using less physical input.
Proponents of productivity measures argue that basing managerial performance on productivity, which does not include uncontrollable price changes, yields a better indicator of the manager's performance. They argue that traditional accounting measures, such as net income, include many factors that managers cannot control and do not focus enough attention on factors that managers can control such as labor productivity. The following example illustrates productivity measurement systems in more detail.
Measuring productivity
If the firm produces several types of outputs (large and small horseshoes) and the mix of output varies over time, then the productivity measure must somehow aggregate the quantities of outputs into a single aggregate quantity. Likewise, several inputs must be aggregated to derive a homogeneous input measure. The measure of productivity (outputs/inputs) must aggregate the multiple inputs and the multiple outputs.
To measure firmwide productivity when multiple inputs and outputs exist, prices are used as the weighting factors. The productivity measure with two outputs and three inputs becomes:
Output ( i = 1 or 2) and input j ( j = 1, 2, or 3) denote the physical quantities of the i th output and the j th input. Price i and cost j are the corresponding output prices and input costs. If one then compares how productivity changes over time, this aggregate measure of productivity will vary with changes in both physical quantities and relative prices. But productivity measures should exclude noncontrollable price and cost changes, thereby focusing managers' attention on physical quantities.
To exclude price and cost changes from the performance measure, yet still have a way to aggregate multiple inputs and outputs, the following scheme is used:
1. Choose a base period year and use that year's prices and costs as the weights for future years. The base year should be one of high production, and a new base year should be chosen about every five years as the structures of production and prices change.
2. Weight the physical quantity of each input and output using the base period cost or price for that input or output.
3. Divide the weighted outputs by weighted inputs to compute the productivity index for the year.
4. Divide this year's productivity index by last year's to get the change in productivity.
A simple example with two inputs (steel and labor) and two outputs (small and large horseshoes) illustrates the mechanics of the computations. The following data summarize operations for the last two years:
TABLE 1 Physical Quantitie s Based on these data, the productivity measures are calculated as:
TABLE 2
Total productivity increased from 1.136 last year to 1.149 this year, or a 1.1 percent increase. Using base period prices, the productivity measure indicates that more output was produced using relatively less input.
In a study of productivity systems in Canada, few firms were found to measure aggregate firmwide productivity as the ratio of firm outputs to firm inputs. Instead, firms develop a few distinct nonfinancial measures that capture the essential strategic elements of their business. For example, a steel company tracks tons of steel shipped divided by tons of iron purchased and tons of steel shipped divided by number of employees. In an insurance company, the number of policies processed per employee in a particular department is reported. Other companies measure yield rates, defect rates, and production rates. The study concludes (p. 132), "We believe that productivity measures are operational aids in the strategic process that helps organization members keep track of what is required for the organization to achieve its long-run goals."
Required:
a. Critically analyze the productivity calculations in Table 2. Did the managers of the firm perform better this year compared with last year, as the productivity measures indicate?
b. Discuss some plausible reasons why comprehensive productivity systems have not been widely adopted by organizations.
c. Consider the situation of Burk Wheels. Burk Wheels manufactures aluminum automobile wheels (onto which rubber tires are mounted). The owner, Gerry Burk, is worried about increased competition from foreign countries (with lower labor costs) and is seeking to increase the productivity of her workers. She decides to implement a bonus system for direct line supervisors and department managers to reward them for improving labor productivity. In particular, supervisors will receive bonuses if they improve their department's labor productivity, defined as Output ÷ Labor hours. The casting department is the primary production process whereby molten aluminum is poured into molds, cooled, and then removed to form the wheels. Operating data for the casting department for the last two months prior to announcing the labor productivity incentive program are: Calculate the productivity of direct labor for March and April and discuss how labor productivity changed between March and April. Gerry Burk asks your opinion of her proposal to increase productivity by rewarding production supervisors and plant departmental managers for increasing labor productivity. Write Ms. Burk a memo outlining your views of her plan.
Background
Economists and managers have long recognized the importance of productivity in determining an organization's success. Productivity is the relation between the firm's output of goods and services and the inputs necessary to produce that output. If a firm is able to produce more output with the same inputs, we say it has improved its productivity. Likewise, if two firms produce the same quantity of goods and services but one firm uses less input, that firm is called more productive. Countries that produce more output per person generate more consumable wealth. Economists keep productivity statistics, and these numbers are reported in the financial press as measuring the competitiveness and well-being of that country.
In the 1970s many of the largest U.S. firms became interested in productivity and better ways to measure and improve their firms' productivity. Largely driven by foreign competition, these American firms were losing market share to Japanese and European rivals. Japanese auto companies were producing cars with fewer employee hours per car than American companies, thus offering lower-priced and often higher-quality cars than U.S. automakers. Foreign steel producers were more productive than their U.S. counterparts. Concerned about their declining relative productivity in 1977, large U.S. firms financed the formation of the American Productivity Center (later the American Productivity and Quality Center). To become more productive, some firms experimented with various productivity measures.
In its most basic form, productivity is defined as:
If the firm uses a single input (steel) to produce a single homogeneous product (horseshoes) that never changes over time, then the measure of productivity is the units of output per quantity of input, or the number of horseshoes per pound of steel. If steel waste is reduced, more horseshoes can be produced with the same amount of steel. One measure of productivity is the ratio of horseshoes to steel, in terms of physical volume. Steel is not the only input to making horseshoes. Labor is also an input, and labor is usually the input of most interest to managers. Productivity is usually thought of as the amount of output per unit of labor. Most managers want to know the number of horseshoes produced per person and how this number changes over time and compares to the competition.
Proponents of productivity measurement systems argue that managers should focus on productivity instead of accounting profits. A firm can appear profitable but can be experiencing declining productivity if selling prices are rising faster than input prices. Productivity measures help identify these cases. Managers control the physical aspects of the manufacturing process, such as the amount of steel scrap in making horseshoes, but they cannot control the price of steel or the price of horseshoes. For the most part, managers cannot influence prices but must take them as a given and try to produce more output from a given physical input or the same output using less physical input.
Proponents of productivity measures argue that basing managerial performance on productivity, which does not include uncontrollable price changes, yields a better indicator of the manager's performance. They argue that traditional accounting measures, such as net income, include many factors that managers cannot control and do not focus enough attention on factors that managers can control such as labor productivity. The following example illustrates productivity measurement systems in more detail.
Measuring productivity
If the firm produces several types of outputs (large and small horseshoes) and the mix of output varies over time, then the productivity measure must somehow aggregate the quantities of outputs into a single aggregate quantity. Likewise, several inputs must be aggregated to derive a homogeneous input measure. The measure of productivity (outputs/inputs) must aggregate the multiple inputs and the multiple outputs.
To measure firmwide productivity when multiple inputs and outputs exist, prices are used as the weighting factors. The productivity measure with two outputs and three inputs becomes:
Output ( i = 1 or 2) and input j ( j = 1, 2, or 3) denote the physical quantities of the i th output and the j th input. Price i and cost j are the corresponding output prices and input costs. If one then compares how productivity changes over time, this aggregate measure of productivity will vary with changes in both physical quantities and relative prices. But productivity measures should exclude noncontrollable price and cost changes, thereby focusing managers' attention on physical quantities.
To exclude price and cost changes from the performance measure, yet still have a way to aggregate multiple inputs and outputs, the following scheme is used:
1. Choose a base period year and use that year's prices and costs as the weights for future years. The base year should be one of high production, and a new base year should be chosen about every five years as the structures of production and prices change.
2. Weight the physical quantity of each input and output using the base period cost or price for that input or output.
3. Divide the weighted outputs by weighted inputs to compute the productivity index for the year.
4. Divide this year's productivity index by last year's to get the change in productivity.
A simple example with two inputs (steel and labor) and two outputs (small and large horseshoes) illustrates the mechanics of the computations. The following data summarize operations for the last two years:
TABLE 1 Physical Quantitie s
Based on these data, the productivity measures are calculated as:TABLE 2
Total productivity increased from 1.136 last year to 1.149 this year, or a 1.1 percent increase. Using base period prices, the productivity measure indicates that more output was produced using relatively less input.
In a study of productivity systems in Canada, few firms were found to measure aggregate firmwide productivity as the ratio of firm outputs to firm inputs. Instead, firms develop a few distinct nonfinancial measures that capture the essential strategic elements of their business. For example, a steel company tracks tons of steel shipped divided by tons of iron purchased and tons of steel shipped divided by number of employees. In an insurance company, the number of policies processed per employee in a particular department is reported. Other companies measure yield rates, defect rates, and production rates. The study concludes (p. 132), "We believe that productivity measures are operational aids in the strategic process that helps organization members keep track of what is required for the organization to achieve its long-run goals."
Required:
a. Critically analyze the productivity calculations in Table 2. Did the managers of the firm perform better this year compared with last year, as the productivity measures indicate?
b. Discuss some plausible reasons why comprehensive productivity systems have not been widely adopted by organizations.
c. Consider the situation of Burk Wheels. Burk Wheels manufactures aluminum automobile wheels (onto which rubber tires are mounted). The owner, Gerry Burk, is worried about increased competition from foreign countries (with lower labor costs) and is seeking to increase the productivity of her workers. She decides to implement a bonus system for direct line supervisors and department managers to reward them for improving labor productivity. In particular, supervisors will receive bonuses if they improve their department's labor productivity, defined as Output ÷ Labor hours. The casting department is the primary production process whereby molten aluminum is poured into molds, cooled, and then removed to form the wheels. Operating data for the casting department for the last two months prior to announcing the labor productivity incentive program are:
Calculate the productivity of direct labor for March and April and discuss how labor productivity changed between March and April. Gerry Burk asks your opinion of her proposal to increase productivity by rewarding production supervisors and plant departmental managers for increasing labor productivity. Write Ms. Burk a memo outlining your views of her plan. فتح الحزمة
افتح القفل للوصول البطاقات البالغ عددها 18 في هذه المجموعة.
فتح الحزمة
k this deck
18
Guest Watches
Guest Watches is a division of Guest Fashions, a large, international fashion designer. Guest Watches manufactures highly stylish watches for young adults (age 18 to 30) who are fashion conscious. It is a profit center and its senior management's compensation is tied closely to the reported profits. While Guest Watches has succeeded in capturing the fashion market, product dependability is eroding these gains. A number of retailers have dropped or are threatening to drop the Guest watch line because of customer returns. Guest watches carry a one-year warranty and 12 percent are returned, compared with an industry average of 4 percent. Besides high warranty costs and lost sales due to reputation, Guest Watches has higher-than-industry-average manufacturing scrap and rework costs.
Senior management, worried about these trends and the possible erosion of its market dominance, hired a consulting firm to study the problem and make recommendations for reversing the situation. After a thorough analysis of Guest Watches's customers, suppliers, and manufacturing facilities, the consultants recommended five possible actions ranging from the status quo to a complete Total Quality Management, Zero Defects program (level IV). The accompanying table outlines the various alternatives for Guest Watches. (Dollar figures are in thousands.) * Includes the annual costs of training employees in TQM methods.
† All annual costs including certifying suppliers, redesigning the product, and
inspection costs to reduce defects.
The consultants emphasized that while first-year startup costs are slightly higher than in subsequent years, management must really view the above cost estimates as annual ongoing costs. Given employee turnover and supplier changes, training, prevention, and compliance costs are not likely to decline over time.
The consulting firm and the newly appointed vice president for quality programs estimated that under level IV, rework and scrap would be $25,000 and warranty costs zero. Level IV was needed to get the firm to zero defects. A task force was convened and after several meetings generated the following estimates of rework/scrap and warranty costs for the various levels of firm commitment: * The costs of manufacturing scrap and rework.
† The costs of repairing and replacing products that fail in the hands of customers.
There was considerable discussion and debate about the quantitative impact of increased quality on additional sales. While no hard and fast numbers could be derived, the consensus view was that the total net cash flows (contribution margin) from additional sales as retailers and customers learn of the reduced defect rate would be Required:
a. Assuming that the data as presented are reasonably accurate, what should Guest Watches do about its deteriorating quality situation? Should it maintain the status quo or should it adopt the consultants' recommendation and implement level I, II, III, or IV?
b. Evaluate the analysis underlying your policy recommendation in ( a ). Will the senior management of the Watch Division make the same decision as the senior management of Guest Fashions?
Guest Watches is a division of Guest Fashions, a large, international fashion designer. Guest Watches manufactures highly stylish watches for young adults (age 18 to 30) who are fashion conscious. It is a profit center and its senior management's compensation is tied closely to the reported profits. While Guest Watches has succeeded in capturing the fashion market, product dependability is eroding these gains. A number of retailers have dropped or are threatening to drop the Guest watch line because of customer returns. Guest watches carry a one-year warranty and 12 percent are returned, compared with an industry average of 4 percent. Besides high warranty costs and lost sales due to reputation, Guest Watches has higher-than-industry-average manufacturing scrap and rework costs.
Senior management, worried about these trends and the possible erosion of its market dominance, hired a consulting firm to study the problem and make recommendations for reversing the situation. After a thorough analysis of Guest Watches's customers, suppliers, and manufacturing facilities, the consultants recommended five possible actions ranging from the status quo to a complete Total Quality Management, Zero Defects program (level IV). The accompanying table outlines the various alternatives for Guest Watches. (Dollar figures are in thousands.)
* Includes the annual costs of training employees in TQM methods.† All annual costs including certifying suppliers, redesigning the product, and
inspection costs to reduce defects.
The consultants emphasized that while first-year startup costs are slightly higher than in subsequent years, management must really view the above cost estimates as annual ongoing costs. Given employee turnover and supplier changes, training, prevention, and compliance costs are not likely to decline over time.
The consulting firm and the newly appointed vice president for quality programs estimated that under level IV, rework and scrap would be $25,000 and warranty costs zero. Level IV was needed to get the firm to zero defects. A task force was convened and after several meetings generated the following estimates of rework/scrap and warranty costs for the various levels of firm commitment:
* The costs of manufacturing scrap and rework.† The costs of repairing and replacing products that fail in the hands of customers.
There was considerable discussion and debate about the quantitative impact of increased quality on additional sales. While no hard and fast numbers could be derived, the consensus view was that the total net cash flows (contribution margin) from additional sales as retailers and customers learn of the reduced defect rate would be
Required: a. Assuming that the data as presented are reasonably accurate, what should Guest Watches do about its deteriorating quality situation? Should it maintain the status quo or should it adopt the consultants' recommendation and implement level I, II, III, or IV?
b. Evaluate the analysis underlying your policy recommendation in ( a ). Will the senior management of the Watch Division make the same decision as the senior management of Guest Fashions?
فتح الحزمة
افتح القفل للوصول البطاقات البالغ عددها 18 في هذه المجموعة.
فتح الحزمة
k this deck
فتح الحزمة
افتح القفل للوصول البطاقات البالغ عددها 18 في هذه المجموعة.


