Deck 8: Estimation
ملء الشاشة (f)
سؤال
Statistical Literacy Consider a random sample of size n from an x distribution. For such a sample, the margin of error for estimating is the magnitude of the difference between
 and .
and .
and . سؤال
FBI Report: Larceny Thirty small communities in Connecticut (population near 10,000 each) gave an average of
 = 138.5 reported cases of larceny per year. Assume that is known to be 42.6 cases per year (Reference: Crime in the United States, Federal Bureau of Investigation).
(a) Find a 90% confidence interval for the population mean annual number of reported larceny cases in such communities. What is the margin of error
(b) Find a 95% confidence interval for the population mean annual number of reported larceny cases in such communities. What is the margin of error
(c) Find a 99% confidence interval for the population mean annual number of reported larceny case in such communities. What is the margin of error
(d) Compare the margins of error for parts (a) through (c). As the confidence levels increase, do the margins of error increase
(e) Critical Thinking Compare the lengths of the confidence intervals for parts (a) through (c). As the confidence levels increase, do the confidence intervals increase in length
= 138.5 reported cases of larceny per year. Assume that is known to be 42.6 cases per year (Reference: Crime in the United States, Federal Bureau of Investigation).(a) Find a 90% confidence interval for the population mean annual number of reported larceny cases in such communities. What is the margin of error
(b) Find a 95% confidence interval for the population mean annual number of reported larceny cases in such communities. What is the margin of error
(c) Find a 99% confidence interval for the population mean annual number of reported larceny case in such communities. What is the margin of error
(d) Compare the margins of error for parts (a) through (c). As the confidence levels increase, do the margins of error increase
(e) Critical Thinking Compare the lengths of the confidence intervals for parts (a) through (c). As the confidence levels increase, do the confidence intervals increase in length
سؤال
سؤال
سؤال
سؤال
Medical: Blood Type A random sample of medical files is used to estimate the proportion p of all people who have blood type B.
(a) If you have no preliminary estimate for p, how many medical files should you include in a random sample in order to be 85% sure that the point estimate
 will be within a distance of 0.05 from p
(b) Answer part (a) if you use the preliminary estimate that about 8 out of 90 people have blood type B (Reference: Manual of Laboratory and Diagnostic Tests by F. Fischbach).
(a) If you have no preliminary estimate for p, how many medical files should you include in a random sample in order to be 85% sure that the point estimate
will be within a distance of 0.05 from p (b) Answer part (a) if you use the preliminary estimate that about 8 out of 90 people have blood type B (Reference: Manual of Laboratory and Diagnostic Tests by F. Fischbach).
سؤال
سؤال
سؤال
سؤال
سؤال
Archaeology: Pottery Three-circle, red-on-white is one distinctive pattern painted on ceramic vessels of the Anasazi period found at the Wind Mountain archaeological site (see source for Problem 7). At one excavation, a sample of 167 potsherds indicated that 68 were of the three-circle, red-on-white pattern.
(a) Find a point estimate
 for the proportion of all ceramic potsherds at this site that are of the three-circle, red-on-white pattern.
(b) Compute a 95% confidence interval for the population proportion p of all ceramic potsherds with this distinctive pattern found at this site.
(a) Find a point estimate
for the proportion of all ceramic potsherds at this site that are of the three-circle, red-on-white pattern.(b) Compute a 95% confidence interval for the population proportion p of all ceramic potsherds with this distinctive pattern found at this site.
سؤال
Business: Phone Contact How hard is it to reach a businessperson by phone Let p be the proportion of calls to businesspeople for which the caller reaches the person being called on the first try.
(a) If you have no preliminary estimate for p. how many business phone calls should you include in a random sample to be 80% sure that the point estimate
 will be within a distance of 0.03 from p
(b) The Book of Odds by Shook and Shook (Signet) reports that businesspeople can be reached by a single phone call approximately 17% of the time. Using this (national) estimate for p, answer part (a).
(a) If you have no preliminary estimate for p. how many business phone calls should you include in a random sample to be 80% sure that the point estimate
will be within a distance of 0.03 from p (b) The Book of Odds by Shook and Shook (Signet) reports that businesspeople can be reached by a single phone call approximately 17% of the time. Using this (national) estimate for p, answer part (a).
سؤال
سؤال
سؤال
سؤال
سؤال
سؤال
Campus Life: Coeds. What percentage of your campus student body is female Let p be the proportion of women students on your campus.
(a) If no preliminary study is made to estimate p.how large a sample is needed to be 99% sure that a point estimate
 will be within a distance of 0.05 from p
(b) The Statistical Abstract of the United States. 112th Edition, indicates that approximately 54% of college students are female. Answer part (a) using this estimate for p.
(a) If no preliminary study is made to estimate p.how large a sample is needed to be 99% sure that a point estimate
will be within a distance of 0.05 from p (b) The Statistical Abstract of the United States. 112th Edition, indicates that approximately 54% of college students are female. Answer part (a) using this estimate for p.
سؤال
سؤال
Ecology: Sand Dunes At wind speeds above 1000 centimeters per second (cm/sec), significant sand-moving events begin to occur. Wind speeds below 1000 cm/sec deposit sand, and wind speeds above 1000 cm/sec move sand to new locations. The cyclic nature of wind and moving sand determines the shape and location of large dunes (Reference: Hydraulic, Geologic, and Biologic Research at Great Sand Dunes National Monument and Vicinity, Colorado, Proceedings of the National Park Service Research Symposium). At a test site, the prevailing direction of the wind did not change noticeably. However, the velocity did change. Sixty wind speed readings gave an average velocity of
 = 1075cm/sec Based on long-term experience, can be assumed to be 265 cm/sec.
(a) Find a 95% confident interval for the population mean wind speed at this site.
(b) Interpretation Does the confidence interval indicate that the population mean wind speed is such that the sand is always moving at this site Explain.
= 1075cm/sec Based on long-term experience, can be assumed to be 265 cm/sec.(a) Find a 95% confident interval for the population mean wind speed at this site.
(b) Interpretation Does the confidence interval indicate that the population mean wind speed is such that the sand is always moving at this site Explain.
سؤال
In Problems 13-19, assume that the population of x values has an approximately normal distribution.
Archaeology: Tree Rings At Burnt Mesa Pueblo, the method of tree-ring dating gave the following years A. D, for an archaeological excavation site (Bandelier Archaeological Excavation Project: Summer 1990 Excavations at Burnt Mesa Pueblo, edited by Kohler, Washington State University):
1189.1271 1267 1272 1268 1316 1275 1317 1275
(a) Use a calculator with mean and standard deviation keys to verify that the sample mean year is
 1272, with sample standard deviation s 37 years.
(b) Find a 90% confidence interval for the mean of all tree-ring dates from this archaeological site.
(c) Interpretation What does the confidence interval mean in the context of this problem
Archaeology: Tree Rings At Burnt Mesa Pueblo, the method of tree-ring dating gave the following years A. D, for an archaeological excavation site (Bandelier Archaeological Excavation Project: Summer 1990 Excavations at Burnt Mesa Pueblo, edited by Kohler, Washington State University):
1189.1271 1267 1272 1268 1316 1275 1317 1275
(a) Use a calculator with mean and standard deviation keys to verify that the sample mean year is
1272, with sample standard deviation s 37 years.(b) Find a 90% confidence interval for the mean of all tree-ring dates from this archaeological site.
(c) Interpretation What does the confidence interval mean in the context of this problem
سؤال
سؤال
Archaeology: Pottery Consider the three-circle, red-on-white pattern discussed in Problem 11. How many ceramic potsherds must be found and identified if we are to be 95% confident that the sample proportion
 of such potsherds is within 6% of the population proportion of three-circle, red-on-white patterns found at this excavation site Hint: Use the results of Problem 11 as a preliminary estimate.
of such potsherds is within 6% of the population proportion of three-circle, red-on-white patterns found at this excavation site Hint: Use the results of Problem 11 as a preliminary estimate. سؤال
Small Business: Bankruptcy The National Council of Small Businesses is interested in the proportion of small businesses that declared Chapter 11 bankruptcy last year. Since there are so many small businesses, the National Council intends to estimate the proportion from a random sample. Let p be the proportion of small businesses that declared Chapter 11 bankruptcy last year.
(a) If no preliminary sample taken to estimate p , how large a sample is necessary to be 95% sure that a point estimate
 will be within a distance of 0.10 from p
(b) In a preliminary random sample of 38 small businesses, it was found that six had declared Chapter 11 bankruptcy. How many more small businesses should be included in the sample to be 95% sure that a point estimate
 will be within a distance of 0.10 from p
(a) If no preliminary sample taken to estimate p , how large a sample is necessary to be 95% sure that a point estimate
will be within a distance of 0.10 from p (b) In a preliminary random sample of 38 small businesses, it was found that six had declared Chapter 11 bankruptcy. How many more small businesses should be included in the sample to be 95% sure that a point estimate
will be within a distance of 0.10 from p سؤال
سؤال
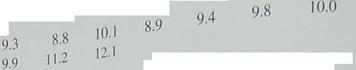
Profits: Banks Jobs and productivity! How do banks rate One way to answer this question is to examine annual profits per employee. Forbes Top Companies, edited by J. T. Davis (John Wiley sons), gave the following data about annual profits per employee (in units of one thousand dollars per employee) for representative companies in financial services. Companies such as Wells Fargo, First Bank System, and Key Banks were included. Assume = 10.2 thousand dollars.
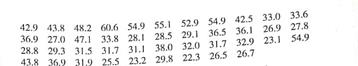
(a) Use a calculator or appropriate computer software to verify that, for the preceding data,
 36.0.
36.0.
(b) Let us say that the preceding data are representative of the entire sector of (successful) financial services corporations. Find a 75% confidence interval for , the average annual profit per employee for all successful bans.
(c) Interpretation Let us say that you are the manager of a local bank with a large number of employees. Suppose the annual profits per employee are less than 30 thousand dollars per employee. Do you think this might be somewhat low compared with other successful financial institutions Explain by referring to the confidence interval you computed in part (b).
(d) Interpretation Suppose the annual profits are more than 40 thousand dollars per employee. As manager of the bank, would you feel somewhat better Explain by referring to the confidence interval you computed in part (b).
(e) Repeat parts (b), (c), and (d) for a 90% confidence level.
(a) Use a calculator or appropriate computer software to verify that, for the preceding data,
36.0.(b) Let us say that the preceding data are representative of the entire sector of (successful) financial services corporations. Find a 75% confidence interval for , the average annual profit per employee for all successful bans.
(c) Interpretation Let us say that you are the manager of a local bank with a large number of employees. Suppose the annual profits per employee are less than 30 thousand dollars per employee. Do you think this might be somewhat low compared with other successful financial institutions Explain by referring to the confidence interval you computed in part (b).
(d) Interpretation Suppose the annual profits are more than 40 thousand dollars per employee. As manager of the bank, would you feel somewhat better Explain by referring to the confidence interval you computed in part (b).
(e) Repeat parts (b), (c), and (d) for a 90% confidence level.
سؤال
In Problems 13-19, assume that the population of x values has an approximately normal distribution.
Camping: Cost of a Sleeping Bag How much does a sleeping bag cost Let's say you want a sleeping bag that should keep you warm in temperatures from 20°F to 45°F. A random sample of prices ($) for sleeping bags in this temperature range was taken from Backpacker Magazine: Gear Guide (Vol. 25, Issue 157, No. 2). Brand names include American Camper, Cabela's, Camp 7, Caribou, Cascade, and Coleman.
(a) Use a calculator with mean and sample standard deviation keys to verity that
 $83.75 and s = $28.97.
(b) Using the given data as representative of the population of prices of all summer sleeping bags, find a 90% confidence interval for the mean price of all summer sleeping bags.
(c) Interpretation What does the confidence interval mean in the context of this problem
Camping: Cost of a Sleeping Bag How much does a sleeping bag cost Let's say you want a sleeping bag that should keep you warm in temperatures from 20°F to 45°F. A random sample of prices ($) for sleeping bags in this temperature range was taken from Backpacker Magazine: Gear Guide (Vol. 25, Issue 157, No. 2). Brand names include American Camper, Cabela's, Camp 7, Caribou, Cascade, and Coleman.
(a) Use a calculator with mean and sample standard deviation keys to verity that
$83.75 and s = $28.97.(b) Using the given data as representative of the population of prices of all summer sleeping bags, find a 90% confidence interval for the mean price of all summer sleeping bags.
(c) Interpretation What does the confidence interval mean in the context of this problem
سؤال
سؤال
سؤال
سؤال
سؤال
Profits: Retail Jobs and productivity! How do retail stores rate One way to answer this question is to examine annual profits per employee. The following data give annual profits per employee (in units of one thousand dollars per employee) for companies in retail sales. (See reference in Problem 23.) Companies such as Gap, Nordstrom, Dillards, JCPenney, Sears, Walrmart, Office Depot, and Toys "" Us are included. Assume 3.8 thousand dollars.
(a) Use a calculator or appropriate computer software to verify that, for the preceding data,
 5.1.
5.1.
(b) Let us say that the preceding data are representative of the entire sector of retail sales companies. Find an 80% confidence interval for , the average annual profit per employee for retail sales.
(c) Interpretation Let us say that you are the manager of a retail store with a large number of employees. Suppose the annual profits per employee are less than 3 thousand dollars per employee. Do you think this might be low compared with other retail stores Explain by referring to the confidence interval you computed in part (b).
(d) Interpretation Suppose the annual profits are more than 6.5 thousand dollars per employee. As store manager, would you feel somewhat better Explain by referring to the confidence interval you computed in part (b).
(e) Repeat parts (b), (c), and (d) for a 95% confidence interval.
(a) Use a calculator or appropriate computer software to verify that, for the preceding data,
5.1.(b) Let us say that the preceding data are representative of the entire sector of retail sales companies. Find an 80% confidence interval for , the average annual profit per employee for retail sales.
(c) Interpretation Let us say that you are the manager of a retail store with a large number of employees. Suppose the annual profits per employee are less than 3 thousand dollars per employee. Do you think this might be low compared with other retail stores Explain by referring to the confidence interval you computed in part (b).
(d) Interpretation Suppose the annual profits are more than 6.5 thousand dollars per employee. As store manager, would you feel somewhat better Explain by referring to the confidence interval you computed in part (b).
(e) Repeat parts (b), (c), and (d) for a 95% confidence interval.
سؤال
In Problems 13-19, assume that the population of x values has an approximately normal distribution.
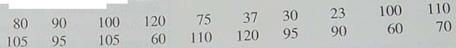
Franchise: Candy Store Do you want to own your own candy store With some interest in running your own business and a decent credit rating, you can probably get a bank loan on startup costs for franchises such as Candy Express, The Fudge Company, Karmel Corn, and Rocky Mountain Chocolate Factory. Startup costs (in thousands of dollars) for a random sample of candy stores are given below (Source: Entrepreneur Magazine , Vol. 23, No. 10).
95 173 129 95 75 94 116 100 85
(a) Use a calculator with mean and sample stand deviation keys to verify that
 106.9 thousand dollars and s 29.4 thousand dollars.
(b) Find a 90% confidence interval for the population average startup costs for candy store franchises.
(c) Interpretation What does the confidence interval mean in the context of this problem
Franchise: Candy Store Do you want to own your own candy store With some interest in running your own business and a decent credit rating, you can probably get a bank loan on startup costs for franchises such as Candy Express, The Fudge Company, Karmel Corn, and Rocky Mountain Chocolate Factory. Startup costs (in thousands of dollars) for a random sample of candy stores are given below (Source: Entrepreneur Magazine , Vol. 23, No. 10).
95 173 129 95 75 94 116 100 85
(a) Use a calculator with mean and sample stand deviation keys to verify that
106.9 thousand dollars and s 29.4 thousand dollars.(b) Find a 90% confidence interval for the population average startup costs for candy store franchises.
(c) Interpretation What does the confidence interval mean in the context of this problem
سؤال
Psychology: Closure Three experiments investigating the relationship between need for cognitive closure and persuasion were reported in "Motivated Resistance and Openness to Persuasion in the Presence or Absence of Prior Information" by A. W. Kruglanski (Journal of Personality and Social Psychology, Vol. 65, No. 5, pp. 861-874). Part of the study involved administering a "need for closure scale" to a group of students enrolled in an introductory psychology course. The "need for closure scale" has scores ranging from 101 to 201. For the 73 students in the highest quartile of the distribution, the mean score was
 = 178.70. Assume a population standard deviation of = 7.81. These students were all classified as high on their need for closure. Assume that the 73 students represent a random sample of all students who are classified as high on their need for closure. Find a 95% confidence interval for the population mean score on the "need for closure scale" for all students with a high need for closure.
= 178.70. Assume a population standard deviation of = 7.81. These students were all classified as high on their need for closure. Assume that the 73 students represent a random sample of all students who are classified as high on their need for closure. Find a 95% confidence interval for the population mean score on the "need for closure scale" for all students with a high need for closure. سؤال
Expand Your Knowledge: Two Confidence Intervals What happens if we want several confidence intervals to hold at the same time (concurrently) Do we still have the same level of confidence we had for each individual interval
(a) Suppose we have two independent random variables x 1 and x 2 with respective population means 1 and 2. Let us say that we use sample data to construct two 80% confidence intervals.
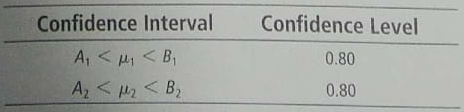
Now, what is the probability that both intervals hold at the same time
Use methods of Section 5.2 to show that
P ( A 1 1 B 1 and A 2 2 B 2 ) = 0.64
Hint: You are combining independent events. If the confidence is 64% that both intervals hold concurrently, explain why the risk that at least one interval does not hold (i.e., fails) must be 36%.
(b) Suppose we want both intervals to hold with 90% confidence (i.e., only 10% risk level). How much confidence c should each interval have to achieve this combinined level of confidence (Assume that each interval has the same confidence level c.)
Hint: P ( A 1 1 B 1 and A 2 2 B 2 ) = 0.90
P ( A 1 1 B 1 ) × P ( A 2 2 B 2 ) = 0.90
Now solve foe c.
(c) If we want both intervals to hold at the 90% level of confidence, then the individual intervals must hold at a higher level of confidence. Write a brief but detailed explanation of how this could be of importance in a large, complex engineering design such as a rocket booster or a spacecraft.
(a) Suppose we have two independent random variables x 1 and x 2 with respective population means 1 and 2. Let us say that we use sample data to construct two 80% confidence intervals.
Now, what is the probability that both intervals hold at the same time
Use methods of Section 5.2 to show that
P ( A 1 1 B 1 and A 2 2 B 2 ) = 0.64
Hint: You are combining independent events. If the confidence is 64% that both intervals hold concurrently, explain why the risk that at least one interval does not hold (i.e., fails) must be 36%.
(b) Suppose we want both intervals to hold with 90% confidence (i.e., only 10% risk level). How much confidence c should each interval have to achieve this combinined level of confidence (Assume that each interval has the same confidence level c.)
Hint: P ( A 1 1 B 1 and A 2 2 B 2 ) = 0.90
P ( A 1 1 B 1 ) × P ( A 2 2 B 2 ) = 0.90
Now solve foe c.
(c) If we want both intervals to hold at the 90% level of confidence, then the individual intervals must hold at a higher level of confidence. Write a brief but detailed explanation of how this could be of importance in a large, complex engineering design such as a rocket booster or a spacecraft.
سؤال
Expand Your Knowledge: Plus Four Confidence Interval for a Single Proportion One of the technical difficulties that arises in the computation of confidence intervals for a single proportion is that the exact formula for the maximal margin of error requires knowledge of the population proportionof success p. Since p is usually not known, we use the sample estimate
 = r/n in place of p. As discussed in the article "How Much Confidence Should You Have in Binomial Confidence Intervals" appearing in issue no. 45 of the magazine STATS (a publication of the American Statistical Association), use of
 as an estimate for p means that the actual confidence level for the intervals may in fact be smaller than the specified level c. This problem arises even when n is large, especially if p is not near 1/2.
A simple adjustment to the formula for the confidence intervals is the plus four estimate, first suggested by Edwin Bidwell Wilson in 1927. It is also called the Agresti-Coull confidence interval. This adjustment works best for 95% confidence intervals.
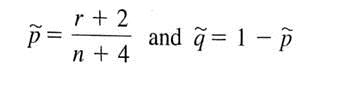
The plus four adjustment has us add two successes and two failures to the sample data. This means that r , the number of successes, is increased by 2, and n, the sample size is increased by 4. We use the symbol
 , read " P tilde, " for the resulting sample estimate of p. So,
 = (r + 2)/( n + 4)
PROCEDURE
HOW TO COMPUTE A PLUS FOUR CONFIDENCE INTERVAL FOR p
Requirements
Consider a binomial experiment with n trials, where p represents the population probability of success and q = 1 - p represents the population probability of failure. Let r be a random variable that represents the number of successes out of the n binomial trials.
The plus four point estimates for p and q are
The number of trials n should be at least 10.
Approximate confidence interval for p
 - E p
- E p
 + E
+ E
Where
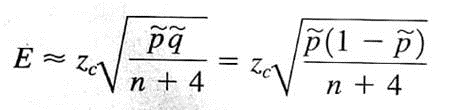
c = confidence level (0 c 1)
z c = critical value for confidence level c based on the standard normal distribution
(a) Consider a random sample of 50 trials with 20 successes. Compute a 95% confidence interval for p using the plus four method.
(b) Compute a traditional 95% confidence interval for p using a random sample of 50 trials with 20 successes.
(c) Compare the lengths of the intervals obtained using the two methods. Is the point estimate closer to 1/2 when using the plus four method Is the margin of error smaller when using the plus four method
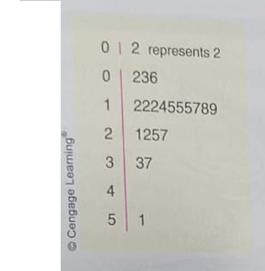
Consider the following random sample of size 20
12 15 21 2 6 3 15 51 22 18
37 12 25 19 33 15 14 17 12 27
A stem-and-leaf display shows that the data are skewed with one outlier.
We can use Minitab to model the bootstrap method for constructing confidence intervals for . (The Professional edition of Minitab is required because of spreadsheet size and other limitations of the Student edition.) This demonstration uses only 1000 samples. Bootstrap uses many thousands.
Step 1 : Create 1000 new samples, each of size 20, by sampling with replacement from the original data. To do this in Minitab, we enter the original 20 data values in column Cl. Then, in column C2, we place equal probabilities of 0.05 beside each of the original data values. Use the menu choices Calc
 Random Data
 Discrete. In the dialogue box, fill in 1000 as the number of rows, store the data in columns C11-C30, and use column C1 for values and column C2 for probabilities.
Step 2 : Find the sample mean of each of the 1000 samples. To do this in Minitab, use the menu choices Calc
 Row Statistics. In the dialogue box, select mean. Use columns C11-C30 as the input variables and store the results in column C31.
Step3 : Order the 1000 means from smallest to largest. In Minitab, use the menu choices Manip Sort. In the dialogue box, indicate C31 as the column to be sorted. Store the results in column C32. Sort by values in column C3I.
Step 4 : Create a 95% confidence interval by finding the boundaries for the middle 95% of the data. In other words, you need to find the values of the 2.5 percentile ( p 2.5 ) and the 97.5 percentile ( P 97. 5 ). Since there are 1000 data values, the 2.5 percentile is the data value in position 25, while the 97.5 percentile is the data value in position 975. The confidence interval is ( p 2.5 ) P 97. 5.
Demonstration Results
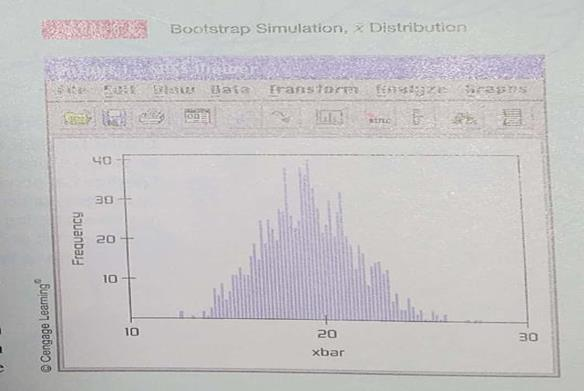
Figure 8-9 shows a histogram of the 1000
 values from one bootstrap simulation. Three bootstrap simulations produced the following 95% confidence intervals.
13.90 to 23.90
14.00 to 24.15
14.05 to 23.8
Using the t distribution on the sample data. Minitab produced the interval 13.33 to 24.27. The results of the bootstrap simulations and the t distribution method are quite close.
= r/n in place of p. As discussed in the article "How Much Confidence Should You Have in Binomial Confidence Intervals" appearing in issue no. 45 of the magazine STATS (a publication of the American Statistical Association), use of as an estimate for p means that the actual confidence level for the intervals may in fact be smaller than the specified level c. This problem arises even when n is large, especially if p is not near 1/2.A simple adjustment to the formula for the confidence intervals is the plus four estimate, first suggested by Edwin Bidwell Wilson in 1927. It is also called the Agresti-Coull confidence interval. This adjustment works best for 95% confidence intervals.
The plus four adjustment has us add two successes and two failures to the sample data. This means that r , the number of successes, is increased by 2, and n, the sample size is increased by 4. We use the symbol
, read " P tilde, " for the resulting sample estimate of p. So, = (r + 2)/( n + 4)PROCEDURE
HOW TO COMPUTE A PLUS FOUR CONFIDENCE INTERVAL FOR p
Requirements
Consider a binomial experiment with n trials, where p represents the population probability of success and q = 1 - p represents the population probability of failure. Let r be a random variable that represents the number of successes out of the n binomial trials.
The plus four point estimates for p and q are
The number of trials n should be at least 10.
Approximate confidence interval for p
- E p + E Where
c = confidence level (0 c 1)
z c = critical value for confidence level c based on the standard normal distribution
(a) Consider a random sample of 50 trials with 20 successes. Compute a 95% confidence interval for p using the plus four method.
(b) Compute a traditional 95% confidence interval for p using a random sample of 50 trials with 20 successes.
(c) Compare the lengths of the intervals obtained using the two methods. Is the point estimate closer to 1/2 when using the plus four method Is the margin of error smaller when using the plus four method
Consider the following random sample of size 20
12 15 21 2 6 3 15 51 22 18
37 12 25 19 33 15 14 17 12 27
A stem-and-leaf display shows that the data are skewed with one outlier.
We can use Minitab to model the bootstrap method for constructing confidence intervals for . (The Professional edition of Minitab is required because of spreadsheet size and other limitations of the Student edition.) This demonstration uses only 1000 samples. Bootstrap uses many thousands.
Step 1 : Create 1000 new samples, each of size 20, by sampling with replacement from the original data. To do this in Minitab, we enter the original 20 data values in column Cl. Then, in column C2, we place equal probabilities of 0.05 beside each of the original data values. Use the menu choices Calc
Random Data Discrete. In the dialogue box, fill in 1000 as the number of rows, store the data in columns C11-C30, and use column C1 for values and column C2 for probabilities.Step 2 : Find the sample mean of each of the 1000 samples. To do this in Minitab, use the menu choices Calc
Row Statistics. In the dialogue box, select mean. Use columns C11-C30 as the input variables and store the results in column C31.Step3 : Order the 1000 means from smallest to largest. In Minitab, use the menu choices Manip Sort. In the dialogue box, indicate C31 as the column to be sorted. Store the results in column C32. Sort by values in column C3I.
Step 4 : Create a 95% confidence interval by finding the boundaries for the middle 95% of the data. In other words, you need to find the values of the 2.5 percentile ( p 2.5 ) and the 97.5 percentile ( P 97. 5 ). Since there are 1000 data values, the 2.5 percentile is the data value in position 25, while the 97.5 percentile is the data value in position 975. The confidence interval is ( p 2.5 ) P 97. 5.
Demonstration Results
Figure 8-9 shows a histogram of the 1000
values from one bootstrap simulation. Three bootstrap simulations produced the following 95% confidence intervals.13.90 to 23.90
14.00 to 24.15
14.05 to 23.8
Using the t distribution on the sample data. Minitab produced the interval 13.33 to 24.27. The results of the bootstrap simulations and the t distribution method are quite close.
سؤال
سؤال
Ballooning: Air Temperature How hot is the air in the top (crown) of a hot air balloon Information from Ballooning: The Complete Guide to Riding the Winds by Wirth and Young (Random House) claims that the air in the crown should be an average of 100°C for a balloon to be in a state of equilibrium. However, the temperature does not need to be exactly 100°C. What is a reasonable and safe range of temperatures This range may vary with the size and (decorative) shape of the balloon. All balloons have a temperature gauge in the crown. Suppose that 56 readings (for a balloon in equilibrium) gave a mean temperature of
 = 97°C. For this balloon, 17°C.
(a) Compute a 95% confidence interval for the average temperature at which this balloon will be in a steady-state equilibrium.
(b) Interpretation If the average temperature in the crown of the balloon goes above the high end of your confidence interval, do you expect that the balloon will go up or down Explain.
= 97°C. For this balloon, 17°C.(a) Compute a 95% confidence interval for the average temperature at which this balloon will be in a steady-state equilibrium.
(b) Interpretation If the average temperature in the crown of the balloon goes above the high end of your confidence interval, do you expect that the balloon will go up or down Explain.
سؤال
In Problems 13-19, assume that the population of x values has an approximately normal distribution.
Diagnostic Tests: Total Calcium Over the past several months, an adult patient has been treated for tetany (severe muscle spasms). This condition is associated with an average total calcium level below 6 mg/dl (Reference: Manual of Laboratory and Diagnostic Tests by F. Fischbach). Recently, the patient's total calcium tests gave the following readings (in mg/dl).
(a) Use a calculator to verify that
 = 9.95 and s 1.02.
(b) Find a 99.9% confidence interval for the population mean of total calcium in this patient's blood.
(c) Interpretation Based on your results in part (b), does it seem that this patient still has a calcium deficiency Explain.
Diagnostic Tests: Total Calcium Over the past several months, an adult patient has been treated for tetany (severe muscle spasms). This condition is associated with an average total calcium level below 6 mg/dl (Reference: Manual of Laboratory and Diagnostic Tests by F. Fischbach). Recently, the patient's total calcium tests gave the following readings (in mg/dl).
(a) Use a calculator to verify that
= 9.95 and s 1.02.(b) Find a 99.9% confidence interval for the population mean of total calcium in this patient's blood.
(c) Interpretation Based on your results in part (b), does it seem that this patient still has a calcium deficiency Explain.
سؤال
سؤال
سؤال
سؤال
سؤال
In Problems 13-19, assume that the population of x values has an approximately normal distribution.
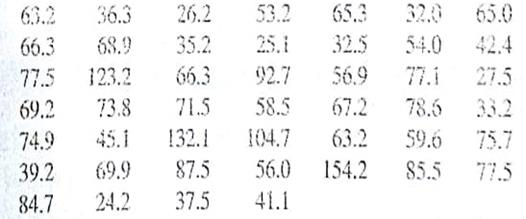
Hospitals: Charity Care What percentage of hospitals provide at least some charity care The following problem is based on information taken from State Health Care Data: Utilization, Spending and Characteristics (American Medical Association). Based on random sample of hospital reports from eastern states, the following information was obtained (units in percentage of hospitals providing at least some charity care).
57.1 56.2 53.0 66.1 59.0 64.7 70.1 64.7 53.5 78.2
(a) Use a calculator with mean and sample standard deviation keys to verify that
 62.3% and s 8.0%.
(b) Find a 90% confidence interval for the population average of the percentage of hospitals providing at least some charity care.
(c) Interpretation What does the confidence interval mean in the context of this problem
Hospitals: Charity Care What percentage of hospitals provide at least some charity care The following problem is based on information taken from State Health Care Data: Utilization, Spending and Characteristics (American Medical Association). Based on random sample of hospital reports from eastern states, the following information was obtained (units in percentage of hospitals providing at least some charity care).
57.1 56.2 53.0 66.1 59.0 64.7 70.1 64.7 53.5 78.2
(a) Use a calculator with mean and sample standard deviation keys to verify that
62.3% and s 8.0%.(b) Find a 90% confidence interval for the population average of the percentage of hospitals providing at least some charity care.
(c) Interpretation What does the confidence interval mean in the context of this problem
سؤال
سؤال
سؤال
سؤال
سؤال
In Problems 13-19, assume that the population of x values has an approximately normal distribution.
Critical Thinking: Boxplots and Confidence Intervals The distribution of heights of 18-year-old men in the United States is approximately normal, with mean 68 inches and standard deviation 3 inches (U.S. Census Bureau). In Minitab, we can simulate the drawing of random samples of size 20 from this population (
![In Problems 13-19, assume that the population of x values has an approximately normal distribution. Critical Thinking: Boxplots and Confidence Intervals The distribution of heights of 18-year-old men in the United States is approximately normal, with mean 68 inches and standard deviation 3 inches (U.S. Census Bureau). In Minitab, we can simulate the drawing of random samples of size 20 from this population ( Calc Random Data Normal , with 20 rows from a distribution with mean 68 and standard deviation 3). Then we can have Minitab compute a 95% confidence interval and draw a boxplot of the data ( Stat Basic Statistics I-Sample t , with boxplot selected in the graphs). The boxplots and confidence intervals for four different samples are shown in the accompanying figures. The four confidence intervals are (a) Examine the figure [parts (a) to (d)]. How do the boxplots for the four samples differ Why should you expect the boxplots to differ 95% Confidence Intervals for Mean Height of 18-Year-Old Men (Sample size 20) (b) Examine the 95% confidence intervals for the four samples shown in the printout. Do the intervals differ in length Do the intervals all contain the expected population mean of 68 inches If we draw more samples, do you expect all of the resulting 95% confidence intervals to contain = 68 Why or why not<div style=padding-top: 35px>](https://d2lvgg3v3hfg70.cloudfront.net/SM4487/11eb6ac6_4983_1c3d_acf4_bb24792111d9_SM4487_11.jpg)
![In Problems 13-19, assume that the population of x values has an approximately normal distribution. Critical Thinking: Boxplots and Confidence Intervals The distribution of heights of 18-year-old men in the United States is approximately normal, with mean 68 inches and standard deviation 3 inches (U.S. Census Bureau). In Minitab, we can simulate the drawing of random samples of size 20 from this population ( Calc Random Data Normal , with 20 rows from a distribution with mean 68 and standard deviation 3). Then we can have Minitab compute a 95% confidence interval and draw a boxplot of the data ( Stat Basic Statistics I-Sample t , with boxplot selected in the graphs). The boxplots and confidence intervals for four different samples are shown in the accompanying figures. The four confidence intervals are (a) Examine the figure [parts (a) to (d)]. How do the boxplots for the four samples differ Why should you expect the boxplots to differ 95% Confidence Intervals for Mean Height of 18-Year-Old Men (Sample size 20) (b) Examine the 95% confidence intervals for the four samples shown in the printout. Do the intervals differ in length Do the intervals all contain the expected population mean of 68 inches If we draw more samples, do you expect all of the resulting 95% confidence intervals to contain = 68 Why or why not<div style=padding-top: 35px>](https://d2lvgg3v3hfg70.cloudfront.net/SM4487/11eb6ac6_4983_1c3e_acf4_7b710a4d81e1_SM4487_11.jpg)
![In Problems 13-19, assume that the population of x values has an approximately normal distribution. Critical Thinking: Boxplots and Confidence Intervals The distribution of heights of 18-year-old men in the United States is approximately normal, with mean 68 inches and standard deviation 3 inches (U.S. Census Bureau). In Minitab, we can simulate the drawing of random samples of size 20 from this population ( Calc Random Data Normal , with 20 rows from a distribution with mean 68 and standard deviation 3). Then we can have Minitab compute a 95% confidence interval and draw a boxplot of the data ( Stat Basic Statistics I-Sample t , with boxplot selected in the graphs). The boxplots and confidence intervals for four different samples are shown in the accompanying figures. The four confidence intervals are (a) Examine the figure [parts (a) to (d)]. How do the boxplots for the four samples differ Why should you expect the boxplots to differ 95% Confidence Intervals for Mean Height of 18-Year-Old Men (Sample size 20) (b) Examine the 95% confidence intervals for the four samples shown in the printout. Do the intervals differ in length Do the intervals all contain the expected population mean of 68 inches If we draw more samples, do you expect all of the resulting 95% confidence intervals to contain = 68 Why or why not<div style=padding-top: 35px>](https://d2lvgg3v3hfg70.cloudfront.net/SM4487/11eb6ac6_4983_1c3f_acf4_b37ae34bc41a_SM4487_11.jpg) Calc
Calc
![In Problems 13-19, assume that the population of x values has an approximately normal distribution. Critical Thinking: Boxplots and Confidence Intervals The distribution of heights of 18-year-old men in the United States is approximately normal, with mean 68 inches and standard deviation 3 inches (U.S. Census Bureau). In Minitab, we can simulate the drawing of random samples of size 20 from this population ( Calc Random Data Normal , with 20 rows from a distribution with mean 68 and standard deviation 3). Then we can have Minitab compute a 95% confidence interval and draw a boxplot of the data ( Stat Basic Statistics I-Sample t , with boxplot selected in the graphs). The boxplots and confidence intervals for four different samples are shown in the accompanying figures. The four confidence intervals are (a) Examine the figure [parts (a) to (d)]. How do the boxplots for the four samples differ Why should you expect the boxplots to differ 95% Confidence Intervals for Mean Height of 18-Year-Old Men (Sample size 20) (b) Examine the 95% confidence intervals for the four samples shown in the printout. Do the intervals differ in length Do the intervals all contain the expected population mean of 68 inches If we draw more samples, do you expect all of the resulting 95% confidence intervals to contain = 68 Why or why not<div style=padding-top: 35px>](https://d2lvgg3v3hfg70.cloudfront.net/SM4487/11eb6ac6_4983_1c40_acf4_f7c077befa41_SM4487_11.jpg) Random Data
Random Data
![In Problems 13-19, assume that the population of x values has an approximately normal distribution. Critical Thinking: Boxplots and Confidence Intervals The distribution of heights of 18-year-old men in the United States is approximately normal, with mean 68 inches and standard deviation 3 inches (U.S. Census Bureau). In Minitab, we can simulate the drawing of random samples of size 20 from this population ( Calc Random Data Normal , with 20 rows from a distribution with mean 68 and standard deviation 3). Then we can have Minitab compute a 95% confidence interval and draw a boxplot of the data ( Stat Basic Statistics I-Sample t , with boxplot selected in the graphs). The boxplots and confidence intervals for four different samples are shown in the accompanying figures. The four confidence intervals are (a) Examine the figure [parts (a) to (d)]. How do the boxplots for the four samples differ Why should you expect the boxplots to differ 95% Confidence Intervals for Mean Height of 18-Year-Old Men (Sample size 20) (b) Examine the 95% confidence intervals for the four samples shown in the printout. Do the intervals differ in length Do the intervals all contain the expected population mean of 68 inches If we draw more samples, do you expect all of the resulting 95% confidence intervals to contain = 68 Why or why not<div style=padding-top: 35px>](https://d2lvgg3v3hfg70.cloudfront.net/SM4487/11eb6ac6_4983_1c41_acf4_1d16c58843be_SM4487_11.jpg) Normal , with 20 rows from a distribution with mean 68 and standard deviation 3). Then we can have Minitab compute a 95% confidence interval and draw a boxplot of the data (
Normal , with 20 rows from a distribution with mean 68 and standard deviation 3). Then we can have Minitab compute a 95% confidence interval and draw a boxplot of the data (
![In Problems 13-19, assume that the population of x values has an approximately normal distribution. Critical Thinking: Boxplots and Confidence Intervals The distribution of heights of 18-year-old men in the United States is approximately normal, with mean 68 inches and standard deviation 3 inches (U.S. Census Bureau). In Minitab, we can simulate the drawing of random samples of size 20 from this population ( Calc Random Data Normal , with 20 rows from a distribution with mean 68 and standard deviation 3). Then we can have Minitab compute a 95% confidence interval and draw a boxplot of the data ( Stat Basic Statistics I-Sample t , with boxplot selected in the graphs). The boxplots and confidence intervals for four different samples are shown in the accompanying figures. The four confidence intervals are (a) Examine the figure [parts (a) to (d)]. How do the boxplots for the four samples differ Why should you expect the boxplots to differ 95% Confidence Intervals for Mean Height of 18-Year-Old Men (Sample size 20) (b) Examine the 95% confidence intervals for the four samples shown in the printout. Do the intervals differ in length Do the intervals all contain the expected population mean of 68 inches If we draw more samples, do you expect all of the resulting 95% confidence intervals to contain = 68 Why or why not<div style=padding-top: 35px>](https://d2lvgg3v3hfg70.cloudfront.net/SM4487/11eb6ac6_4983_4352_acf4_214ebb66ed5f_SM4487_11.jpg) Stat
Stat
![In Problems 13-19, assume that the population of x values has an approximately normal distribution. Critical Thinking: Boxplots and Confidence Intervals The distribution of heights of 18-year-old men in the United States is approximately normal, with mean 68 inches and standard deviation 3 inches (U.S. Census Bureau). In Minitab, we can simulate the drawing of random samples of size 20 from this population ( Calc Random Data Normal , with 20 rows from a distribution with mean 68 and standard deviation 3). Then we can have Minitab compute a 95% confidence interval and draw a boxplot of the data ( Stat Basic Statistics I-Sample t , with boxplot selected in the graphs). The boxplots and confidence intervals for four different samples are shown in the accompanying figures. The four confidence intervals are (a) Examine the figure [parts (a) to (d)]. How do the boxplots for the four samples differ Why should you expect the boxplots to differ 95% Confidence Intervals for Mean Height of 18-Year-Old Men (Sample size 20) (b) Examine the 95% confidence intervals for the four samples shown in the printout. Do the intervals differ in length Do the intervals all contain the expected population mean of 68 inches If we draw more samples, do you expect all of the resulting 95% confidence intervals to contain = 68 Why or why not<div style=padding-top: 35px>](https://d2lvgg3v3hfg70.cloudfront.net/SM4487/11eb6ac6_4983_4353_acf4_f58a496833eb_SM4487_11.jpg) Basic Statistics
Basic Statistics
![In Problems 13-19, assume that the population of x values has an approximately normal distribution. Critical Thinking: Boxplots and Confidence Intervals The distribution of heights of 18-year-old men in the United States is approximately normal, with mean 68 inches and standard deviation 3 inches (U.S. Census Bureau). In Minitab, we can simulate the drawing of random samples of size 20 from this population ( Calc Random Data Normal , with 20 rows from a distribution with mean 68 and standard deviation 3). Then we can have Minitab compute a 95% confidence interval and draw a boxplot of the data ( Stat Basic Statistics I-Sample t , with boxplot selected in the graphs). The boxplots and confidence intervals for four different samples are shown in the accompanying figures. The four confidence intervals are (a) Examine the figure [parts (a) to (d)]. How do the boxplots for the four samples differ Why should you expect the boxplots to differ 95% Confidence Intervals for Mean Height of 18-Year-Old Men (Sample size 20) (b) Examine the 95% confidence intervals for the four samples shown in the printout. Do the intervals differ in length Do the intervals all contain the expected population mean of 68 inches If we draw more samples, do you expect all of the resulting 95% confidence intervals to contain = 68 Why or why not<div style=padding-top: 35px>](https://d2lvgg3v3hfg70.cloudfront.net/SM4487/11eb6ac6_4983_4354_acf4_6d7860889387_SM4487_11.jpg) I-Sample t , with boxplot selected in the graphs). The boxplots and confidence intervals for four different samples are shown in the accompanying figures. The four confidence intervals are
I-Sample t , with boxplot selected in the graphs). The boxplots and confidence intervals for four different samples are shown in the accompanying figures. The four confidence intervals are
![In Problems 13-19, assume that the population of x values has an approximately normal distribution. Critical Thinking: Boxplots and Confidence Intervals The distribution of heights of 18-year-old men in the United States is approximately normal, with mean 68 inches and standard deviation 3 inches (U.S. Census Bureau). In Minitab, we can simulate the drawing of random samples of size 20 from this population ( Calc Random Data Normal , with 20 rows from a distribution with mean 68 and standard deviation 3). Then we can have Minitab compute a 95% confidence interval and draw a boxplot of the data ( Stat Basic Statistics I-Sample t , with boxplot selected in the graphs). The boxplots and confidence intervals for four different samples are shown in the accompanying figures. The four confidence intervals are (a) Examine the figure [parts (a) to (d)]. How do the boxplots for the four samples differ Why should you expect the boxplots to differ 95% Confidence Intervals for Mean Height of 18-Year-Old Men (Sample size 20) (b) Examine the 95% confidence intervals for the four samples shown in the printout. Do the intervals differ in length Do the intervals all contain the expected population mean of 68 inches If we draw more samples, do you expect all of the resulting 95% confidence intervals to contain = 68 Why or why not<div style=padding-top: 35px>](https://d2lvgg3v3hfg70.cloudfront.net/SM4487/11eb6ac6_4983_4355_acf4_df9aba2ad009_SM4487_00.jpg)
(a) Examine the figure [parts (a) to (d)]. How do the boxplots for the four samples differ Why should you expect the boxplots to differ
95% Confidence Intervals for Mean Height of 18-Year-Old Men (Sample size 20)
![In Problems 13-19, assume that the population of x values has an approximately normal distribution. Critical Thinking: Boxplots and Confidence Intervals The distribution of heights of 18-year-old men in the United States is approximately normal, with mean 68 inches and standard deviation 3 inches (U.S. Census Bureau). In Minitab, we can simulate the drawing of random samples of size 20 from this population ( Calc Random Data Normal , with 20 rows from a distribution with mean 68 and standard deviation 3). Then we can have Minitab compute a 95% confidence interval and draw a boxplot of the data ( Stat Basic Statistics I-Sample t , with boxplot selected in the graphs). The boxplots and confidence intervals for four different samples are shown in the accompanying figures. The four confidence intervals are (a) Examine the figure [parts (a) to (d)]. How do the boxplots for the four samples differ Why should you expect the boxplots to differ 95% Confidence Intervals for Mean Height of 18-Year-Old Men (Sample size 20) (b) Examine the 95% confidence intervals for the four samples shown in the printout. Do the intervals differ in length Do the intervals all contain the expected population mean of 68 inches If we draw more samples, do you expect all of the resulting 95% confidence intervals to contain = 68 Why or why not<div style=padding-top: 35px>](https://d2lvgg3v3hfg70.cloudfront.net/SM4487/11eb6ac6_4983_4356_acf4_47b2ace27d71_SM4487_00.jpg)
![In Problems 13-19, assume that the population of x values has an approximately normal distribution. Critical Thinking: Boxplots and Confidence Intervals The distribution of heights of 18-year-old men in the United States is approximately normal, with mean 68 inches and standard deviation 3 inches (U.S. Census Bureau). In Minitab, we can simulate the drawing of random samples of size 20 from this population ( Calc Random Data Normal , with 20 rows from a distribution with mean 68 and standard deviation 3). Then we can have Minitab compute a 95% confidence interval and draw a boxplot of the data ( Stat Basic Statistics I-Sample t , with boxplot selected in the graphs). The boxplots and confidence intervals for four different samples are shown in the accompanying figures. The four confidence intervals are (a) Examine the figure [parts (a) to (d)]. How do the boxplots for the four samples differ Why should you expect the boxplots to differ 95% Confidence Intervals for Mean Height of 18-Year-Old Men (Sample size 20) (b) Examine the 95% confidence intervals for the four samples shown in the printout. Do the intervals differ in length Do the intervals all contain the expected population mean of 68 inches If we draw more samples, do you expect all of the resulting 95% confidence intervals to contain = 68 Why or why not<div style=padding-top: 35px>](https://d2lvgg3v3hfg70.cloudfront.net/SM4487/11eb6ac6_4983_6a67_acf4_9135bbf78538_SM4487_00.jpg)
![In Problems 13-19, assume that the population of x values has an approximately normal distribution. Critical Thinking: Boxplots and Confidence Intervals The distribution of heights of 18-year-old men in the United States is approximately normal, with mean 68 inches and standard deviation 3 inches (U.S. Census Bureau). In Minitab, we can simulate the drawing of random samples of size 20 from this population ( Calc Random Data Normal , with 20 rows from a distribution with mean 68 and standard deviation 3). Then we can have Minitab compute a 95% confidence interval and draw a boxplot of the data ( Stat Basic Statistics I-Sample t , with boxplot selected in the graphs). The boxplots and confidence intervals for four different samples are shown in the accompanying figures. The four confidence intervals are (a) Examine the figure [parts (a) to (d)]. How do the boxplots for the four samples differ Why should you expect the boxplots to differ 95% Confidence Intervals for Mean Height of 18-Year-Old Men (Sample size 20) (b) Examine the 95% confidence intervals for the four samples shown in the printout. Do the intervals differ in length Do the intervals all contain the expected population mean of 68 inches If we draw more samples, do you expect all of the resulting 95% confidence intervals to contain = 68 Why or why not<div style=padding-top: 35px>](https://d2lvgg3v3hfg70.cloudfront.net/SM4487/11eb6ac6_4983_6a68_acf4_491dc70d5e21_SM4487_00.jpg)
![In Problems 13-19, assume that the population of x values has an approximately normal distribution. Critical Thinking: Boxplots and Confidence Intervals The distribution of heights of 18-year-old men in the United States is approximately normal, with mean 68 inches and standard deviation 3 inches (U.S. Census Bureau). In Minitab, we can simulate the drawing of random samples of size 20 from this population ( Calc Random Data Normal , with 20 rows from a distribution with mean 68 and standard deviation 3). Then we can have Minitab compute a 95% confidence interval and draw a boxplot of the data ( Stat Basic Statistics I-Sample t , with boxplot selected in the graphs). The boxplots and confidence intervals for four different samples are shown in the accompanying figures. The four confidence intervals are (a) Examine the figure [parts (a) to (d)]. How do the boxplots for the four samples differ Why should you expect the boxplots to differ 95% Confidence Intervals for Mean Height of 18-Year-Old Men (Sample size 20) (b) Examine the 95% confidence intervals for the four samples shown in the printout. Do the intervals differ in length Do the intervals all contain the expected population mean of 68 inches If we draw more samples, do you expect all of the resulting 95% confidence intervals to contain = 68 Why or why not<div style=padding-top: 35px>](https://d2lvgg3v3hfg70.cloudfront.net/SM4487/11eb6ac6_4983_6a69_acf4_dfc6ba21274a_SM4487_00.jpg)
![In Problems 13-19, assume that the population of x values has an approximately normal distribution. Critical Thinking: Boxplots and Confidence Intervals The distribution of heights of 18-year-old men in the United States is approximately normal, with mean 68 inches and standard deviation 3 inches (U.S. Census Bureau). In Minitab, we can simulate the drawing of random samples of size 20 from this population ( Calc Random Data Normal , with 20 rows from a distribution with mean 68 and standard deviation 3). Then we can have Minitab compute a 95% confidence interval and draw a boxplot of the data ( Stat Basic Statistics I-Sample t , with boxplot selected in the graphs). The boxplots and confidence intervals for four different samples are shown in the accompanying figures. The four confidence intervals are (a) Examine the figure [parts (a) to (d)]. How do the boxplots for the four samples differ Why should you expect the boxplots to differ 95% Confidence Intervals for Mean Height of 18-Year-Old Men (Sample size 20) (b) Examine the 95% confidence intervals for the four samples shown in the printout. Do the intervals differ in length Do the intervals all contain the expected population mean of 68 inches If we draw more samples, do you expect all of the resulting 95% confidence intervals to contain = 68 Why or why not<div style=padding-top: 35px>](https://d2lvgg3v3hfg70.cloudfront.net/SM4487/11eb6ac6_4983_6a6a_acf4_bd3a5046c4fe_SM4487_00.jpg)
(b) Examine the 95% confidence intervals for the four samples shown in the printout. Do the intervals differ in length Do the intervals all contain the expected population mean of 68 inches If we draw more samples, do you expect all of the resulting 95% confidence intervals to contain = 68 Why or why not
Critical Thinking: Boxplots and Confidence Intervals The distribution of heights of 18-year-old men in the United States is approximately normal, with mean 68 inches and standard deviation 3 inches (U.S. Census Bureau). In Minitab, we can simulate the drawing of random samples of size 20 from this population (
Calc Random Data Normal , with 20 rows from a distribution with mean 68 and standard deviation 3). Then we can have Minitab compute a 95% confidence interval and draw a boxplot of the data ( Stat Basic Statistics I-Sample t , with boxplot selected in the graphs). The boxplots and confidence intervals for four different samples are shown in the accompanying figures. The four confidence intervals are (a) Examine the figure [parts (a) to (d)]. How do the boxplots for the four samples differ Why should you expect the boxplots to differ
95% Confidence Intervals for Mean Height of 18-Year-Old Men (Sample size 20)
(b) Examine the 95% confidence intervals for the four samples shown in the printout. Do the intervals differ in length Do the intervals all contain the expected population mean of 68 inches If we draw more samples, do you expect all of the resulting 95% confidence intervals to contain = 68 Why or why not
سؤال
Critical Thinking: Brain Teaser A requirement for using the normal distribution to approximate the
 distribution is that both np 5 and nq 5. Since we usually do not known p , we estimate p by
 and q by
 = 1 -
= 1 -
 . Then we require that n
 5 and n
 5. Show that the conditions n
 5 and n
 5 are equivalent to the condition that out of n binomial trails, both the number of successes r and the number of failures n - r must exceed 5. Hint: In the inequality n
 5, replace
 by r/n and solve for r. In the inequality n
 5, replace
 by ( n - r )/ n and solve for n - r.
distribution is that both np 5 and nq 5. Since we usually do not known p , we estimate p by and q by = 1 - . Then we require that n 5 and n 5. Show that the conditions n 5 and n 5 are equivalent to the condition that out of n binomial trails, both the number of successes r and the number of failures n - r must exceed 5. Hint: In the inequality n 5, replace by r/n and solve for r. In the inequality n 5, replace by ( n - r )/ n and solve for n - r. سؤال
سؤال
سؤال
سؤال
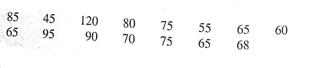
Crime Rate: Demo The following data represent crime rates per 1000 population for a random sample of 46 Denver neighborhoods (Reference: The Piton Foundation, Denver, Colorado).
(a) Use a calculator with mean and sample standard deviation keys to verify that
 64.2 and s 27.9 crimes per 1000 population.
(b) Let us say that the preceding data are representative of the population crime rates in Denver neighborhoods. Compute an 80% confidence interval for , the population mean crime rate for all Denver neighborhoods.
(c) Interpretation Suppose you are advising the police department about police patrol assignments. One neighborhood has a crime rate of 57 crimes per 1000 population. Do you think that this rate is below the average population crime rate and that fewer patrols could safely be assigned to this neighborhood Use the confidence interval to justify your answer.
(d) Interpretation Another neighborhood has a crime rate of 75 crimes per 1000 population. Does this crime rate seem to be higher than the population average Would you recommend assigning more patrols to this neighborhood Use the confidence interval to justify your answer.
(e) Repeat parts (b), (c), and (d) for a 95% confidence interval.
(f) Check Requirement In previous problems, we assumed the x distribution was normal or approximately normal. Do we need to make such an assumption in this problem Why or why not Hint: See the central limit theorem in Section 7.5.
(a) Use a calculator with mean and sample standard deviation keys to verify that
64.2 and s 27.9 crimes per 1000 population.(b) Let us say that the preceding data are representative of the population crime rates in Denver neighborhoods. Compute an 80% confidence interval for , the population mean crime rate for all Denver neighborhoods.
(c) Interpretation Suppose you are advising the police department about police patrol assignments. One neighborhood has a crime rate of 57 crimes per 1000 population. Do you think that this rate is below the average population crime rate and that fewer patrols could safely be assigned to this neighborhood Use the confidence interval to justify your answer.
(d) Interpretation Another neighborhood has a crime rate of 75 crimes per 1000 population. Does this crime rate seem to be higher than the population average Would you recommend assigning more patrols to this neighborhood Use the confidence interval to justify your answer.
(e) Repeat parts (b), (c), and (d) for a 95% confidence interval.
(f) Check Requirement In previous problems, we assumed the x distribution was normal or approximately normal. Do we need to make such an assumption in this problem Why or why not Hint: See the central limit theorem in Section 7.5.
سؤال
Archaeology: Excavations The Wind Mountain archaeological site is located in southwestern New Mexico. Wind Mountain was home to an ancient culture of prehistoric Native Americans called Anasazi. A random sample of excavations at Wind Mountain gave the following depths (in centimeters) from present-day surface grade to the location of significant archaeological artifacts (Source: Mimbres Mogollon Archaeology, by A. Woosley and A. McIntyre, University of New Mexico Press).
(a) Use a calculator with mean and sample standard deviation keys to verify that
 74.2 cm and s 18.3 cm.
(b) Compute a 95% confidence interval for the mean depth at which archaeological artifacts from the Wind Mountain excavation site can be found.
(a) Use a calculator with mean and sample standard deviation keys to verify that
74.2 cm and s 18.3 cm.(b) Compute a 95% confidence interval for the mean depth at which archaeological artifacts from the Wind Mountain excavation site can be found.
سؤال
سؤال
Basic Computation: Sample size Suppose x has a mound-shaped distribution with = 3.
(a) Find the minimal sample size required so that for a 95% confidence interval, the maximal margin of error is E = 0.4.
(b) Check Requirements Based on this sample size, can we assume that the
 distribution is approximately normal Explain.
(a) Find the minimal sample size required so that for a 95% confidence interval, the maximal margin of error is E = 0.4.
(b) Check Requirements Based on this sample size, can we assume that the
distribution is approximately normal Explain. سؤال
سؤال
Finance: P/E Ratio The price of a share of stock divided by a company's estimated future earnings per share is called the P/E ratio. High P/E, ratios usually indicate "growth" stocks, or maybe stocks that are simply overpriced. Low P/E ratios indicate "value" stocks or bargain stocks. A random sample of 51 of the largest companies in the United States gave the following P/E ratios (Reference: Forbes ).
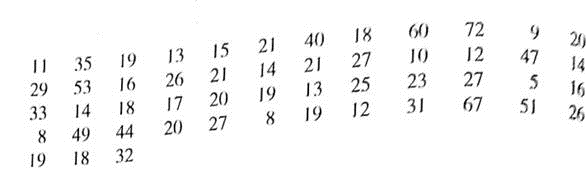
(a) Use a calculator with mean and sample standard deviation keys to verify that
 25.2 and s 15.5.
(b) Find a 90% confidence interval for the P/E population mean of all large U.S. companies.
(c) Find a 99% confidence interval for the P/E population mean of all large U.S. companies.
(d) Interpretation Bank One (now merged with J.P Morgan) had a P/E of 12, AT T Wireless had a P/E of 72, and Disney had a P/E of 24. Examine the confidence intervals in parts (b) and (c). How would you describe these stocks at the time the sample was taken
(e) Check Requirements In previous problems, we assumed the x distribution was normal or approximately normal. Do we need to make such an assumption in this problem Why or why not Hint: See the central limit theorem in Section 7.5.
(a) Use a calculator with mean and sample standard deviation keys to verify that
25.2 and s 15.5.(b) Find a 90% confidence interval for the P/E population mean of all large U.S. companies.
(c) Find a 99% confidence interval for the P/E population mean of all large U.S. companies.
(d) Interpretation Bank One (now merged with J.P Morgan) had a P/E of 12, AT T Wireless had a P/E of 72, and Disney had a P/E of 24. Examine the confidence intervals in parts (b) and (c). How would you describe these stocks at the time the sample was taken
(e) Check Requirements In previous problems, we assumed the x distribution was normal or approximately normal. Do we need to make such an assumption in this problem Why or why not Hint: See the central limit theorem in Section 7.5.
سؤال
Basic Computation: Confidence Interval for p Consider n = 100 binomial trails with r = 30 successes.
(a) Check Requirements Is it appropriate to use a normal distribution to approximate the
 distribution
(b) Find a 90% confidence interval for the population proportion of successes p.
(c) Interpretation Explain the meaning of the confidence interval you computed.
(a) Check Requirements Is it appropriate to use a normal distribution to approximate the
distribution(b) Find a 90% confidence interval for the population proportion of successes p.
(c) Interpretation Explain the meaning of the confidence interval you computed.
سؤال
سؤال
Basic Computation: Sample size Suppose x has a normal distribution with = 1.2.
(a) Find the minimal sample size required so that for a 90% confidence interval, the maximal margin of error is E = 0.5.
(b) Check Requirements Based on this sample size and the x distribution, can we assume that the
 distribution is approximately normal Explain.
(a) Find the minimal sample size required so that for a 90% confidence interval, the maximal margin of error is E = 0.5.
(b) Check Requirements Based on this sample size and the x distribution, can we assume that the
distribution is approximately normal Explain. سؤال
سؤال
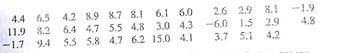
Baseball: Home Run Percentage The home run percentage is the number of home runs per 100 times at bat. A random sample of 43 professional baseball players gave the following data for home run percentages (Reference: The Baseball Encyclopedia, Macmillan).
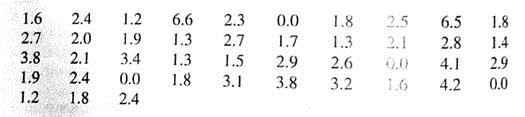
(a) Use a calculator with mean and sample standard deviation keys to verify that
 2.29 and s 1.40.
(b) Compute a 90% confidence interval for the population mean of home run percentages for all professional baseball players. Hint: If you use Table 4 of the Appendix, be sure to use the closest d.f. that is smaller.
(c) Compute a 99% confidence interval for the population mean of home run percentages for all professional baseball players.
(d) Interpretation The home run percentages for three professional players are
Tim Huelett, 2.5 Herb Hunter, 2.0 Jackie Jensen, 3.8
Examine your confidence intervals and describe how the home run percentages for these players compare to the population average.
(e) Check Requirements In previous problems, we assumed the x distribution was normal or approximately normal. Do we need to make such an assumption in this problem Why or why not Hint: See the central limit theorem in Section 7.5.
(a) Use a calculator with mean and sample standard deviation keys to verify that
2.29 and s 1.40.(b) Compute a 90% confidence interval for the population mean of home run percentages for all professional baseball players. Hint: If you use Table 4 of the Appendix, be sure to use the closest d.f. that is smaller.
(c) Compute a 99% confidence interval for the population mean of home run percentages for all professional baseball players.
(d) Interpretation The home run percentages for three professional players are
Tim Huelett, 2.5 Herb Hunter, 2.0 Jackie Jensen, 3.8
Examine your confidence intervals and describe how the home run percentages for these players compare to the population average.
(e) Check Requirements In previous problems, we assumed the x distribution was normal or approximately normal. Do we need to make such an assumption in this problem Why or why not Hint: See the central limit theorem in Section 7.5.
سؤال
Archaeology: Pottery Shards of clay vessels were put together to reconstruct rim diameters of the original ceramic vessels found at the wind Mountain archaeological site (see source in Problem 7). A random sample of ceramic vessels gave the following rim diameters (in centimeters):
15.9 13.4 22.1 12.7 13.1 19.6 11.7 13.5 17.7 18.1
(a) Use a calculator with mean and sample standard deviation keys to verify that
 15.8 cm and s 3.5 cm.
(b) Compute an 80% confidence interval for the population mean of rim diameters for such ceramic vessels found at the Wind Mountain archaeological site.
15.9 13.4 22.1 12.7 13.1 19.6 11.7 13.5 17.7 18.1
(a) Use a calculator with mean and sample standard deviation keys to verify that
15.8 cm and s 3.5 cm.(b) Compute an 80% confidence interval for the population mean of rim diameters for such ceramic vessels found at the Wind Mountain archaeological site.
سؤال
سؤال
Zoology : Hummingbirds Allen's hummingbird ( selasphorus sasin ) has been studied by zoologist Bill Alther (Reference: Hummingbirds by K. Long and w. Alther). A small group of 15 Allen's hummingbirds has been under study in Arizona. The average wait for these birds is
 = 3.15 grams. Based on previous studies, we can assume that the weights of Allen's hummingbirds have a normal distribution, with = 0.33 gram.
(a) Find an 80% confidence interval for the average weights of Allen's hummingbirds in the study region. What is the margin of error
(b) What conditions are necessary for your calculations
(c) Interpret your results in the context of this problem.
(d) Sample Size Find the sample size necessary for an 80% confidence level with a maximal margin of error E = 0.08 for the mean weights of the hummingbirds.
= 3.15 grams. Based on previous studies, we can assume that the weights of Allen's hummingbirds have a normal distribution, with = 0.33 gram.(a) Find an 80% confidence interval for the average weights of Allen's hummingbirds in the study region. What is the margin of error
(b) What conditions are necessary for your calculations
(c) Interpret your results in the context of this problem.
(d) Sample Size Find the sample size necessary for an 80% confidence level with a maximal margin of error E = 0.08 for the mean weights of the hummingbirds.
سؤال
سؤال
Expand Your Knowledge: Alternate Method for Confidence Intervals When is unknown and the sample is of size n 30, there are two methods for computing confidence intervals for .
Method 1: Use the Student's t distribution with d.f. = n - 1.
This is the method used in the text. It is widely employed in statistical studies. Also, most statistical software packages use this method.
Method 2: When n 30, use the sample standard deviation s as an estimate for , and then use the standard normal distribution.
This method is based on the fact that for large samples, s is a fairly good approximation for . Also, for large n, the critical values for the Student's t distribution approach those of the standard normal distribution.
Consider a random sample of size n = 31, with sample mean
 = 45.2 and sample standard deviation s = 5.3.
(a) Compute 90%, 95%, and 99% confidence intervals for using Method 1 with a Student's t distribution. Round endpoints to two digits after the decimal.
(b) Compute 90%, 95%, and 99% confidence intervals for using Method 2 with the standard normal distribution. Use s as an estimate for . Round endpoints to two digits after the decimal.
(c) Compare intervals for the two methods. Would you say that confidence intervals using a Student's t distribution are more conservative in the sense that they tend to be longer than intervals based on the standard normal distribution
(d) Repeat parts (a) through (c) for a sample of size n = 81. With increased sample size, do the two methods give respective confidence intervals that are more similar
Method 1: Use the Student's t distribution with d.f. = n - 1.
This is the method used in the text. It is widely employed in statistical studies. Also, most statistical software packages use this method.
Method 2: When n 30, use the sample standard deviation s as an estimate for , and then use the standard normal distribution.
This method is based on the fact that for large samples, s is a fairly good approximation for . Also, for large n, the critical values for the Student's t distribution approach those of the standard normal distribution.
Consider a random sample of size n = 31, with sample mean
= 45.2 and sample standard deviation s = 5.3.(a) Compute 90%, 95%, and 99% confidence intervals for using Method 1 with a Student's t distribution. Round endpoints to two digits after the decimal.
(b) Compute 90%, 95%, and 99% confidence intervals for using Method 2 with the standard normal distribution. Use s as an estimate for . Round endpoints to two digits after the decimal.
(c) Compare intervals for the two methods. Would you say that confidence intervals using a Student's t distribution are more conservative in the sense that they tend to be longer than intervals based on the standard normal distribution
(d) Repeat parts (a) through (c) for a sample of size n = 81. With increased sample size, do the two methods give respective confidence intervals that are more similar
سؤال
Basic Computation: Confidence Interval for p Consider n = 200 binomial trails with r = 80 successes.
(a) Check Requirements Is it appropriate to use a normal distribution to approximate the
 distribution
(b) Find a 95% confidence interval for the population proportion of successes p.
(c) Interpretation Explain the meaning of the confidence interval you computed.
(a) Check Requirements Is it appropriate to use a normal distribution to approximate the
distribution(b) Find a 95% confidence interval for the population proportion of successes p.
(c) Interpretation Explain the meaning of the confidence interval you computed.
سؤال
سؤال
Diagnostic Tests: Uric Acid overproduction of uric acid in the body can be an indication of cell breakdown This may be an advance indication of illness such as gout, leukemia, or lymphoma (Reference: Manual of Laboratory and Diagnostic Tests by F. Fischbach). Over a period of months, an adult male patient has taken eight blood tests for uric acid. The mean concentration was
 = 5.35 mg/dl. The distribution of uric acid in healthy adult males can be assumed to be normal, with = 1.85 mg/dl.
(a) Find a 95% confidence interval for the population mean concentration of uric acid in this patient's blood. What is the margin of error
(b) What conditions are necessary for your calculations
(c) Interpret your results in the context of this problem.
(d) Sample Size Find the sample size necessary for a 95% confidence level with maximal margin of error E = 1.10 for the mean concentration of uric acid in this patient's blood.
= 5.35 mg/dl. The distribution of uric acid in healthy adult males can be assumed to be normal, with = 1.85 mg/dl.(a) Find a 95% confidence interval for the population mean concentration of uric acid in this patient's blood. What is the margin of error
(b) What conditions are necessary for your calculations
(c) Interpret your results in the context of this problem.
(d) Sample Size Find the sample size necessary for a 95% confidence level with maximal margin of error E = 1.10 for the mean concentration of uric acid in this patient's blood.
سؤال
سؤال
سؤال
سؤال
سؤال
سؤال
Diagnostic Tests: Plasma Volume Total plasma volume is important in determining the required plasma component in blood replacement therapy for a person undergoing surgery. Plasma volume is influenced by the overall health and physical activity of an individual. (Reference: See Problem 16.)
Suppose that a random sample of 45 male firefighters are tested and that they have a plasma volume sample mean of
 = 37.5 ml/kg (milliliters plasma per kilogram body weight). Assume that = 7.50 ml/kg for the distribution of blood plasma.
(a) Find a 99% confidence interval for the population mean blood plasma volume in male firefighters. What is the margin of error
(b) What conditions are necessary for your calculations
(C) Interpret your results in the context of this problem.
(d) Sample Size Find the sample size necessary for a 99% confidence level with maximal margin of error E = 2.50 for the mean plasma volume in male firefighters.
Suppose that a random sample of 45 male firefighters are tested and that they have a plasma volume sample mean of
= 37.5 ml/kg (milliliters plasma per kilogram body weight). Assume that = 7.50 ml/kg for the distribution of blood plasma.(a) Find a 99% confidence interval for the population mean blood plasma volume in male firefighters. What is the margin of error
(b) What conditions are necessary for your calculations
(C) Interpret your results in the context of this problem.
(d) Sample Size Find the sample size necessary for a 99% confidence level with maximal margin of error E = 2.50 for the mean plasma volume in male firefighters.
سؤال
سؤال

فتح الحزمة
قم بالتسجيل لفتح البطاقات في هذه المجموعة!
Unlock Deck
Unlock Deck
1/88
العب
ملء الشاشة (f)
Deck 8: Estimation
1
Statistical Literacy Consider a random sample of size n from an x distribution. For such a sample, the margin of error for estimating is the magnitude of the difference between
and .
and .Given statement:
Consider a random sample of size n from an x distribution. For such a sample, the margin of error for estimating
 is the magnitude of the difference between
 and
and
 .
.
Statement is "True."
The formula for the confidence interval is
 . The definition of the margin of error is
 , which is the difference between
 and µ.
Consider a random sample of size n from an x distribution. For such a sample, the margin of error for estimating
is the magnitude of the difference between and .Statement is "True."
The formula for the confidence interval is
. The definition of the margin of error is , which is the difference between and µ. 2
FBI Report: Larceny Thirty small communities in Connecticut (population near 10,000 each) gave an average of
= 138.5 reported cases of larceny per year. Assume that is known to be 42.6 cases per year (Reference: Crime in the United States, Federal Bureau of Investigation).
(a) Find a 90% confidence interval for the population mean annual number of reported larceny cases in such communities. What is the margin of error
(b) Find a 95% confidence interval for the population mean annual number of reported larceny cases in such communities. What is the margin of error
(c) Find a 99% confidence interval for the population mean annual number of reported larceny case in such communities. What is the margin of error
(d) Compare the margins of error for parts (a) through (c). As the confidence levels increase, do the margins of error increase
(e) Critical Thinking Compare the lengths of the confidence intervals for parts (a) through (c). As the confidence levels increase, do the confidence intervals increase in length
= 138.5 reported cases of larceny per year. Assume that is known to be 42.6 cases per year (Reference: Crime in the United States, Federal Bureau of Investigation).(a) Find a 90% confidence interval for the population mean annual number of reported larceny cases in such communities. What is the margin of error
(b) Find a 95% confidence interval for the population mean annual number of reported larceny cases in such communities. What is the margin of error
(c) Find a 99% confidence interval for the population mean annual number of reported larceny case in such communities. What is the margin of error
(d) Compare the margins of error for parts (a) through (c). As the confidence levels increase, do the margins of error increase
(e) Critical Thinking Compare the lengths of the confidence intervals for parts (a) through (c). As the confidence levels increase, do the confidence intervals increase in length
Given that x be a random variable that represents the communities in Connecticut. Assume that standard deviation
 is known to be 42.6 larceny cases per year and unknown mean
 .
.
 =138.5 larceny cases per year.
(a)
The interval for
 will be 90% confidence interval for
 . In this case
 , So
, So
 =1.645 and the sample size
 . Since the sample size n = 30, x is approximately normal distribution with standard deviation
 =42.6 larceny cases per year. So, the
 distribution also will be normal. Since the sample size is equals to 30.
The standard deviation


 E= 12.79 larceny cases per year.
Now, calculate confidence interval for
 when
when
 is known.


 We conclude with 90% confidence that the interval from 125.71 151.29 is one that
contains the population mean
 for the population mean annual number of reported
larceny cases in such communities.
(b)
The interval for
 will be 90% confidence interval for
 .
.
In this case,
 So
So
 =1.96 and the sample size n=30.
Since the sample size n = 30, x is approximately normal distribution with standard deviation
 =42.6 larceny cases per year. So, the
 distribution also will be normal Since the sample size is equals to 30.
The standard deviation


 E= 15.24 larceny cases per year.
Now, calculate confidence interval for
 when
when
 is known.


 We conclude with 95% confidence that the interval from 123.26 153.74 is one that
contains the population mean
 for the population mean annual number of reported
larceny cases in such communities.
(c)
The interval for
 will be 99% confidence interval for
 .
.
In this case c= 0.99, So
 =2.58 and the sample size n=30.
Since the sample size n = 30, x is approximately normal distribution with standard deviation
 =42.6 larceny cases per year. So, the
 distribution also will be normal Since the sample size is equals to 30.
The standard deviation


 E= 20.07 larceny cases per year.
Now, calculate confidence interval for
 when
when
 is known.


 We conclude with 99% confidence that the interval from 118.43 158.57 is one that contains the population mean
 for the population mean annual number of reported larceny cases in such communities.
Margin of error is E = 20.07 larceny cases per year.
(d)
Yes, The margin of error is increases as confidence level increases.
(e)
Yes,
From part (a) the length of the confidence interval is
 From part (b) the length of the confidence interval is
 From part (c) the length of the confidence interval is
 So, the length of the confidence interval increases when the confidence interval
increases.
is known to be 42.6 larceny cases per year and unknown mean . =138.5 larceny cases per year.(a)
The interval for
will be 90% confidence interval for . In this case , So =1.645 and the sample size . Since the sample size n = 30, x is approximately normal distribution with standard deviation =42.6 larceny cases per year. So, the distribution also will be normal. Since the sample size is equals to 30. The standard deviation
E= 12.79 larceny cases per year.Now, calculate confidence interval for
when is known. We conclude with 90% confidence that the interval from 125.71 151.29 is one thatcontains the population mean
for the population mean annual number of reportedlarceny cases in such communities.
(b)
The interval for
will be 90% confidence interval for . In this case,
So =1.96 and the sample size n=30.Since the sample size n = 30, x is approximately normal distribution with standard deviation
=42.6 larceny cases per year. So, the distribution also will be normal Since the sample size is equals to 30. The standard deviation
E= 15.24 larceny cases per year.Now, calculate confidence interval for
when is known. We conclude with 95% confidence that the interval from 123.26 153.74 is one thatcontains the population mean
for the population mean annual number of reportedlarceny cases in such communities.
(c)
The interval for
will be 99% confidence interval for .In this case c= 0.99, So
=2.58 and the sample size n=30.Since the sample size n = 30, x is approximately normal distribution with standard deviation
=42.6 larceny cases per year. So, the distribution also will be normal Since the sample size is equals to 30. The standard deviation
E= 20.07 larceny cases per year.Now, calculate confidence interval for
when is known. We conclude with 99% confidence that the interval from 118.43 158.57 is one that contains the population mean for the population mean annual number of reported larceny cases in such communities.Margin of error is E = 20.07 larceny cases per year.
(d)
Yes, The margin of error is increases as confidence level increases.
(e)
Yes,
From part (a) the length of the confidence interval is
From part (b) the length of the confidence interval is From part (c) the length of the confidence interval is So, the length of the confidence interval increases when the confidence intervalincreases.
3
Critical Thinking Lorraine was in a hurry when she computed a confidence interval for . Because was not known, she used a Student's t distribution. However, she accidentally used degrees of freedom n instead of n - 1. Was her confidence interval longer or shorter than one found using the correct degrees of freedom n - 1 Explain.
The rule is that as the sample size increases, the critical value for t gets smaller, all other values being equal. When L used n degrees of freedom instead of ( n -1) degrees of freedom, she mistakenly used a smaller critical t value
 than she should have. As a result, her confidence interval was narrower (shorter) than it should have been.
than she should have. As a result, her confidence interval was narrower (shorter) than it should have been. 4
Statistical Literacy In order to use a normal distribution to compute confidence intervals for p, what conditions on np and nq need to be satisfied
فتح الحزمة
افتح القفل للوصول البطاقات البالغ عددها 88 في هذه المجموعة.
فتح الحزمة
k this deck
5
Basic Computation: Sample Size What is the minimal sample size needed for a 99% confidence interval to have a maximal margin of error of 0.06
(a) if a preliminary estimate for p is 0.8
(b) if there is no preliminary estimate for p
(a) if a preliminary estimate for p is 0.8
(b) if there is no preliminary estimate for p
فتح الحزمة
افتح القفل للوصول البطاقات البالغ عددها 88 في هذه المجموعة.
فتح الحزمة
k this deck
6
Medical: Blood Type A random sample of medical files is used to estimate the proportion p of all people who have blood type B.
(a) If you have no preliminary estimate for p, how many medical files should you include in a random sample in order to be 85% sure that the point estimate
will be within a distance of 0.05 from p
(b) Answer part (a) if you use the preliminary estimate that about 8 out of 90 people have blood type B (Reference: Manual of Laboratory and Diagnostic Tests by F. Fischbach).
(a) If you have no preliminary estimate for p, how many medical files should you include in a random sample in order to be 85% sure that the point estimate
will be within a distance of 0.05 from p (b) Answer part (a) if you use the preliminary estimate that about 8 out of 90 people have blood type B (Reference: Manual of Laboratory and Diagnostic Tests by F. Fischbach).
فتح الحزمة
افتح القفل للوصول البطاقات البالغ عددها 88 في هذه المجموعة.
فتح الحزمة
k this deck
7
Statistical Literacy Every random sample of the same size from a given population will produce exactly the same confidence interval for .
فتح الحزمة
افتح القفل للوصول البطاقات البالغ عددها 88 في هذه المجموعة.
فتح الحزمة
k this deck
8
Confidence Intervals: Values of A random sample of size 36 is drawn from an x distribution. The sample mean is 100.
(a) Suppose the x distribution has = 30. Compute a 90% confidence interval for . What is the value of the margin of error
(b) Suppose the x distribution has = 20. Compute a 90% confidence interval for . What is the value of the margin of error
(c) Suppose the x distribution has = 10. Compute a 90% confidence interval for . What is the value of the margin of error
(d) Compare the margins of error for parts (a) through (c). As the standard deviation decreases, does the margin of error decrease
(e) Critical Thinking Compare the lengths of the confidence intervals for parts (a) through (c). As the standard deviation decreases, does the length of a 90% confidence interval decrease
فتح الحزمة
افتح القفل للوصول البطاقات البالغ عددها 88 في هذه المجموعة.
فتح الحزمة
k this deck
9
Basic Computation: Confidence Interval Suppose x has a mound-shaped distribution. A random sample of size 16 has sample mean 10 and sample standard deviation 2.
(a) Check Requirements Is it appropriate to use a Student's t distribution to compute a confidence interval for the Population mean Explain.
(b) Find a 90% confidence interval for .
(c) Interpretation Explain the meaning of the confidence interval you computed.
(a) Check Requirements Is it appropriate to use a Student's t distribution to compute a confidence interval for the Population mean Explain.
(b) Find a 90% confidence interval for .
(c) Interpretation Explain the meaning of the confidence interval you computed.
فتح الحزمة
افتح القفل للوصول البطاقات البالغ عددها 88 في هذه المجموعة.
فتح الحزمة
k this deck
10
Critical Thinking If you have a 99% confidence interval for based on a simple random sample,
(a) is it correct to say that in the probability that is in the specified interval is 99% Explain.
(b) is it correct to say that in the long run, if you computed many, many confidenceintervals using the prescribed method, about 99% of such intervals would contain Explain.
(a) is it correct to say that in the probability that is in the specified interval is 99% Explain.
(b) is it correct to say that in the long run, if you computed many, many confidenceintervals using the prescribed method, about 99% of such intervals would contain Explain.
فتح الحزمة
افتح القفل للوصول البطاقات البالغ عددها 88 في هذه المجموعة.
فتح الحزمة
k this deck
11
Archaeology: Pottery Three-circle, red-on-white is one distinctive pattern painted on ceramic vessels of the Anasazi period found at the Wind Mountain archaeological site (see source for Problem 7). At one excavation, a sample of 167 potsherds indicated that 68 were of the three-circle, red-on-white pattern.
(a) Find a point estimate
for the proportion of all ceramic potsherds at this site that are of the three-circle, red-on-white pattern.
(b) Compute a 95% confidence interval for the population proportion p of all ceramic potsherds with this distinctive pattern found at this site.
(a) Find a point estimate
for the proportion of all ceramic potsherds at this site that are of the three-circle, red-on-white pattern.(b) Compute a 95% confidence interval for the population proportion p of all ceramic potsherds with this distinctive pattern found at this site.
فتح الحزمة
افتح القفل للوصول البطاقات البالغ عددها 88 في هذه المجموعة.
فتح الحزمة
k this deck
12
Business: Phone Contact How hard is it to reach a businessperson by phone Let p be the proportion of calls to businesspeople for which the caller reaches the person being called on the first try.
(a) If you have no preliminary estimate for p. how many business phone calls should you include in a random sample to be 80% sure that the point estimate
will be within a distance of 0.03 from p
(b) The Book of Odds by Shook and Shook (Signet) reports that businesspeople can be reached by a single phone call approximately 17% of the time. Using this (national) estimate for p, answer part (a).
(a) If you have no preliminary estimate for p. how many business phone calls should you include in a random sample to be 80% sure that the point estimate
will be within a distance of 0.03 from p (b) The Book of Odds by Shook and Shook (Signet) reports that businesspeople can be reached by a single phone call approximately 17% of the time. Using this (national) estimate for p, answer part (a).
فتح الحزمة
افتح القفل للوصول البطاقات البالغ عددها 88 في هذه المجموعة.
فتح الحزمة
k this deck
13
Statistical Literacy A larger sample size produces a longer confidence interval for .
فتح الحزمة
افتح القفل للوصول البطاقات البالغ عددها 88 في هذه المجموعة.
فتح الحزمة
k this deck
14
Confidence Intervals: Sample Size A random sample is drawn from a population with = 12. The sample mean is 30.
(a) Compute a 95% confidence interval for based on a sample of size 49. What is the value of the margin of error
(b) Compute a 95% confidence interval for based on a sample of size 100. What is the value of the margin of error
(c) Compute a 95% confidence interval for based on a sample of size 225. What is the value of the margin of error
(d) Compare the margins of error for parts (a) through (c). As the sample size increases, does the margin of error decrease
(e) Critical Thinking Compare the lengths of the confidence intervals for parts (a) through (c). As the sample size increases, does the length of a 90% confidence interval decrease
فتح الحزمة
افتح القفل للوصول البطاقات البالغ عددها 88 في هذه المجموعة.
فتح الحزمة
k this deck
15
Basic Computation: Confidence Interval A random sample of size 81 has sample mean 20 and sample standard deviation 3.
(a) Check Requirements Is it appropriate to use a student's t distribution to compute a confidence interval for the population mean Explain.
(b) Find a 95% confidence interval for .
(c) Interpretation Explain the meaning of the confidence interval you computed.
(a) Check Requirements Is it appropriate to use a student's t distribution to compute a confidence interval for the population mean Explain.
(b) Find a 95% confidence interval for .
(c) Interpretation Explain the meaning of the confidence interval you computed.
فتح الحزمة
افتح القفل للوصول البطاقات البالغ عددها 88 في هذه المجموعة.
فتح الحزمة
k this deck
16
Critical Thinking Results of a poll of a random sample of 3003 American adults showed that 20% did not know that caffeine contributes to dehydration. The poll was conducted for the Nutrition Information Center and had a margin of error of ±1.4%.
(a) Does the margin of error take into account any problems with the wording of the survey question, interviewer errors, bias from sequence of questions, and so forth
(b) What does the margin of error reflect
(a) Does the margin of error take into account any problems with the wording of the survey question, interviewer errors, bias from sequence of questions, and so forth
(b) What does the margin of error reflect
فتح الحزمة
افتح القفل للوصول البطاقات البالغ عددها 88 في هذه المجموعة.
فتح الحزمة
k this deck
17
Myers-Briggs: Actors Isabel Myers was a pioneer in the study of personality types. The following information is taken from A Guide to the Development and Use of the Myers-Briggs Type Indicator by Myers and McCauley (Consulting Psychologists Press). In a random sample of 62 professional actors, it was found that 39 were extroverts.
(a) Let p represent the proportion of all actors who are extroverts. Find a point estimate for p.
(b) Find a 95% confidence interval for p. Give a brief interpretation of the meaning of the confidence interval you have found.
(c) Check Requirements Do you think the conditions np 5 and nq 5 are satisfied in this problem Explain why this would be an important consideration.
فتح الحزمة
افتح القفل للوصول البطاقات البالغ عددها 88 في هذه المجموعة.
فتح الحزمة
k this deck
18
Campus Life: Coeds. What percentage of your campus student body is female Let p be the proportion of women students on your campus.
(a) If no preliminary study is made to estimate p.how large a sample is needed to be 99% sure that a point estimate
will be within a distance of 0.05 from p
(b) The Statistical Abstract of the United States. 112th Edition, indicates that approximately 54% of college students are female. Answer part (a) using this estimate for p.
(a) If no preliminary study is made to estimate p.how large a sample is needed to be 99% sure that a point estimate
will be within a distance of 0.05 from p (b) The Statistical Abstract of the United States. 112th Edition, indicates that approximately 54% of college students are female. Answer part (a) using this estimate for p.
فتح الحزمة
افتح القفل للوصول البطاقات البالغ عددها 88 في هذه المجموعة.
فتح الحزمة
k this deck
19
Statistical Literacy If the original x distribution has a relatively small standard deviation, the confidence interval for will be relatively short.
فتح الحزمة
افتح القفل للوصول البطاقات البالغ عددها 88 في هذه المجموعة.
فتح الحزمة
k this deck
20
Ecology: Sand Dunes At wind speeds above 1000 centimeters per second (cm/sec), significant sand-moving events begin to occur. Wind speeds below 1000 cm/sec deposit sand, and wind speeds above 1000 cm/sec move sand to new locations. The cyclic nature of wind and moving sand determines the shape and location of large dunes (Reference: Hydraulic, Geologic, and Biologic Research at Great Sand Dunes National Monument and Vicinity, Colorado, Proceedings of the National Park Service Research Symposium). At a test site, the prevailing direction of the wind did not change noticeably. However, the velocity did change. Sixty wind speed readings gave an average velocity of
= 1075cm/sec Based on long-term experience, can be assumed to be 265 cm/sec.
(a) Find a 95% confident interval for the population mean wind speed at this site.
(b) Interpretation Does the confidence interval indicate that the population mean wind speed is such that the sand is always moving at this site Explain.
= 1075cm/sec Based on long-term experience, can be assumed to be 265 cm/sec.(a) Find a 95% confident interval for the population mean wind speed at this site.
(b) Interpretation Does the confidence interval indicate that the population mean wind speed is such that the sand is always moving at this site Explain.
فتح الحزمة
افتح القفل للوصول البطاقات البالغ عددها 88 في هذه المجموعة.
فتح الحزمة
k this deck
21
In Problems 13-19, assume that the population of x values has an approximately normal distribution.
Archaeology: Tree Rings At Burnt Mesa Pueblo, the method of tree-ring dating gave the following years A. D, for an archaeological excavation site (Bandelier Archaeological Excavation Project: Summer 1990 Excavations at Burnt Mesa Pueblo, edited by Kohler, Washington State University):
1189.1271 1267 1272 1268 1316 1275 1317 1275
(a) Use a calculator with mean and standard deviation keys to verify that the sample mean year is
1272, with sample standard deviation s 37 years.
(b) Find a 90% confidence interval for the mean of all tree-ring dates from this archaeological site.
(c) Interpretation What does the confidence interval mean in the context of this problem
Archaeology: Tree Rings At Burnt Mesa Pueblo, the method of tree-ring dating gave the following years A. D, for an archaeological excavation site (Bandelier Archaeological Excavation Project: Summer 1990 Excavations at Burnt Mesa Pueblo, edited by Kohler, Washington State University):
1189.1271 1267 1272 1268 1316 1275 1317 1275
(a) Use a calculator with mean and standard deviation keys to verify that the sample mean year is
1272, with sample standard deviation s 37 years.(b) Find a 90% confidence interval for the mean of all tree-ring dates from this archaeological site.
(c) Interpretation What does the confidence interval mean in the context of this problem
فتح الحزمة
افتح القفل للوصول البطاقات البالغ عددها 88 في هذه المجموعة.
فتح الحزمة
k this deck
22
Auto Insurance: Claims Anystate Auto Insurance Company took a random sample of 370 insurance claims paid out during a 1-year period. The average claim paid was $1570. Assume = $250. Find 0.90 and 0.99 confidence intervals for the mean claim payment.
فتح الحزمة
افتح القفل للوصول البطاقات البالغ عددها 88 في هذه المجموعة.
فتح الحزمة
k this deck
23
Archaeology: Pottery Consider the three-circle, red-on-white pattern discussed in Problem 11. How many ceramic potsherds must be found and identified if we are to be 95% confident that the sample proportion
of such potsherds is within 6% of the population proportion of three-circle, red-on-white patterns found at this excavation site Hint: Use the results of Problem 11 as a preliminary estimate.
of such potsherds is within 6% of the population proportion of three-circle, red-on-white patterns found at this excavation site Hint: Use the results of Problem 11 as a preliminary estimate. فتح الحزمة
افتح القفل للوصول البطاقات البالغ عددها 88 في هذه المجموعة.
فتح الحزمة
k this deck
24
Small Business: Bankruptcy The National Council of Small Businesses is interested in the proportion of small businesses that declared Chapter 11 bankruptcy last year. Since there are so many small businesses, the National Council intends to estimate the proportion from a random sample. Let p be the proportion of small businesses that declared Chapter 11 bankruptcy last year.
(a) If no preliminary sample taken to estimate p , how large a sample is necessary to be 95% sure that a point estimate
will be within a distance of 0.10 from p
(b) In a preliminary random sample of 38 small businesses, it was found that six had declared Chapter 11 bankruptcy. How many more small businesses should be included in the sample to be 95% sure that a point estimate
will be within a distance of 0.10 from p
(a) If no preliminary sample taken to estimate p , how large a sample is necessary to be 95% sure that a point estimate
will be within a distance of 0.10 from p (b) In a preliminary random sample of 38 small businesses, it was found that six had declared Chapter 11 bankruptcy. How many more small businesses should be included in the sample to be 95% sure that a point estimate
will be within a distance of 0.10 from p فتح الحزمة
افتح القفل للوصول البطاقات البالغ عددها 88 في هذه المجموعة.
فتح الحزمة
k this deck
25
Statistical Literacy If the sample mean x of random sample from an x distribution is relatively small, then the confidence interval for will be relatively short.
فتح الحزمة
افتح القفل للوصول البطاقات البالغ عددها 88 في هذه المجموعة.
فتح الحزمة
k this deck
26
Profits: Banks Jobs and productivity! How do banks rate One way to answer this question is to examine annual profits per employee. Forbes Top Companies, edited by J. T. Davis (John Wiley sons), gave the following data about annual profits per employee (in units of one thousand dollars per employee) for representative companies in financial services. Companies such as Wells Fargo, First Bank System, and Key Banks were included. Assume = 10.2 thousand dollars.
(a) Use a calculator or appropriate computer software to verify that, for the preceding data,
36.0.
(b) Let us say that the preceding data are representative of the entire sector of (successful) financial services corporations. Find a 75% confidence interval for , the average annual profit per employee for all successful bans.
(c) Interpretation Let us say that you are the manager of a local bank with a large number of employees. Suppose the annual profits per employee are less than 30 thousand dollars per employee. Do you think this might be somewhat low compared with other successful financial institutions Explain by referring to the confidence interval you computed in part (b).
(d) Interpretation Suppose the annual profits are more than 40 thousand dollars per employee. As manager of the bank, would you feel somewhat better Explain by referring to the confidence interval you computed in part (b).
(e) Repeat parts (b), (c), and (d) for a 90% confidence level.
(a) Use a calculator or appropriate computer software to verify that, for the preceding data,
36.0.(b) Let us say that the preceding data are representative of the entire sector of (successful) financial services corporations. Find a 75% confidence interval for , the average annual profit per employee for all successful bans.
(c) Interpretation Let us say that you are the manager of a local bank with a large number of employees. Suppose the annual profits per employee are less than 30 thousand dollars per employee. Do you think this might be somewhat low compared with other successful financial institutions Explain by referring to the confidence interval you computed in part (b).
(d) Interpretation Suppose the annual profits are more than 40 thousand dollars per employee. As manager of the bank, would you feel somewhat better Explain by referring to the confidence interval you computed in part (b).
(e) Repeat parts (b), (c), and (d) for a 90% confidence level.
فتح الحزمة
افتح القفل للوصول البطاقات البالغ عددها 88 في هذه المجموعة.
فتح الحزمة
k this deck
27
In Problems 13-19, assume that the population of x values has an approximately normal distribution.
Camping: Cost of a Sleeping Bag How much does a sleeping bag cost Let's say you want a sleeping bag that should keep you warm in temperatures from 20°F to 45°F. A random sample of prices ($) for sleeping bags in this temperature range was taken from Backpacker Magazine: Gear Guide (Vol. 25, Issue 157, No. 2). Brand names include American Camper, Cabela's, Camp 7, Caribou, Cascade, and Coleman.
(a) Use a calculator with mean and sample standard deviation keys to verity that
$83.75 and s = $28.97.
(b) Using the given data as representative of the population of prices of all summer sleeping bags, find a 90% confidence interval for the mean price of all summer sleeping bags.
(c) Interpretation What does the confidence interval mean in the context of this problem
Camping: Cost of a Sleeping Bag How much does a sleeping bag cost Let's say you want a sleeping bag that should keep you warm in temperatures from 20°F to 45°F. A random sample of prices ($) for sleeping bags in this temperature range was taken from Backpacker Magazine: Gear Guide (Vol. 25, Issue 157, No. 2). Brand names include American Camper, Cabela's, Camp 7, Caribou, Cascade, and Coleman.
(a) Use a calculator with mean and sample standard deviation keys to verity that
$83.75 and s = $28.97.(b) Using the given data as representative of the population of prices of all summer sleeping bags, find a 90% confidence interval for the mean price of all summer sleeping bags.
(c) Interpretation What does the confidence interval mean in the context of this problem
فتح الحزمة
افتح القفل للوصول البطاقات البالغ عددها 88 في هذه المجموعة.
فتح الحزمة
k this deck
28
Critical Thinking You want to conduct a survey to determine the proportion of people who favor a proposed tax policy. How does increasing the sample size affect the size of the margin of error
فتح الحزمة
افتح القفل للوصول البطاقات البالغ عددها 88 في هذه المجموعة.
فتح الحزمة
k this deck
29
Myers-Briggs: Judges In a random sample of 519 judges, it was found that 285 were introverts. (See reference in problem 11.)
(a) Let p represent the proportion of all judges who are introverts. Find a point estimate for p.
(b) Find a 99% confidence interval for p. Give a brief interpretation of the meaning of the confidence interval you have found.
(c) Check Requirements Do you think the conditions np 5 and nq 5 are satisfied in this problem Explain why this would be an important consideration.
فتح الحزمة
افتح القفل للوصول البطاقات البالغ عددها 88 في هذه المجموعة.
فتح الحزمة
k this deck
30
Brain Teaser: Algebra Why do we use 1/4 in place of p (1 - p) in formula (22) for sample size when the probability of success p is unknown
(a) Show that p (1 - p) = 1/4 - (p - 1/2) 2.
(b) Why is p(1- p) never greater than 1/4
(a) Show that p (1 - p) = 1/4 - (p - 1/2) 2.
(b) Why is p(1- p) never greater than 1/4
فتح الحزمة
افتح القفل للوصول البطاقات البالغ عددها 88 في هذه المجموعة.
فتح الحزمة
k this deck
31
Statistical Literacy For the same random sample, when the confidence level c is reduced, the confidence interval for becomes shorter
فتح الحزمة
افتح القفل للوصول البطاقات البالغ عددها 88 في هذه المجموعة.
فتح الحزمة
k this deck
32
Profits: Retail Jobs and productivity! How do retail stores rate One way to answer this question is to examine annual profits per employee. The following data give annual profits per employee (in units of one thousand dollars per employee) for companies in retail sales. (See reference in Problem 23.) Companies such as Gap, Nordstrom, Dillards, JCPenney, Sears, Walrmart, Office Depot, and Toys "" Us are included. Assume 3.8 thousand dollars.
(a) Use a calculator or appropriate computer software to verify that, for the preceding data,
5.1.
(b) Let us say that the preceding data are representative of the entire sector of retail sales companies. Find an 80% confidence interval for , the average annual profit per employee for retail sales.
(c) Interpretation Let us say that you are the manager of a retail store with a large number of employees. Suppose the annual profits per employee are less than 3 thousand dollars per employee. Do you think this might be low compared with other retail stores Explain by referring to the confidence interval you computed in part (b).
(d) Interpretation Suppose the annual profits are more than 6.5 thousand dollars per employee. As store manager, would you feel somewhat better Explain by referring to the confidence interval you computed in part (b).
(e) Repeat parts (b), (c), and (d) for a 95% confidence interval.
(a) Use a calculator or appropriate computer software to verify that, for the preceding data,
5.1.(b) Let us say that the preceding data are representative of the entire sector of retail sales companies. Find an 80% confidence interval for , the average annual profit per employee for retail sales.
(c) Interpretation Let us say that you are the manager of a retail store with a large number of employees. Suppose the annual profits per employee are less than 3 thousand dollars per employee. Do you think this might be low compared with other retail stores Explain by referring to the confidence interval you computed in part (b).
(d) Interpretation Suppose the annual profits are more than 6.5 thousand dollars per employee. As store manager, would you feel somewhat better Explain by referring to the confidence interval you computed in part (b).
(e) Repeat parts (b), (c), and (d) for a 95% confidence interval.
فتح الحزمة
افتح القفل للوصول البطاقات البالغ عددها 88 في هذه المجموعة.
فتح الحزمة
k this deck
33
In Problems 13-19, assume that the population of x values has an approximately normal distribution.
Franchise: Candy Store Do you want to own your own candy store With some interest in running your own business and a decent credit rating, you can probably get a bank loan on startup costs for franchises such as Candy Express, The Fudge Company, Karmel Corn, and Rocky Mountain Chocolate Factory. Startup costs (in thousands of dollars) for a random sample of candy stores are given below (Source: Entrepreneur Magazine , Vol. 23, No. 10).
95 173 129 95 75 94 116 100 85
(a) Use a calculator with mean and sample stand deviation keys to verify that
106.9 thousand dollars and s 29.4 thousand dollars.
(b) Find a 90% confidence interval for the population average startup costs for candy store franchises.
(c) Interpretation What does the confidence interval mean in the context of this problem
Franchise: Candy Store Do you want to own your own candy store With some interest in running your own business and a decent credit rating, you can probably get a bank loan on startup costs for franchises such as Candy Express, The Fudge Company, Karmel Corn, and Rocky Mountain Chocolate Factory. Startup costs (in thousands of dollars) for a random sample of candy stores are given below (Source: Entrepreneur Magazine , Vol. 23, No. 10).
95 173 129 95 75 94 116 100 85
(a) Use a calculator with mean and sample stand deviation keys to verify that
106.9 thousand dollars and s 29.4 thousand dollars.(b) Find a 90% confidence interval for the population average startup costs for candy store franchises.
(c) Interpretation What does the confidence interval mean in the context of this problem
فتح الحزمة
افتح القفل للوصول البطاقات البالغ عددها 88 في هذه المجموعة.
فتح الحزمة
k this deck
34
Psychology: Closure Three experiments investigating the relationship between need for cognitive closure and persuasion were reported in "Motivated Resistance and Openness to Persuasion in the Presence or Absence of Prior Information" by A. W. Kruglanski (Journal of Personality and Social Psychology, Vol. 65, No. 5, pp. 861-874). Part of the study involved administering a "need for closure scale" to a group of students enrolled in an introductory psychology course. The "need for closure scale" has scores ranging from 101 to 201. For the 73 students in the highest quartile of the distribution, the mean score was
= 178.70. Assume a population standard deviation of = 7.81. These students were all classified as high on their need for closure. Assume that the 73 students represent a random sample of all students who are classified as high on their need for closure. Find a 95% confidence interval for the population mean score on the "need for closure scale" for all students with a high need for closure.
= 178.70. Assume a population standard deviation of = 7.81. These students were all classified as high on their need for closure. Assume that the 73 students represent a random sample of all students who are classified as high on their need for closure. Find a 95% confidence interval for the population mean score on the "need for closure scale" for all students with a high need for closure. فتح الحزمة
افتح القفل للوصول البطاقات البالغ عددها 88 في هذه المجموعة.
فتح الحزمة
k this deck
35
Expand Your Knowledge: Two Confidence Intervals What happens if we want several confidence intervals to hold at the same time (concurrently) Do we still have the same level of confidence we had for each individual interval
(a) Suppose we have two independent random variables x 1 and x 2 with respective population means 1 and 2. Let us say that we use sample data to construct two 80% confidence intervals.
Now, what is the probability that both intervals hold at the same time
Use methods of Section 5.2 to show that
P ( A 1 1 B 1 and A 2 2 B 2 ) = 0.64
Hint: You are combining independent events. If the confidence is 64% that both intervals hold concurrently, explain why the risk that at least one interval does not hold (i.e., fails) must be 36%.
(b) Suppose we want both intervals to hold with 90% confidence (i.e., only 10% risk level). How much confidence c should each interval have to achieve this combinined level of confidence (Assume that each interval has the same confidence level c.)
Hint: P ( A 1 1 B 1 and A 2 2 B 2 ) = 0.90
P ( A 1 1 B 1 ) × P ( A 2 2 B 2 ) = 0.90
Now solve foe c.
(c) If we want both intervals to hold at the 90% level of confidence, then the individual intervals must hold at a higher level of confidence. Write a brief but detailed explanation of how this could be of importance in a large, complex engineering design such as a rocket booster or a spacecraft.
فتح الحزمة
افتح القفل للوصول البطاقات البالغ عددها 88 في هذه المجموعة.
فتح الحزمة
k this deck
36
Expand Your Knowledge: Plus Four Confidence Interval for a Single Proportion One of the technical difficulties that arises in the computation of confidence intervals for a single proportion is that the exact formula for the maximal margin of error requires knowledge of the population proportionof success p. Since p is usually not known, we use the sample estimate
= r/n in place of p. As discussed in the article "How Much Confidence Should You Have in Binomial Confidence Intervals" appearing in issue no. 45 of the magazine STATS (a publication of the American Statistical Association), use of
as an estimate for p means that the actual confidence level for the intervals may in fact be smaller than the specified level c. This problem arises even when n is large, especially if p is not near 1/2.
A simple adjustment to the formula for the confidence intervals is the plus four estimate, first suggested by Edwin Bidwell Wilson in 1927. It is also called the Agresti-Coull confidence interval. This adjustment works best for 95% confidence intervals.
The plus four adjustment has us add two successes and two failures to the sample data. This means that r , the number of successes, is increased by 2, and n, the sample size is increased by 4. We use the symbol
, read " P tilde, " for the resulting sample estimate of p. So,
= (r + 2)/( n + 4)
PROCEDURE
HOW TO COMPUTE A PLUS FOUR CONFIDENCE INTERVAL FOR p
Requirements
Consider a binomial experiment with n trials, where p represents the population probability of success and q = 1 - p represents the population probability of failure. Let r be a random variable that represents the number of successes out of the n binomial trials.
The plus four point estimates for p and q are
The number of trials n should be at least 10.
Approximate confidence interval for p
- E p
+ E
Where
c = confidence level (0 c 1)
z c = critical value for confidence level c based on the standard normal distribution
(a) Consider a random sample of 50 trials with 20 successes. Compute a 95% confidence interval for p using the plus four method.
(b) Compute a traditional 95% confidence interval for p using a random sample of 50 trials with 20 successes.
(c) Compare the lengths of the intervals obtained using the two methods. Is the point estimate closer to 1/2 when using the plus four method Is the margin of error smaller when using the plus four method
Consider the following random sample of size 20
12 15 21 2 6 3 15 51 22 18
37 12 25 19 33 15 14 17 12 27
A stem-and-leaf display shows that the data are skewed with one outlier.
We can use Minitab to model the bootstrap method for constructing confidence intervals for . (The Professional edition of Minitab is required because of spreadsheet size and other limitations of the Student edition.) This demonstration uses only 1000 samples. Bootstrap uses many thousands.
Step 1 : Create 1000 new samples, each of size 20, by sampling with replacement from the original data. To do this in Minitab, we enter the original 20 data values in column Cl. Then, in column C2, we place equal probabilities of 0.05 beside each of the original data values. Use the menu choices Calc
Random Data
Discrete. In the dialogue box, fill in 1000 as the number of rows, store the data in columns C11-C30, and use column C1 for values and column C2 for probabilities.
Step 2 : Find the sample mean of each of the 1000 samples. To do this in Minitab, use the menu choices Calc
Row Statistics. In the dialogue box, select mean. Use columns C11-C30 as the input variables and store the results in column C31.
Step3 : Order the 1000 means from smallest to largest. In Minitab, use the menu choices Manip Sort. In the dialogue box, indicate C31 as the column to be sorted. Store the results in column C32. Sort by values in column C3I.
Step 4 : Create a 95% confidence interval by finding the boundaries for the middle 95% of the data. In other words, you need to find the values of the 2.5 percentile ( p 2.5 ) and the 97.5 percentile ( P 97. 5 ). Since there are 1000 data values, the 2.5 percentile is the data value in position 25, while the 97.5 percentile is the data value in position 975. The confidence interval is ( p 2.5 ) P 97. 5.
Demonstration Results
Figure 8-9 shows a histogram of the 1000
values from one bootstrap simulation. Three bootstrap simulations produced the following 95% confidence intervals.
13.90 to 23.90
14.00 to 24.15
14.05 to 23.8
Using the t distribution on the sample data. Minitab produced the interval 13.33 to 24.27. The results of the bootstrap simulations and the t distribution method are quite close.
= r/n in place of p. As discussed in the article "How Much Confidence Should You Have in Binomial Confidence Intervals" appearing in issue no. 45 of the magazine STATS (a publication of the American Statistical Association), use of as an estimate for p means that the actual confidence level for the intervals may in fact be smaller than the specified level c. This problem arises even when n is large, especially if p is not near 1/2.A simple adjustment to the formula for the confidence intervals is the plus four estimate, first suggested by Edwin Bidwell Wilson in 1927. It is also called the Agresti-Coull confidence interval. This adjustment works best for 95% confidence intervals.
The plus four adjustment has us add two successes and two failures to the sample data. This means that r , the number of successes, is increased by 2, and n, the sample size is increased by 4. We use the symbol
, read " P tilde, " for the resulting sample estimate of p. So, = (r + 2)/( n + 4)PROCEDURE
HOW TO COMPUTE A PLUS FOUR CONFIDENCE INTERVAL FOR p
Requirements
Consider a binomial experiment with n trials, where p represents the population probability of success and q = 1 - p represents the population probability of failure. Let r be a random variable that represents the number of successes out of the n binomial trials.
The plus four point estimates for p and q are
The number of trials n should be at least 10.
Approximate confidence interval for p
- E p + E Where
c = confidence level (0 c 1)
z c = critical value for confidence level c based on the standard normal distribution
(a) Consider a random sample of 50 trials with 20 successes. Compute a 95% confidence interval for p using the plus four method.
(b) Compute a traditional 95% confidence interval for p using a random sample of 50 trials with 20 successes.
(c) Compare the lengths of the intervals obtained using the two methods. Is the point estimate closer to 1/2 when using the plus four method Is the margin of error smaller when using the plus four method
Consider the following random sample of size 20
12 15 21 2 6 3 15 51 22 18
37 12 25 19 33 15 14 17 12 27
A stem-and-leaf display shows that the data are skewed with one outlier.
We can use Minitab to model the bootstrap method for constructing confidence intervals for . (The Professional edition of Minitab is required because of spreadsheet size and other limitations of the Student edition.) This demonstration uses only 1000 samples. Bootstrap uses many thousands.
Step 1 : Create 1000 new samples, each of size 20, by sampling with replacement from the original data. To do this in Minitab, we enter the original 20 data values in column Cl. Then, in column C2, we place equal probabilities of 0.05 beside each of the original data values. Use the menu choices Calc
Random Data Discrete. In the dialogue box, fill in 1000 as the number of rows, store the data in columns C11-C30, and use column C1 for values and column C2 for probabilities.Step 2 : Find the sample mean of each of the 1000 samples. To do this in Minitab, use the menu choices Calc
Row Statistics. In the dialogue box, select mean. Use columns C11-C30 as the input variables and store the results in column C31.Step3 : Order the 1000 means from smallest to largest. In Minitab, use the menu choices Manip Sort. In the dialogue box, indicate C31 as the column to be sorted. Store the results in column C32. Sort by values in column C3I.
Step 4 : Create a 95% confidence interval by finding the boundaries for the middle 95% of the data. In other words, you need to find the values of the 2.5 percentile ( p 2.5 ) and the 97.5 percentile ( P 97. 5 ). Since there are 1000 data values, the 2.5 percentile is the data value in position 25, while the 97.5 percentile is the data value in position 975. The confidence interval is ( p 2.5 ) P 97. 5.
Demonstration Results
Figure 8-9 shows a histogram of the 1000
values from one bootstrap simulation. Three bootstrap simulations produced the following 95% confidence intervals.13.90 to 23.90
14.00 to 24.15
14.05 to 23.8
Using the t distribution on the sample data. Minitab produced the interval 13.33 to 24.27. The results of the bootstrap simulations and the t distribution method are quite close.
فتح الحزمة
افتح القفل للوصول البطاقات البالغ عددها 88 في هذه المجموعة.
فتح الحزمة
k this deck
37
Critical Thinking Sam computed a 95% confidence interval for from a specific random sample. His confidence interval was 10.1 12.2. He claims that the probability that is in this interval is 0.95. What is wrong with his claim
فتح الحزمة
افتح القفل للوصول البطاقات البالغ عددها 88 في هذه المجموعة.
فتح الحزمة
k this deck
38
Ballooning: Air Temperature How hot is the air in the top (crown) of a hot air balloon Information from Ballooning: The Complete Guide to Riding the Winds by Wirth and Young (Random House) claims that the air in the crown should be an average of 100°C for a balloon to be in a state of equilibrium. However, the temperature does not need to be exactly 100°C. What is a reasonable and safe range of temperatures This range may vary with the size and (decorative) shape of the balloon. All balloons have a temperature gauge in the crown. Suppose that 56 readings (for a balloon in equilibrium) gave a mean temperature of
= 97°C. For this balloon, 17°C.
(a) Compute a 95% confidence interval for the average temperature at which this balloon will be in a steady-state equilibrium.
(b) Interpretation If the average temperature in the crown of the balloon goes above the high end of your confidence interval, do you expect that the balloon will go up or down Explain.
= 97°C. For this balloon, 17°C.(a) Compute a 95% confidence interval for the average temperature at which this balloon will be in a steady-state equilibrium.
(b) Interpretation If the average temperature in the crown of the balloon goes above the high end of your confidence interval, do you expect that the balloon will go up or down Explain.
فتح الحزمة
افتح القفل للوصول البطاقات البالغ عددها 88 في هذه المجموعة.
فتح الحزمة
k this deck
39
In Problems 13-19, assume that the population of x values has an approximately normal distribution.
Diagnostic Tests: Total Calcium Over the past several months, an adult patient has been treated for tetany (severe muscle spasms). This condition is associated with an average total calcium level below 6 mg/dl (Reference: Manual of Laboratory and Diagnostic Tests by F. Fischbach). Recently, the patient's total calcium tests gave the following readings (in mg/dl).
(a) Use a calculator to verify that
= 9.95 and s 1.02.
(b) Find a 99.9% confidence interval for the population mean of total calcium in this patient's blood.
(c) Interpretation Based on your results in part (b), does it seem that this patient still has a calcium deficiency Explain.
Diagnostic Tests: Total Calcium Over the past several months, an adult patient has been treated for tetany (severe muscle spasms). This condition is associated with an average total calcium level below 6 mg/dl (Reference: Manual of Laboratory and Diagnostic Tests by F. Fischbach). Recently, the patient's total calcium tests gave the following readings (in mg/dl).
(a) Use a calculator to verify that
= 9.95 and s 1.02.(b) Find a 99.9% confidence interval for the population mean of total calcium in this patient's blood.
(c) Interpretation Based on your results in part (b), does it seem that this patient still has a calcium deficiency Explain.
فتح الحزمة
افتح القفل للوصول البطاقات البالغ عددها 88 في هذه المجموعة.
فتح الحزمة
k this deck
40
Critical Thinking Jerry tested 30 laptop computers owned by classmates enrolled in a large computer science class and discovered that 22 were infected with keystroke-tracking spyware. Is it appropriate for Jerry to use his data to estimate the proportion of all laptops infected with such spyware Explain.
فتح الحزمة
افتح القفل للوصول البطاقات البالغ عددها 88 في هذه المجموعة.
فتح الحزمة
k this deck
41
Navajo Lifestyle: Traditional Hogans A random sample of 5222 permanent dwellings on the entire Navajo Indian Reservation showed that 1619 were traditional Navajo hogans ( Navajo Architecture: Forms, History. Distributions by jett and spencer, University of Arizona Press).
(a) Let p he the proportion of all permanent dwellings on the entire Navajo Reservation that are traditional hogans. Find a point estimate tor p.
(b) Find a 99% confidence interval for p. Give a brief interpretation of the confidence interval.
(c) Check Requirements Do you think that np 5 and nq 5 are satisfied for this problem Explain why this would be an important consideration.
فتح الحزمة
افتح القفل للوصول البطاقات البالغ عددها 88 في هذه المجموعة.
فتح الحزمة
k this deck
42
Critical Thinking Sam computed a 90% confidence interval for from a specific random sample of size n. He claims that at the 90% confidence level, his confidence interval contains . Is his claim correct Explain.
فتح الحزمة
افتح القفل للوصول البطاقات البالغ عددها 88 في هذه المجموعة.
فتح الحزمة
k this deck
43
Use Table 4 of the Appendix to find t c for a 0.95 confidence level when the sample size is 18.
فتح الحزمة
افتح القفل للوصول البطاقات البالغ عددها 88 في هذه المجموعة.
فتح الحزمة
k this deck
44
In Problems 13-19, assume that the population of x values has an approximately normal distribution.
Hospitals: Charity Care What percentage of hospitals provide at least some charity care The following problem is based on information taken from State Health Care Data: Utilization, Spending and Characteristics (American Medical Association). Based on random sample of hospital reports from eastern states, the following information was obtained (units in percentage of hospitals providing at least some charity care).
57.1 56.2 53.0 66.1 59.0 64.7 70.1 64.7 53.5 78.2
(a) Use a calculator with mean and sample standard deviation keys to verify that
62.3% and s 8.0%.
(b) Find a 90% confidence interval for the population average of the percentage of hospitals providing at least some charity care.
(c) Interpretation What does the confidence interval mean in the context of this problem
Hospitals: Charity Care What percentage of hospitals provide at least some charity care The following problem is based on information taken from State Health Care Data: Utilization, Spending and Characteristics (American Medical Association). Based on random sample of hospital reports from eastern states, the following information was obtained (units in percentage of hospitals providing at least some charity care).
57.1 56.2 53.0 66.1 59.0 64.7 70.1 64.7 53.5 78.2
(a) Use a calculator with mean and sample standard deviation keys to verify that
62.3% and s 8.0%.(b) Find a 90% confidence interval for the population average of the percentage of hospitals providing at least some charity care.
(c) Interpretation What does the confidence interval mean in the context of this problem
فتح الحزمة
افتح القفل للوصول البطاقات البالغ عددها 88 في هذه المجموعة.
فتح الحزمة
k this deck
45
Psychology: Closure How large a sample is needed in Problem 5 if we wish to be 99% confident that the sample mean score is within 2 points of the population mean score for students who are high on the need for closure
فتح الحزمة
افتح القفل للوصول البطاقات البالغ عددها 88 في هذه المجموعة.
فتح الحزمة
k this deck
46
Archaeology: Pottery Santa Fe black-on-white is a type of pottery commonly found at archaeological excavations in Bandelier National Monument. At one excavation site a sample of 592 potsherds was found, of which 360 were identified as Santa Fe black-on-white (Bandelier Archaeological Excavation Project: Summer 1990 Excavations at Burnt Mesa Pueblo and Casa del Rito, edited by Kohler and Root. Washington State University).
(a) Let p represent the population proportion of Santa Fe black-on-white potsherds at the excavation site. Find a point estimate for p.
(b) Find a 95% confidence interval for p. Give a brief statement of the meaning of the confidence interval.
(c) Check Requirements Do you think the conditions np 5 and nq 5 are satisfied in this problem Why would this be important
فتح الحزمة
افتح القفل للوصول البطاقات البالغ عددها 88 في هذه المجموعة.
فتح الحزمة
k this deck
47
Basic Computation: Confidence Interval Suppose x has a normal distribution with = 6. A random sample of size 16 has sample mean 50.
(a) Check Requirements Is it appropriate to use a normal distribution to compute a confidence interval for the population mean Explain.
(b) Find a 90% confidence interval for .
(c) Interpretation Explain the meaning of the confidence interval you computed.
(a) Check Requirements Is it appropriate to use a normal distribution to compute a confidence interval for the population mean Explain.
(b) Find a 90% confidence interval for .
(c) Interpretation Explain the meaning of the confidence interval you computed.
فتح الحزمة
افتح القفل للوصول البطاقات البالغ عددها 88 في هذه المجموعة.
فتح الحزمة
k this deck
48
Use Table 4 of the Appendix to find t c for a 0.99 confidence level when the sample size is 4.
فتح الحزمة
افتح القفل للوصول البطاقات البالغ عددها 88 في هذه المجموعة.
فتح الحزمة
k this deck
49
In Problems 13-19, assume that the population of x values has an approximately normal distribution.
Critical Thinking: Boxplots and Confidence Intervals The distribution of heights of 18-year-old men in the United States is approximately normal, with mean 68 inches and standard deviation 3 inches (U.S. Census Bureau). In Minitab, we can simulate the drawing of random samples of size 20 from this population (
Calc
Random Data
Normal , with 20 rows from a distribution with mean 68 and standard deviation 3). Then we can have Minitab compute a 95% confidence interval and draw a boxplot of the data (
Stat
Basic Statistics
I-Sample t , with boxplot selected in the graphs). The boxplots and confidence intervals for four different samples are shown in the accompanying figures. The four confidence intervals are
(a) Examine the figure [parts (a) to (d)]. How do the boxplots for the four samples differ Why should you expect the boxplots to differ
95% Confidence Intervals for Mean Height of 18-Year-Old Men (Sample size 20)
(b) Examine the 95% confidence intervals for the four samples shown in the printout. Do the intervals differ in length Do the intervals all contain the expected population mean of 68 inches If we draw more samples, do you expect all of the resulting 95% confidence intervals to contain = 68 Why or why not
Critical Thinking: Boxplots and Confidence Intervals The distribution of heights of 18-year-old men in the United States is approximately normal, with mean 68 inches and standard deviation 3 inches (U.S. Census Bureau). In Minitab, we can simulate the drawing of random samples of size 20 from this population (
Calc Random Data Normal , with 20 rows from a distribution with mean 68 and standard deviation 3). Then we can have Minitab compute a 95% confidence interval and draw a boxplot of the data ( Stat Basic Statistics I-Sample t , with boxplot selected in the graphs). The boxplots and confidence intervals for four different samples are shown in the accompanying figures. The four confidence intervals are (a) Examine the figure [parts (a) to (d)]. How do the boxplots for the four samples differ Why should you expect the boxplots to differ
95% Confidence Intervals for Mean Height of 18-Year-Old Men (Sample size 20)
(b) Examine the 95% confidence intervals for the four samples shown in the printout. Do the intervals differ in length Do the intervals all contain the expected population mean of 68 inches If we draw more samples, do you expect all of the resulting 95% confidence intervals to contain = 68 Why or why not
فتح الحزمة
افتح القفل للوصول البطاقات البالغ عددها 88 في هذه المجموعة.
فتح الحزمة
k this deck
50
Critical Thinking: Brain Teaser A requirement for using the normal distribution to approximate the
distribution is that both np 5 and nq 5. Since we usually do not known p , we estimate p by
and q by
= 1 -
. Then we require that n
5 and n
5. Show that the conditions n
5 and n
5 are equivalent to the condition that out of n binomial trails, both the number of successes r and the number of failures n - r must exceed 5. Hint: In the inequality n
5, replace
by r/n and solve for r. In the inequality n
5, replace
by ( n - r )/ n and solve for n - r.
distribution is that both np 5 and nq 5. Since we usually do not known p , we estimate p by and q by = 1 - . Then we require that n 5 and n 5. Show that the conditions n 5 and n 5 are equivalent to the condition that out of n binomial trails, both the number of successes r and the number of failures n - r must exceed 5. Hint: In the inequality n 5, replace by r/n and solve for r. In the inequality n 5, replace by ( n - r )/ n and solve for n - r. فتح الحزمة
افتح القفل للوصول البطاقات البالغ عددها 88 في هذه المجموعة.
فتح الحزمة
k this deck
51
Health Care: Colorado Physicians A random sample of 5792 physicians in Colorado showed that 3139 provide at least some charity care (i.e., treat poor people at no cost). These data are based on information from State Health Care Data: Utilization. Spending, and Characteristics (American Medical | Association).
(a) Let p represent the proportion of all Colorado physicians who provide some charity care. Find a point estimate for p.
(b) Find a 99% confidence interval for p. Give a brief explanation of the meaning of your answer in the context of this problem.
(c) Check Requirements Is the normal approximation to the binomial justified in this problem Explain.
فتح الحزمة
افتح القفل للوصول البطاقات البالغ عددها 88 في هذه المجموعة.
فتح الحزمة
k this deck
52
Basic Computation: Confidence Interval Suppose x has a mound-shaped distribution with = 9. A random sample of size 36 has sample mean 20.
(a) Check Requirements Is it appropriate to use a normal distribution to compute a confidence interval for the population mean Explain.
(b) Find a 95% confidence interval for .
(c) Interpretation Explain the meaning of the confidence interval you computed.
(a) Check Requirements Is it appropriate to use a normal distribution to compute a confidence interval for the population mean Explain.
(b) Find a 95% confidence interval for .
(c) Interpretation Explain the meaning of the confidence interval you computed.
فتح الحزمة
افتح القفل للوصول البطاقات البالغ عددها 88 في هذه المجموعة.
فتح الحزمة
k this deck
53
Use Table 4 of the Appendix to find t c for a 0.90 confidence level when the sample size is 22.
فتح الحزمة
افتح القفل للوصول البطاقات البالغ عددها 88 في هذه المجموعة.
فتح الحزمة
k this deck
54
Crime Rate: Demo The following data represent crime rates per 1000 population for a random sample of 46 Denver neighborhoods (Reference: The Piton Foundation, Denver, Colorado).
(a) Use a calculator with mean and sample standard deviation keys to verify that
64.2 and s 27.9 crimes per 1000 population.
(b) Let us say that the preceding data are representative of the population crime rates in Denver neighborhoods. Compute an 80% confidence interval for , the population mean crime rate for all Denver neighborhoods.
(c) Interpretation Suppose you are advising the police department about police patrol assignments. One neighborhood has a crime rate of 57 crimes per 1000 population. Do you think that this rate is below the average population crime rate and that fewer patrols could safely be assigned to this neighborhood Use the confidence interval to justify your answer.
(d) Interpretation Another neighborhood has a crime rate of 75 crimes per 1000 population. Does this crime rate seem to be higher than the population average Would you recommend assigning more patrols to this neighborhood Use the confidence interval to justify your answer.
(e) Repeat parts (b), (c), and (d) for a 95% confidence interval.
(f) Check Requirement In previous problems, we assumed the x distribution was normal or approximately normal. Do we need to make such an assumption in this problem Why or why not Hint: See the central limit theorem in Section 7.5.
(a) Use a calculator with mean and sample standard deviation keys to verify that
64.2 and s 27.9 crimes per 1000 population.(b) Let us say that the preceding data are representative of the population crime rates in Denver neighborhoods. Compute an 80% confidence interval for , the population mean crime rate for all Denver neighborhoods.
(c) Interpretation Suppose you are advising the police department about police patrol assignments. One neighborhood has a crime rate of 57 crimes per 1000 population. Do you think that this rate is below the average population crime rate and that fewer patrols could safely be assigned to this neighborhood Use the confidence interval to justify your answer.
(d) Interpretation Another neighborhood has a crime rate of 75 crimes per 1000 population. Does this crime rate seem to be higher than the population average Would you recommend assigning more patrols to this neighborhood Use the confidence interval to justify your answer.
(e) Repeat parts (b), (c), and (d) for a 95% confidence interval.
(f) Check Requirement In previous problems, we assumed the x distribution was normal or approximately normal. Do we need to make such an assumption in this problem Why or why not Hint: See the central limit theorem in Section 7.5.
فتح الحزمة
افتح القفل للوصول البطاقات البالغ عددها 88 في هذه المجموعة.
فتح الحزمة
k this deck
55
Archaeology: Excavations The Wind Mountain archaeological site is located in southwestern New Mexico. Wind Mountain was home to an ancient culture of prehistoric Native Americans called Anasazi. A random sample of excavations at Wind Mountain gave the following depths (in centimeters) from present-day surface grade to the location of significant archaeological artifacts (Source: Mimbres Mogollon Archaeology, by A. Woosley and A. McIntyre, University of New Mexico Press).
(a) Use a calculator with mean and sample standard deviation keys to verify that
74.2 cm and s 18.3 cm.
(b) Compute a 95% confidence interval for the mean depth at which archaeological artifacts from the Wind Mountain excavation site can be found.
(a) Use a calculator with mean and sample standard deviation keys to verify that
74.2 cm and s 18.3 cm.(b) Compute a 95% confidence interval for the mean depth at which archaeological artifacts from the Wind Mountain excavation site can be found.
فتح الحزمة
افتح القفل للوصول البطاقات البالغ عددها 88 في هذه المجموعة.
فتح الحزمة
k this deck
56
Law Enforcement: Escaped Convicts Case studies showed that out of 10.351 convicts who escaped from U.S. prisons, only 7867 were recaptured (the Book of Odds by Shook and Shook, Signet).
(a) Let p represent the proportion of all escaped convicts who will eventually be recaptured. Find a point estimate for p.
(b) Find a 99% confidence interval for p. Give a brief statement of the meaning of the confidence interval.
(c) Check Requirements Is use of the normal approximation to the binomial justified in this problem Explain.
فتح الحزمة
افتح القفل للوصول البطاقات البالغ عددها 88 في هذه المجموعة.
فتح الحزمة
k this deck
57
Basic Computation: Sample size Suppose x has a mound-shaped distribution with = 3.
(a) Find the minimal sample size required so that for a 95% confidence interval, the maximal margin of error is E = 0.4.
(b) Check Requirements Based on this sample size, can we assume that the
distribution is approximately normal Explain.
(a) Find the minimal sample size required so that for a 95% confidence interval, the maximal margin of error is E = 0.4.
(b) Check Requirements Based on this sample size, can we assume that the
distribution is approximately normal Explain. فتح الحزمة
افتح القفل للوصول البطاقات البالغ عددها 88 في هذه المجموعة.
فتح الحزمة
k this deck
58
Use Table 4 of the Appendix to find t c for a 0.95 confidence level when the sample size is 12.
فتح الحزمة
افتح القفل للوصول البطاقات البالغ عددها 88 في هذه المجموعة.
فتح الحزمة
k this deck
59
Finance: P/E Ratio The price of a share of stock divided by a company's estimated future earnings per share is called the P/E ratio. High P/E, ratios usually indicate "growth" stocks, or maybe stocks that are simply overpriced. Low P/E ratios indicate "value" stocks or bargain stocks. A random sample of 51 of the largest companies in the United States gave the following P/E ratios (Reference: Forbes ).
(a) Use a calculator with mean and sample standard deviation keys to verify that
25.2 and s 15.5.
(b) Find a 90% confidence interval for the P/E population mean of all large U.S. companies.
(c) Find a 99% confidence interval for the P/E population mean of all large U.S. companies.
(d) Interpretation Bank One (now merged with J.P Morgan) had a P/E of 12, AT T Wireless had a P/E of 72, and Disney had a P/E of 24. Examine the confidence intervals in parts (b) and (c). How would you describe these stocks at the time the sample was taken
(e) Check Requirements In previous problems, we assumed the x distribution was normal or approximately normal. Do we need to make such an assumption in this problem Why or why not Hint: See the central limit theorem in Section 7.5.
(a) Use a calculator with mean and sample standard deviation keys to verify that
25.2 and s 15.5.(b) Find a 90% confidence interval for the P/E population mean of all large U.S. companies.
(c) Find a 99% confidence interval for the P/E population mean of all large U.S. companies.
(d) Interpretation Bank One (now merged with J.P Morgan) had a P/E of 12, AT T Wireless had a P/E of 72, and Disney had a P/E of 24. Examine the confidence intervals in parts (b) and (c). How would you describe these stocks at the time the sample was taken
(e) Check Requirements In previous problems, we assumed the x distribution was normal or approximately normal. Do we need to make such an assumption in this problem Why or why not Hint: See the central limit theorem in Section 7.5.
فتح الحزمة
افتح القفل للوصول البطاقات البالغ عددها 88 في هذه المجموعة.
فتح الحزمة
k this deck
60
Basic Computation: Confidence Interval for p Consider n = 100 binomial trails with r = 30 successes.
(a) Check Requirements Is it appropriate to use a normal distribution to approximate the
distribution
(b) Find a 90% confidence interval for the population proportion of successes p.
(c) Interpretation Explain the meaning of the confidence interval you computed.
(a) Check Requirements Is it appropriate to use a normal distribution to approximate the
distribution(b) Find a 90% confidence interval for the population proportion of successes p.
(c) Interpretation Explain the meaning of the confidence interval you computed.
فتح الحزمة
افتح القفل للوصول البطاقات البالغ عددها 88 في هذه المجموعة.
فتح الحزمة
k this deck
61
Fishing: Barbless Hooks In a combined study of northern pike, cutthroat trout, rainbow trout, and lake trout, it was found that 26 out of 855 fish died when caught and released using barbless hooks on flies or lures All hooks were removed from the fish (Source: A National Symposium on Catch and Release Fishing. Humboldt State University Press).
(a) Let p represent the proportion of all pike and trout that die (i.e.. p is the mortality rate) when caught and released using barbless hooks Find a point estimate for p.
(b) Find a 99% confidence interval for p and give a brief explanation of the meaning of the interval.
(c) Check Requirements Is the normal approximation to the binomial justified in this problem Explain.
فتح الحزمة
افتح القفل للوصول البطاقات البالغ عددها 88 في هذه المجموعة.
فتح الحزمة
k this deck
62
Basic Computation: Sample size Suppose x has a normal distribution with = 1.2.
(a) Find the minimal sample size required so that for a 90% confidence interval, the maximal margin of error is E = 0.5.
(b) Check Requirements Based on this sample size and the x distribution, can we assume that the
distribution is approximately normal Explain.
(a) Find the minimal sample size required so that for a 90% confidence interval, the maximal margin of error is E = 0.5.
(b) Check Requirements Based on this sample size and the x distribution, can we assume that the
distribution is approximately normal Explain. فتح الحزمة
افتح القفل للوصول البطاقات البالغ عددها 88 في هذه المجموعة.
فتح الحزمة
k this deck
63
Statistical Literacy Student's t distributions are symmetric about a value of t. What is that t value
فتح الحزمة
افتح القفل للوصول البطاقات البالغ عددها 88 في هذه المجموعة.
فتح الحزمة
k this deck
64
Baseball: Home Run Percentage The home run percentage is the number of home runs per 100 times at bat. A random sample of 43 professional baseball players gave the following data for home run percentages (Reference: The Baseball Encyclopedia, Macmillan).
(a) Use a calculator with mean and sample standard deviation keys to verify that
2.29 and s 1.40.
(b) Compute a 90% confidence interval for the population mean of home run percentages for all professional baseball players. Hint: If you use Table 4 of the Appendix, be sure to use the closest d.f. that is smaller.
(c) Compute a 99% confidence interval for the population mean of home run percentages for all professional baseball players.
(d) Interpretation The home run percentages for three professional players are
Tim Huelett, 2.5 Herb Hunter, 2.0 Jackie Jensen, 3.8
Examine your confidence intervals and describe how the home run percentages for these players compare to the population average.
(e) Check Requirements In previous problems, we assumed the x distribution was normal or approximately normal. Do we need to make such an assumption in this problem Why or why not Hint: See the central limit theorem in Section 7.5.
(a) Use a calculator with mean and sample standard deviation keys to verify that
2.29 and s 1.40.(b) Compute a 90% confidence interval for the population mean of home run percentages for all professional baseball players. Hint: If you use Table 4 of the Appendix, be sure to use the closest d.f. that is smaller.
(c) Compute a 99% confidence interval for the population mean of home run percentages for all professional baseball players.
(d) Interpretation The home run percentages for three professional players are
Tim Huelett, 2.5 Herb Hunter, 2.0 Jackie Jensen, 3.8
Examine your confidence intervals and describe how the home run percentages for these players compare to the population average.
(e) Check Requirements In previous problems, we assumed the x distribution was normal or approximately normal. Do we need to make such an assumption in this problem Why or why not Hint: See the central limit theorem in Section 7.5.
فتح الحزمة
افتح القفل للوصول البطاقات البالغ عددها 88 في هذه المجموعة.
فتح الحزمة
k this deck
65
Archaeology: Pottery Shards of clay vessels were put together to reconstruct rim diameters of the original ceramic vessels found at the wind Mountain archaeological site (see source in Problem 7). A random sample of ceramic vessels gave the following rim diameters (in centimeters):
15.9 13.4 22.1 12.7 13.1 19.6 11.7 13.5 17.7 18.1
(a) Use a calculator with mean and sample standard deviation keys to verify that
15.8 cm and s 3.5 cm.
(b) Compute an 80% confidence interval for the population mean of rim diameters for such ceramic vessels found at the Wind Mountain archaeological site.
15.9 13.4 22.1 12.7 13.1 19.6 11.7 13.5 17.7 18.1
(a) Use a calculator with mean and sample standard deviation keys to verify that
15.8 cm and s 3.5 cm.(b) Compute an 80% confidence interval for the population mean of rim diameters for such ceramic vessels found at the Wind Mountain archaeological site.
فتح الحزمة
افتح القفل للوصول البطاقات البالغ عددها 88 في هذه المجموعة.
فتح الحزمة
k this deck
66
Focus problems: Trick or Treat In a survey of a random sample of 35 households in the Cherry Creek neighborhood of Denver, it was found that 11 households turned out the lights and pretended not to be home on Halloween.
(a) Compute a 90% confidence interval for p , the proportion of all households in Cherry Creek that pretend not to be home on Halloween.
(b) What assumptions are necessary to calculate the confidence interval of part (a)
(c) Interpretation The national proportion of all households in the United States that turn out the lights and pretend not to be home on Halloween is 0.28. Is 0.28 in the confidence interval you computed Based on your answer, does it seem that the Cherry Creek neighborhood is much different (either a higher or lower proportion) from the population of all U.S. households Explain.
فتح الحزمة
افتح القفل للوصول البطاقات البالغ عددها 88 في هذه المجموعة.
فتح الحزمة
k this deck
67
Zoology : Hummingbirds Allen's hummingbird ( selasphorus sasin ) has been studied by zoologist Bill Alther (Reference: Hummingbirds by K. Long and w. Alther). A small group of 15 Allen's hummingbirds has been under study in Arizona. The average wait for these birds is
= 3.15 grams. Based on previous studies, we can assume that the weights of Allen's hummingbirds have a normal distribution, with = 0.33 gram.
(a) Find an 80% confidence interval for the average weights of Allen's hummingbirds in the study region. What is the margin of error
(b) What conditions are necessary for your calculations
(c) Interpret your results in the context of this problem.
(d) Sample Size Find the sample size necessary for an 80% confidence level with a maximal margin of error E = 0.08 for the mean weights of the hummingbirds.
= 3.15 grams. Based on previous studies, we can assume that the weights of Allen's hummingbirds have a normal distribution, with = 0.33 gram.(a) Find an 80% confidence interval for the average weights of Allen's hummingbirds in the study region. What is the margin of error
(b) What conditions are necessary for your calculations
(c) Interpret your results in the context of this problem.
(d) Sample Size Find the sample size necessary for an 80% confidence level with a maximal margin of error E = 0.08 for the mean weights of the hummingbirds.
فتح الحزمة
افتح القفل للوصول البطاقات البالغ عددها 88 في هذه المجموعة.
فتح الحزمة
k this deck
68
Statistical Literacy As the degrees of freedom increase, what distribution does the student's t distribution become more like
فتح الحزمة
افتح القفل للوصول البطاقات البالغ عددها 88 في هذه المجموعة.
فتح الحزمة
k this deck
69
Expand Your Knowledge: Alternate Method for Confidence Intervals When is unknown and the sample is of size n 30, there are two methods for computing confidence intervals for .
Method 1: Use the Student's t distribution with d.f. = n - 1.
This is the method used in the text. It is widely employed in statistical studies. Also, most statistical software packages use this method.
Method 2: When n 30, use the sample standard deviation s as an estimate for , and then use the standard normal distribution.
This method is based on the fact that for large samples, s is a fairly good approximation for . Also, for large n, the critical values for the Student's t distribution approach those of the standard normal distribution.
Consider a random sample of size n = 31, with sample mean
= 45.2 and sample standard deviation s = 5.3.
(a) Compute 90%, 95%, and 99% confidence intervals for using Method 1 with a Student's t distribution. Round endpoints to two digits after the decimal.
(b) Compute 90%, 95%, and 99% confidence intervals for using Method 2 with the standard normal distribution. Use s as an estimate for . Round endpoints to two digits after the decimal.
(c) Compare intervals for the two methods. Would you say that confidence intervals using a Student's t distribution are more conservative in the sense that they tend to be longer than intervals based on the standard normal distribution
(d) Repeat parts (a) through (c) for a sample of size n = 81. With increased sample size, do the two methods give respective confidence intervals that are more similar
Method 1: Use the Student's t distribution with d.f. = n - 1.
This is the method used in the text. It is widely employed in statistical studies. Also, most statistical software packages use this method.
Method 2: When n 30, use the sample standard deviation s as an estimate for , and then use the standard normal distribution.
This method is based on the fact that for large samples, s is a fairly good approximation for . Also, for large n, the critical values for the Student's t distribution approach those of the standard normal distribution.
Consider a random sample of size n = 31, with sample mean
= 45.2 and sample standard deviation s = 5.3.(a) Compute 90%, 95%, and 99% confidence intervals for using Method 1 with a Student's t distribution. Round endpoints to two digits after the decimal.
(b) Compute 90%, 95%, and 99% confidence intervals for using Method 2 with the standard normal distribution. Use s as an estimate for . Round endpoints to two digits after the decimal.
(c) Compare intervals for the two methods. Would you say that confidence intervals using a Student's t distribution are more conservative in the sense that they tend to be longer than intervals based on the standard normal distribution
(d) Repeat parts (a) through (c) for a sample of size n = 81. With increased sample size, do the two methods give respective confidence intervals that are more similar
فتح الحزمة
افتح القفل للوصول البطاقات البالغ عددها 88 في هذه المجموعة.
فتح الحزمة
k this deck
70
Basic Computation: Confidence Interval for p Consider n = 200 binomial trails with r = 80 successes.
(a) Check Requirements Is it appropriate to use a normal distribution to approximate the
distribution
(b) Find a 95% confidence interval for the population proportion of successes p.
(c) Interpretation Explain the meaning of the confidence interval you computed.
(a) Check Requirements Is it appropriate to use a normal distribution to approximate the
distribution(b) Find a 95% confidence interval for the population proportion of successes p.
(c) Interpretation Explain the meaning of the confidence interval you computed.
فتح الحزمة
افتح القفل للوصول البطاقات البالغ عددها 88 في هذه المجموعة.
فتح الحزمة
k this deck
71
Marketing: Customer Loyalty In a marketing survey, a random sample of 730 women shoppers revealed that 628 remained loyal to their favorite supermarket during the past year (i.e., did not switch stores) (Source: Trends in the United States : Consumer attitudes and the supermarket, The Research Department, Food Marketing Institute).
(a) Let p represent the proportion of all women shoppers who remain loyal to their favorite supermarket. Find a point estimate for p.
(b) Find a 95% confidence interval for p. Give a brief explanation of the meaning of the interval.
(c) Interpretation As a news writer, how would you report the survey results regarding the percentage of women supermarket shoppers who remained loyal to their favorite supermarket during the past year What is the margin of error based on a 95% confidence interval
فتح الحزمة
افتح القفل للوصول البطاقات البالغ عددها 88 في هذه المجموعة.
فتح الحزمة
k this deck
72
Diagnostic Tests: Uric Acid overproduction of uric acid in the body can be an indication of cell breakdown This may be an advance indication of illness such as gout, leukemia, or lymphoma (Reference: Manual of Laboratory and Diagnostic Tests by F. Fischbach). Over a period of months, an adult male patient has taken eight blood tests for uric acid. The mean concentration was
= 5.35 mg/dl. The distribution of uric acid in healthy adult males can be assumed to be normal, with = 1.85 mg/dl.
(a) Find a 95% confidence interval for the population mean concentration of uric acid in this patient's blood. What is the margin of error
(b) What conditions are necessary for your calculations
(c) Interpret your results in the context of this problem.
(d) Sample Size Find the sample size necessary for a 95% confidence level with maximal margin of error E = 1.10 for the mean concentration of uric acid in this patient's blood.
= 5.35 mg/dl. The distribution of uric acid in healthy adult males can be assumed to be normal, with = 1.85 mg/dl.(a) Find a 95% confidence interval for the population mean concentration of uric acid in this patient's blood. What is the margin of error
(b) What conditions are necessary for your calculations
(c) Interpret your results in the context of this problem.
(d) Sample Size Find the sample size necessary for a 95% confidence level with maximal margin of error E = 1.10 for the mean concentration of uric acid in this patient's blood.
فتح الحزمة
افتح القفل للوصول البطاقات البالغ عددها 88 في هذه المجموعة.
فتح الحزمة
k this deck
73
Critical Thinking Consider a 90% confidence interval for . Assume is not known for which sample size, n = 10 or n = 20, is the critical value t c large
فتح الحزمة
افتح القفل للوصول البطاقات البالغ عددها 88 في هذه المجموعة.
فتح الحزمة
k this deck
74
Statistical Literacy In your own words, carefully explain the meanings of the following terms: point estimate, critical value, maximal margin of error, confidence level, and confidence interval.
فتح الحزمة
افتح القفل للوصول البطاقات البالغ عددها 88 في هذه المجموعة.
فتح الحزمة
k this deck
75
Telephone Interviews: Survey The National Study of the Changing Work Force conducted an extensive survey of 2958 wage and salaried workers on issues ranging from relationships with their bosses to household chores. The data were gathered through hour-long telephone interviews with a nationally representative sample ( The Wall Street Journal ). In response to the question "What docs success mean to you" 1538 responded. "Personal satisfaction from doing a good job." Let p be the population proportion of all wage and salaried workers who would respond the same way to the stated question. Find a 90% confidence interval for p.
فتح الحزمة
افتح القفل للوصول البطاقات البالغ عددها 88 في هذه المجموعة.
فتح الحزمة
k this deck
76
Marketing: Bargain Hunters In a marketing survey, a random sample of 1001 supermarket shoppers revealed that 273 always stock up on an item when they find that item at a real bargain price. (See reference in Problem 19.)
(a) Let p represent the proportion of all supermarket shoppers who always stock up on an item when they find a real bargain. Find a point estimate for p.
(b) Find a 95% confidence interval for p. Give a brief explanation of the meaning of the interval.
(c) Interpretation As a news writer, how would you report the survey results on the percentage of supermarket Shoppers who stock up on real-bargain items What is the margin of error based on a 95% confidence interval
فتح الحزمة
افتح القفل للوصول البطاقات البالغ عددها 88 في هذه المجموعة.
فتح الحزمة
k this deck
77
Statistical Literacy value z c is a value from the standard normal distribution such that P (- z c x z c ) = C.
فتح الحزمة
افتح القفل للوصول البطاقات البالغ عددها 88 في هذه المجموعة.
فتح الحزمة
k this deck
78
Diagnostic Tests: Plasma Volume Total plasma volume is important in determining the required plasma component in blood replacement therapy for a person undergoing surgery. Plasma volume is influenced by the overall health and physical activity of an individual. (Reference: See Problem 16.)
Suppose that a random sample of 45 male firefighters are tested and that they have a plasma volume sample mean of
= 37.5 ml/kg (milliliters plasma per kilogram body weight). Assume that = 7.50 ml/kg for the distribution of blood plasma.
(a) Find a 99% confidence interval for the population mean blood plasma volume in male firefighters. What is the margin of error
(b) What conditions are necessary for your calculations
(C) Interpret your results in the context of this problem.
(d) Sample Size Find the sample size necessary for a 99% confidence level with maximal margin of error E = 2.50 for the mean plasma volume in male firefighters.
Suppose that a random sample of 45 male firefighters are tested and that they have a plasma volume sample mean of
= 37.5 ml/kg (milliliters plasma per kilogram body weight). Assume that = 7.50 ml/kg for the distribution of blood plasma.(a) Find a 99% confidence interval for the population mean blood plasma volume in male firefighters. What is the margin of error
(b) What conditions are necessary for your calculations
(C) Interpret your results in the context of this problem.
(d) Sample Size Find the sample size necessary for a 99% confidence level with maximal margin of error E = 2.50 for the mean plasma volume in male firefighters.
فتح الحزمة
افتح القفل للوصول البطاقات البالغ عددها 88 في هذه المجموعة.
فتح الحزمة
k this deck
79
Critical Thinking Consider a 90% confidence interval for . Assume is not known for which sample size, n = 10 or n = 20, is the confidence interval longer
فتح الحزمة
افتح القفل للوصول البطاقات البالغ عددها 88 في هذه المجموعة.
فتح الحزمة
k this deck
80
Statistical Literacy For a binomial experiment with r successes out of n trials, what value do we use as a point estimate for the probability of success p on a single trial
فتح الحزمة
افتح القفل للوصول البطاقات البالغ عددها 88 في هذه المجموعة.
فتح الحزمة
k this deck
فتح الحزمة
افتح القفل للوصول البطاقات البالغ عددها 88 في هذه المجموعة.


