Deck 12: Linear Regression and Correlation
ملء الشاشة (f)
سؤال
If there is a negative correlation between the independent variable x and the dependent variable y, then to test this, the appropriate null and alternative hypotheses would be 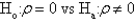 .
.
. سؤال
In regression analysis, a careful study of the differences,  , between observed and estimated y values, given x (in order to decide whether crucial assumptions are fulfilled that allow valid inferences about the true regression line to be made from an estimated regression line) is called residual analysis.
, between observed and estimated y values, given x (in order to decide whether crucial assumptions are fulfilled that allow valid inferences about the true regression line to be made from an estimated regression line) is called residual analysis. سؤال
سؤال
سؤال
سؤال
The regression model  = 36.5 + 20.1x has been computed based on a sample of 50 observations. One observation in the sample was (x, y) = (14, 350.9). Given this, the residual value for this observation is 33.
= 36.5 + 20.1x has been computed based on a sample of 50 observations. One observation in the sample was (x, y) = (14, 350.9). Given this, the residual value for this observation is 33. سؤال
سؤال
سؤال
Given that n = 37, and the value of sample Spearman rank correlation coefficient  = 0.35, the value of the test statistic for testing
 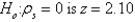 .
.
= 0.35, the value of the test statistic for testing . سؤال
سؤال
سؤال
سؤال
سؤال
In a simple linear regression problem, the least squares line is  = 2.73 - 1.02x, and the coefficient of determination is 0.7744. The correlation coefficient must be -0.88.
= 2.73 - 1.02x, and the coefficient of determination is 0.7744. The correlation coefficient must be -0.88. سؤال
The prediction interval developed from a simple linear regression model will be very narrow when the value of x used to predict y is equal to the mean value  .
.
. سؤال
سؤال
سؤال
سؤال
سؤال
سؤال
In the simple linear regression model 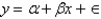 which of the following is true regarding the values of the random error term
  ?
?
A) They are independent.
B) They have a mean of 0 and a common variance, independent of x.
C) They are normally distributed.
D) All of these.
E) None of these.
which of the following is true regarding the values of the random error term ?A) They are independent.
B) They have a mean of 0 and a common variance, independent of x.
C) They are normally distributed.
D) All of these.
E) None of these.
سؤال
سؤال
سؤال
سؤال
سؤال
سؤال
Given the least squares regression line  = -4.63 + 1.38x, and a coefficient of determination of 0.9025, the correlation coefficient must be:
A) -0.95
B) +0.95
C) +1.38
D) -0.81
E) 0.81
= -4.63 + 1.38x, and a coefficient of determination of 0.9025, the correlation coefficient must be:A) -0.95
B) +0.95
C) +1.38
D) -0.81
E) 0.81
سؤال
سؤال
In the simple linear regression model  which of the following is false regarding the values of the random error term
  ?
?
A) They are independent.
B) They have a mean of 0 and a variance of 1, independent of x.
C) They are normally distributed.
D) None of these.
E) All of these.
which of the following is false regarding the values of the random error term ?A) They are independent.
B) They have a mean of 0 and a variance of 1, independent of x.
C) They are normally distributed.
D) None of these.
E) All of these.
سؤال
سؤال
سؤال
سؤال
سؤال
سؤال
سؤال
سؤال
سؤال
سؤال
سؤال
In simple linear regression, the plot of residuals versus fitted values  should:
A) be free of any patterns
B) appear as a random scatter of points about 0 on the vertical axis
C) approximately have the same vertical spread for all values
D) all of these
E) none of these
should:A) be free of any patterns
B) appear as a random scatter of points about 0 on the vertical axis
C) approximately have the same vertical spread for all values
D) all of these
E) none of these
سؤال
A university admissions committee was interested in examining the relationship between a student's score on the SAT exam, x, and the student's grade point average, y, (GPA) at the end the student's freshman year of college. The committee selected a random sample of 25 students and recorded the SAT score and GPA at the end of the freshman year of college for each student. Use the following output that was generated using Minitab to answer the questions below: 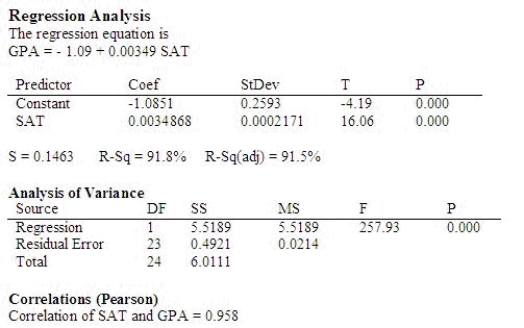 Determine the correlation between a student's SAT score and GPA at the end of the freshman year.
Since b is ______________ the correlation is ______________.
Interpret the value.
There is a ______________ linear relationship between a student's SAT score and GPA at the end of the freshman year.
Determine the correlation between a student's SAT score and GPA at the end of the freshman year.Since b is ______________ the correlation is ______________.
Interpret the value.
There is a ______________ linear relationship between a student's SAT score and GPA at the end of the freshman year.
سؤال
A microwave manufacturer has collected the data shown below on number of units sold (y) in the thousands of dollars and the number of ads (x) placed during the month. 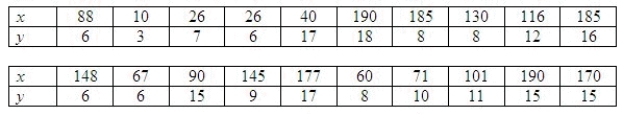 Calculate the preliminary sums of squares and cross-products.
Sxx = ______________
Syy = ______________
Sxy = ______________
Calculate:
SSE = ______________
MSE = ______________
Determine the least-squares regression line. = ______________
Compute a point estimate of number of units sold if there are 140 ads.
______________
Compute the standard error of the point estimate of number of units sold if there are 140 ads.
______________
Compute a 95% confidence interval for the average number of units sold in all months with 140 ads.
______________ Enter (n1, n2)
Compute a 95% prediction interval for sales during the next month that happens to be associated with 140 ads.
______________ Enter (n1, n2)
Calculate the preliminary sums of squares and cross-products.Sxx = ______________
Syy = ______________
Sxy = ______________
Calculate:
SSE = ______________
MSE = ______________
Determine the least-squares regression line.
= ______________Compute a point estimate of number of units sold if there are 140 ads.
______________
Compute the standard error of the point estimate of number of units sold if there are 140 ads.
______________
Compute a 95% confidence interval for the average number of units sold in all months with 140 ads.
______________ Enter (n1, n2)
Compute a 95% prediction interval for sales during the next month that happens to be associated with 140 ads.
______________ Enter (n1, n2)
سؤال
Six points have these coordinates: 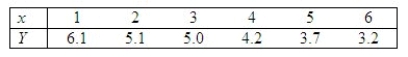 The normal probability plot and the residuals versus fitted values plots generated by Minitab are shown below.
 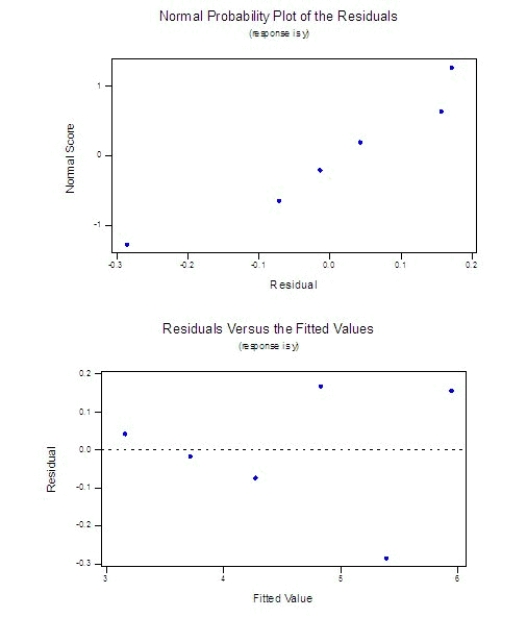 Does it appear that any regression assumptions have been violated?
______________
Explain.
________________________________________________________
The normal probability plot and the residuals versus fitted values plots generated by Minitab are shown below. Does it appear that any regression assumptions have been violated?______________
Explain.
________________________________________________________
سؤال
The manager of an ice cream store is interested in examining the relationship between sales of ice cream (in gallons per day) and maximum temperature of the day. The vendor records the following data for a random sample of five days in the summer, where y is number of gallons of ice cream sold per day and x is maximum temperature, in degrees Fahrenheit, recorded for the day: 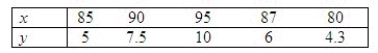 The following summary information were computed:
 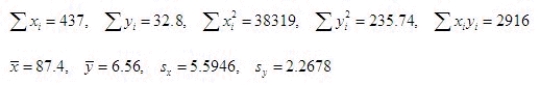 Find and interpret the correlation between maximum daily temperature and daily sales of ice cream.
Syy = ______________
What is the correlation coefficient?
r = ______________
There is ______________ linear relationship between daily sales of ice cream and maximum daily temperature.
The following summary information were computed: Find and interpret the correlation between maximum daily temperature and daily sales of ice cream.Syy = ______________
What is the correlation coefficient?
r = ______________
There is ______________ linear relationship between daily sales of ice cream and maximum daily temperature.
سؤال
If a sample of 25 observations is selected, and the sample correlation coefficient between the variables x and y is r = 0.525, what is the test statistic value for testing 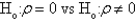
A) About 3.65.
B) About 2.96.
C) About 3.08.
D) About 3.81.
E) About 3.96.
A) About 3.65.
B) About 2.96.
C) About 3.08.
D) About 3.81.
E) About 3.96.
سؤال
سؤال
سؤال
سؤال
سؤال
سؤال
سؤال
سؤال
سؤال
سؤال
A company manager is interested in the relationship between x = number of years that an employee has been with the company and y = the employee's annual salary (in thousands of dollars). The following statistical software output is from a regression analysis for predicting y from x for n = 15 data points. 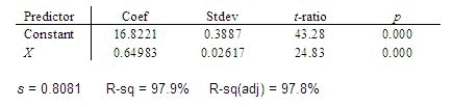 Find the correlation coefficient.
r = ______________
There is ______________ linear relationship between x and y.
Find the correlation coefficient.r = ______________
There is ______________ linear relationship between x and y.
سؤال
سؤال
سؤال
سؤال
The general manager of a chain of furniture stores believes that experience is the most important factor in determining the level of success of a salesperson. To examine this belief she records last month's sales (in $1,000s) and the years of experience of 10 randomly selected salespeople. These data are listed below. 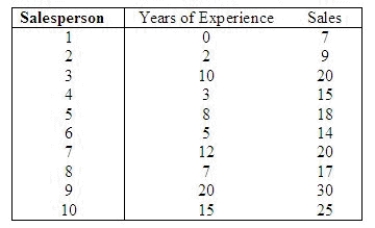 Predict with 95% confidence the monthly sales of a salesperson with 10 years of experience.
CI = ______________ Enter (n1, n2) in thousands
Estimate with 95% confidence the average monthly sales of all salespersons with 10 years of experience.
CI = ______________ Enter (n1, n2) in thousands
Which interval in the previous two questions is narrower: the confidence interval estimate of the expected value of y or the prediction interval for the same given value of x (10 years) and same confidence level?
______________
Why?
________________________________________________________
Predict with 95% confidence the monthly sales of a salesperson with 10 years of experience.CI = ______________ Enter (n1, n2) in thousands
Estimate with 95% confidence the average monthly sales of all salespersons with 10 years of experience.
CI = ______________ Enter (n1, n2) in thousands
Which interval in the previous two questions is narrower: the confidence interval estimate of the expected value of y or the prediction interval for the same given value of x (10 years) and same confidence level?
______________
Why?
________________________________________________________
سؤال
سؤال
سؤال
سؤال
An ardent fan of television game shows has observed that, in general, the more educated the contestant, the less money he or she wins. To test her belief she gathers data about the last eight winners of her favorite game show. She records their winnings in dollars and the number of years of education. The results are as follows. 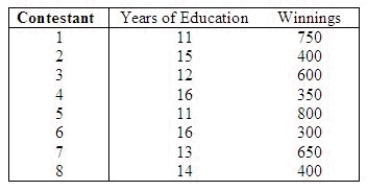 Predict with 95% confidence the winnings of a contestant who has 15 years of education.
CI = ______________ Enter (n1, n2)
Predict with 95% confidence the winnings of a contestant who has 10 years of education.
CI = ______________ Enter (n1, n2)
Estimate with 95% confidence the average winnings of all contestants who have 15 years of education.
CI = ______________ Enter (n1, n2)
Estimate with 95% confidence the average winnings of all contestants who have 10 years of education.
CI = ______________ Enter (n1, n2)
Predict with 95% confidence the winnings of a contestant who has 15 years of education.CI = ______________ Enter (n1, n2)
Predict with 95% confidence the winnings of a contestant who has 10 years of education.
CI = ______________ Enter (n1, n2)
Estimate with 95% confidence the average winnings of all contestants who have 15 years of education.
CI = ______________ Enter (n1, n2)
Estimate with 95% confidence the average winnings of all contestants who have 10 years of education.
CI = ______________ Enter (n1, n2)
سؤال
سؤال
سؤال
A regression analysis between sales (in $1000) and advertising (in $100) resulted in the following least squares line:  = 77 +8x. This implies that if advertising is $600, then the predicted amount of sales (in dollars) is $125,000.
= 77 +8x. This implies that if advertising is $600, then the predicted amount of sales (in dollars) is $125,000. سؤال
In simple linear regression, if the estimated values  and the corresponding actual values
  are equal, then the standard error of estimate, SE(
  ), must equal -1.0.
and the corresponding actual values are equal, then the standard error of estimate, SE( ), must equal -1.0. سؤال
سؤال
سؤال
A professor of economics wants to study the relationship between income (y in $1000s) and education (x in years). A random sample eight individuals is taken and the results are shown below. 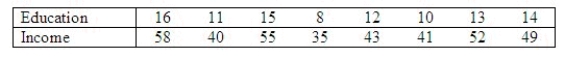 Predict with 95% confidence the income of an individual with 10 years of education.
CI = ______________ Enter (n1, n2) in thousands
Estimate with 95% confidence the average income of all individuals with 10 years of education.
CI = ______________ Enter (n1, n2) in thousands
Which interval in the previous two questions is narrower: the confidence interval estimate of the expected value of y or the prediction interval for the same given value of x (10 years) and same confidence level?
______________
Why?
________________________________________________________
Predict with 95% confidence the income of an individual with 10 years of education.CI = ______________ Enter (n1, n2) in thousands
Estimate with 95% confidence the average income of all individuals with 10 years of education.
CI = ______________ Enter (n1, n2) in thousands
Which interval in the previous two questions is narrower: the confidence interval estimate of the expected value of y or the prediction interval for the same given value of x (10 years) and same confidence level?
______________
Why?
________________________________________________________
سؤال
A regression analysis between weight (y in pounds) and height (x in inches) resulted in the following least squares line:  = 135 + 6x. This implies that if the height is increased by 1 inch, the weight is expected to increase by an average of 6 pounds.
= 135 + 6x. This implies that if the height is increased by 1 inch, the weight is expected to increase by an average of 6 pounds. سؤال
A regression analysis between sales (in $1000) and advertising (in $) resulted in the following least squares line:  = 60 + 5x. This implies that an increase of $1 in advertising is expected to result in an increase of $65 in sales.
= 60 + 5x. This implies that an increase of $1 in advertising is expected to result in an increase of $65 in sales. سؤال
The residuals are observations of the error variable  . Consequently, the minimized sum of squared deviations is called the sum of squares for error, denoted SSE.
. Consequently, the minimized sum of squared deviations is called the sum of squares for error, denoted SSE. سؤال
سؤال
سؤال
سؤال
سؤال
سؤال
سؤال

فتح الحزمة
قم بالتسجيل لفتح البطاقات في هذه المجموعة!
Unlock Deck
Unlock Deck
1/165
العب
ملء الشاشة (f)
Deck 12: Linear Regression and Correlation
1
If there is a negative correlation between the independent variable x and the dependent variable y, then to test this, the appropriate null and alternative hypotheses would be .
.False
2
In regression analysis, a careful study of the differences, , between observed and estimated y values, given x (in order to decide whether crucial assumptions are fulfilled that allow valid inferences about the true regression line to be made from an estimated regression line) is called residual analysis.
, between observed and estimated y values, given x (in order to decide whether crucial assumptions are fulfilled that allow valid inferences about the true regression line to be made from an estimated regression line) is called residual analysis.True
3
Large coefficient of determination value will result in a small standard error of the estimate for the regression model, thus providing prediction intervals that are narrow.
False
4
In developing a 90% confidence interval for the average value of y from a simple linear regression problem involving 12 observations, the appropriate table value would be 1.796.
فتح الحزمة
افتح القفل للوصول البطاقات البالغ عددها 165 في هذه المجموعة.
فتح الحزمة
k this deck
5
If the correlation coefficient for two variables is found to be .094, then the scatterplot will show the data upward sloping from lower left to upper right.
فتح الحزمة
افتح القفل للوصول البطاقات البالغ عددها 165 في هذه المجموعة.
فتح الحزمة
k this deck
6
The regression model = 36.5 + 20.1x has been computed based on a sample of 50 observations. One observation in the sample was (x, y) = (14, 350.9). Given this, the residual value for this observation is 33.
= 36.5 + 20.1x has been computed based on a sample of 50 observations. One observation in the sample was (x, y) = (14, 350.9). Given this, the residual value for this observation is 33. فتح الحزمة
افتح القفل للوصول البطاقات البالغ عددها 165 في هذه المجموعة.
فتح الحزمة
k this deck
7
In simple linear regression, one can use the plot of residuals versus the fitted values of y to check for a constant variance as well as to make sure that the linear model is in fact adequate.
فتح الحزمة
افتح القفل للوصول البطاقات البالغ عددها 165 في هذه المجموعة.
فتح الحزمة
k this deck
8
If the correlation coefficient between two variables is very close to zero, this means that there is no relationship between the two variables.
فتح الحزمة
افتح القفل للوصول البطاقات البالغ عددها 165 في هذه المجموعة.
فتح الحزمة
k this deck
9
Given that n = 37, and the value of sample Spearman rank correlation coefficient = 0.35, the value of the test statistic for testing .
= 0.35, the value of the test statistic for testing . فتح الحزمة
افتح القفل للوصول البطاقات البالغ عددها 165 في هذه المجموعة.
فتح الحزمة
k this deck
10
The normal probability plot is a graph that plots the residuals against the expected value of that residual if it had come from a normal distribution. When the residuals are normally distributed or approximately so, the plot should appear as a straight line, sloping upward at a 45° angle.
فتح الحزمة
افتح القفل للوصول البطاقات البالغ عددها 165 في هذه المجموعة.
فتح الحزمة
k this deck
11
Simple regression analysis is a statistical technique that establishes an index that provides, in a single number, a measure of the strength of association between two variables.
فتح الحزمة
افتح القفل للوصول البطاقات البالغ عددها 165 في هذه المجموعة.
فتح الحزمة
k this deck
12
In simple linear regression analysis, if the correlation coefficient between the independent variable x and the dependent variable y is -.85, this means that the scatterplot generated by the same data values would show points that would fall on a straight line with slope equal to -.85.
فتح الحزمة
افتح القفل للوصول البطاقات البالغ عددها 165 في هذه المجموعة.
فتح الحزمة
k this deck
13
A perfect correlation between two variables will always produce a correlation coefficient of + 1.0.
فتح الحزمة
افتح القفل للوصول البطاقات البالغ عددها 165 في هذه المجموعة.
فتح الحزمة
k this deck
14
In a simple linear regression problem, the least squares line is = 2.73 - 1.02x, and the coefficient of determination is 0.7744. The correlation coefficient must be -0.88.
= 2.73 - 1.02x, and the coefficient of determination is 0.7744. The correlation coefficient must be -0.88. فتح الحزمة
افتح القفل للوصول البطاقات البالغ عددها 165 في هذه المجموعة.
فتح الحزمة
k this deck
15
The prediction interval developed from a simple linear regression model will be very narrow when the value of x used to predict y is equal to the mean value .
. فتح الحزمة
افتح القفل للوصول البطاقات البالغ عددها 165 في هذه المجموعة.
فتح الحزمة
k this deck
16
When regression analysis is used for prediction, the confidence interval for the average y given x will be wider than the prediction interval for a particular value of y given x.
فتح الحزمة
افتح القفل للوصول البطاقات البالغ عددها 165 في هذه المجموعة.
فتح الحزمة
k this deck
17
In regression analysis, a graph of each residual against the corresponding fitted value is called a scatter diagram.
فتح الحزمة
افتح القفل للوصول البطاقات البالغ عددها 165 في هذه المجموعة.
فتح الحزمة
k this deck
18
In a simple linear regression analysis, it was stated that the correlation between starting salary and years of experience is 0.80. This indicates that 80% of the variation in starting salary is explained by years of experience.
فتح الحزمة
افتح القفل للوصول البطاقات البالغ عددها 165 في هذه المجموعة.
فتح الحزمة
k this deck
19
If all the points in a scatterplot lie on the least squares regression line, then the correlation coefficient must be 1.0
فتح الحزمة
افتح القفل للوصول البطاقات البالغ عددها 165 في هذه المجموعة.
فتح الحزمة
k this deck
20
In simple linear regression analysis, if the independent variable x and the dependent variable y are highly correlated, this does not only mean that they are linearly related, but it also means that a change in x will cause a change in y.
فتح الحزمة
افتح القفل للوصول البطاقات البالغ عددها 165 في هذه المجموعة.
فتح الحزمة
k this deck
21
In the simple linear regression model which of the following is true regarding the values of the random error term ?
A) They are independent.
B) They have a mean of 0 and a common variance, independent of x.
C) They are normally distributed.
D) All of these.
E) None of these.
which of the following is true regarding the values of the random error term ?A) They are independent.
B) They have a mean of 0 and a common variance, independent of x.
C) They are normally distributed.
D) All of these.
E) None of these.
فتح الحزمة
افتح القفل للوصول البطاقات البالغ عددها 165 في هذه المجموعة.
فتح الحزمة
k this deck
22
Which of the following statements about simple correlation analysis are correct?
A) When all the points in a scatter diagram lie precisely on the estimated regression line, the sample coefficient of correlation will equal 0.
B) When all the points in a scatter diagram lie precisely on the estimated regression line, the sample coefficient of correlation will show the variables to be perfectly correlated.
C) When all the points in a scatter diagram are so widely scattered as to make x completely worthless as a predictor of y, the sample coefficient of correlation will equal 1.
D) All of these.
E) None of these.
فتح الحزمة
افتح القفل للوصول البطاقات البالغ عددها 165 في هذه المجموعة.
فتح الحزمة
k this deck
23
The confidence interval estimate of the expected value of y will be wider than the prediction interval for the same given value of x and confidence level. This is because there is more error in estimating a mean value as opposed to predicting an individual value.
فتح الحزمة
افتح القفل للوصول البطاقات البالغ عددها 165 في هذه المجموعة.
فتح الحزمة
k this deck
24
The confidence interval estimate of the expected value of y will be narrower than the prediction interval for the same given value of x and confidence level. This is because there is less error in estimating a mean value as opposed to predicting an individual value.
فتح الحزمة
افتح القفل للوصول البطاقات البالغ عددها 165 في هذه المجموعة.
فتح الحزمة
k this deck
25
In developing a 80% prediction interval for the particular value of y from a simple linear regression problem involving a sample of size 12, the appropriate table value would be 1.372.
فتح الحزمة
افتح القفل للوصول البطاقات البالغ عددها 165 في هذه المجموعة.
فتح الحزمة
k this deck
26
The following are coefficients of correlation (r). The one that indicates a strong positive linear relationship between the two variables of interest is:
A) 0.8
B) -0.9
C) 0.9
D) -1.3
E) -1
A) 0.8
B) -0.9
C) 0.9
D) -1.3
E) -1
فتح الحزمة
افتح القفل للوصول البطاقات البالغ عددها 165 في هذه المجموعة.
فتح الحزمة
k this deck
27
Given the least squares regression line = -4.63 + 1.38x, and a coefficient of determination of 0.9025, the correlation coefficient must be:
A) -0.95
B) +0.95
C) +1.38
D) -0.81
E) 0.81
= -4.63 + 1.38x, and a coefficient of determination of 0.9025, the correlation coefficient must be:A) -0.95
B) +0.95
C) +1.38
D) -0.81
E) 0.81
فتح الحزمة
افتح القفل للوصول البطاقات البالغ عددها 165 في هذه المجموعة.
فتح الحزمة
k this deck
28
An indication of no linear relationship between two variables x and y would be:
A) a coefficient of correlation of 1
B) a coefficient of correlation of 0
C) a coefficient of correlation of -1
D) a coefficient of determination of 1
E) 0.5
A) a coefficient of correlation of 1
B) a coefficient of correlation of 0
C) a coefficient of correlation of -1
D) a coefficient of determination of 1
E) 0.5
فتح الحزمة
افتح القفل للوصول البطاقات البالغ عددها 165 في هذه المجموعة.
فتح الحزمة
k this deck
29
In the simple linear regression model which of the following is false regarding the values of the random error term ?
A) They are independent.
B) They have a mean of 0 and a variance of 1, independent of x.
C) They are normally distributed.
D) None of these.
E) All of these.
which of the following is false regarding the values of the random error term ?A) They are independent.
B) They have a mean of 0 and a variance of 1, independent of x.
C) They are normally distributed.
D) None of these.
E) All of these.
فتح الحزمة
افتح القفل للوصول البطاقات البالغ عددها 165 في هذه المجموعة.
فتح الحزمة
k this deck
30
Which of the following statements is false regarding the residuals in simple linear regression model?
A) They sum to 0.
B) They have a mean of 0.
C) They have a standard deviation of 1.
D) None of these.
E) All of these.
A) They sum to 0.
B) They have a mean of 0.
C) They have a standard deviation of 1.
D) None of these.
E) All of these.
فتح الحزمة
افتح القفل للوصول البطاقات البالغ عددها 165 في هذه المجموعة.
فتح الحزمة
k this deck
31
In developing a 90% confidence interval for the expected value of y from a simple linear regression problem involving a sample of size 15, the appropriate table value would be 1.761.
فتح الحزمة
افتح القفل للوصول البطاقات البالغ عددها 165 في هذه المجموعة.
فتح الحزمة
k this deck
32
In developing 90% prediction interval for the particular value of y from a simple linear regression problem involving a sample of size 14, the appropriate table value would be 2.179.
فتح الحزمة
افتح القفل للوصول البطاقات البالغ عددها 165 في هذه المجموعة.
فتح الحزمة
k this deck
33
In simple linear regression, the plot of residuals versus fitted values 3 can be used to check for:
A) normality
B) a constant variance independent of x
C) independence
D) all of these
E) none of these
A) normality
B) a constant variance independent of x
C) independence
D) all of these
E) none of these
فتح الحزمة
افتح القفل للوصول البطاقات البالغ عددها 165 في هذه المجموعة.
فتح الحزمة
k this deck
34
In a simple linear regression problem including n = 10 observations, which of the following table values would be appropriate for a 95% confidence interval estimation for the average value of y?
A) 2.228
B) 2.262
C) 2.306
D) 1.860
E) 18.60
A) 2.228
B) 2.262
C) 2.306
D) 1.860
E) 18.60
فتح الحزمة
افتح القفل للوصول البطاقات البالغ عددها 165 في هذه المجموعة.
فتح الحزمة
k this deck
35
In a regression problem the following pairs of (x, y) are given: (4, 1), (4, -1), (4, 0), (4, -2) and (4, 2). That indicates that:
A) the correlation coefficient is -1
B) the correlation coefficient is 0
C) the correlation coefficient is 1
D) the coefficient of determination is between -2 and 2
E) none of these
A) the correlation coefficient is -1
B) the correlation coefficient is 0
C) the correlation coefficient is 1
D) the coefficient of determination is between -2 and 2
E) none of these
فتح الحزمة
افتح القفل للوصول البطاقات البالغ عددها 165 في هذه المجموعة.
فتح الحزمة
k this deck
36
The following are coefficients of correlation (r). The one that indicates a strong negative linear relationship between the two variables of interest is:
A) 0.8
B) -0.9
C) 0.9
D) -1.3
E) 1
A) 0.8
B) -0.9
C) 0.9
D) -1.3
E) 1
فتح الحزمة
افتح القفل للوصول البطاقات البالغ عددها 165 في هذه المجموعة.
فتح الحزمة
k this deck
37
In developing a 95% confidence interval for the expected value of y from a simple linear regression problem involving a sample of size 10, the appropriate table value would be 1.86.
فتح الحزمة
افتح القفل للوصول البطاقات البالغ عددها 165 في هذه المجموعة.
فتح الحزمة
k this deck
38
In order to predict with 95% confidence a particular value of y for a given value of x in a simple linear regression problem, a random sample of 20 observations is taken. The appropriate table value that would be used is 2.101.
فتح الحزمة
افتح القفل للوصول البطاقات البالغ عددها 165 في هذه المجموعة.
فتح الحزمة
k this deck
39
In publishing the results of some research work, the following values of the correlation coefficient were listed. Which one would appear to be incorrect?
A) 0.95
B) 0.05
C) 0.00
D) 1.05
E) 0.11
A) 0.95
B) 0.05
C) 0.00
D) 1.05
E) 0.11
فتح الحزمة
افتح القفل للوصول البطاقات البالغ عددها 165 في هذه المجموعة.
فتح الحزمة
k this deck
40
In simple linear regression, the plot of residuals versus fitted values should:
A) be free of any patterns
B) appear as a random scatter of points about 0 on the vertical axis
C) approximately have the same vertical spread for all values
D) all of these
E) none of these
should:A) be free of any patterns
B) appear as a random scatter of points about 0 on the vertical axis
C) approximately have the same vertical spread for all values
D) all of these
E) none of these
فتح الحزمة
افتح القفل للوصول البطاقات البالغ عددها 165 في هذه المجموعة.
فتح الحزمة
k this deck
41
A university admissions committee was interested in examining the relationship between a student's score on the SAT exam, x, and the student's grade point average, y, (GPA) at the end the student's freshman year of college. The committee selected a random sample of 25 students and recorded the SAT score and GPA at the end of the freshman year of college for each student. Use the following output that was generated using Minitab to answer the questions below: Determine the correlation between a student's SAT score and GPA at the end of the freshman year.
Since b is ______________ the correlation is ______________.
Interpret the value.
There is a ______________ linear relationship between a student's SAT score and GPA at the end of the freshman year.
Determine the correlation between a student's SAT score and GPA at the end of the freshman year.Since b is ______________ the correlation is ______________.
Interpret the value.
There is a ______________ linear relationship between a student's SAT score and GPA at the end of the freshman year.
فتح الحزمة
افتح القفل للوصول البطاقات البالغ عددها 165 في هذه المجموعة.
فتح الحزمة
k this deck
42
A microwave manufacturer has collected the data shown below on number of units sold (y) in the thousands of dollars and the number of ads (x) placed during the month. Calculate the preliminary sums of squares and cross-products.
Sxx = ______________
Syy = ______________
Sxy = ______________
Calculate:
SSE = ______________
MSE = ______________
Determine the least-squares regression line. = ______________
Compute a point estimate of number of units sold if there are 140 ads.
______________
Compute the standard error of the point estimate of number of units sold if there are 140 ads.
______________
Compute a 95% confidence interval for the average number of units sold in all months with 140 ads.
______________ Enter (n1, n2)
Compute a 95% prediction interval for sales during the next month that happens to be associated with 140 ads.
______________ Enter (n1, n2)
Calculate the preliminary sums of squares and cross-products.Sxx = ______________
Syy = ______________
Sxy = ______________
Calculate:
SSE = ______________
MSE = ______________
Determine the least-squares regression line.
= ______________Compute a point estimate of number of units sold if there are 140 ads.
______________
Compute the standard error of the point estimate of number of units sold if there are 140 ads.
______________
Compute a 95% confidence interval for the average number of units sold in all months with 140 ads.
______________ Enter (n1, n2)
Compute a 95% prediction interval for sales during the next month that happens to be associated with 140 ads.
______________ Enter (n1, n2)
فتح الحزمة
افتح القفل للوصول البطاقات البالغ عددها 165 في هذه المجموعة.
فتح الحزمة
k this deck
43
Six points have these coordinates: The normal probability plot and the residuals versus fitted values plots generated by Minitab are shown below. Does it appear that any regression assumptions have been violated?
______________
Explain.
________________________________________________________
The normal probability plot and the residuals versus fitted values plots generated by Minitab are shown below. Does it appear that any regression assumptions have been violated?______________
Explain.
________________________________________________________
فتح الحزمة
افتح القفل للوصول البطاقات البالغ عددها 165 في هذه المجموعة.
فتح الحزمة
k this deck
44
The manager of an ice cream store is interested in examining the relationship between sales of ice cream (in gallons per day) and maximum temperature of the day. The vendor records the following data for a random sample of five days in the summer, where y is number of gallons of ice cream sold per day and x is maximum temperature, in degrees Fahrenheit, recorded for the day: The following summary information were computed: Find and interpret the correlation between maximum daily temperature and daily sales of ice cream.
Syy = ______________
What is the correlation coefficient?
r = ______________
There is ______________ linear relationship between daily sales of ice cream and maximum daily temperature.
The following summary information were computed: Find and interpret the correlation between maximum daily temperature and daily sales of ice cream.Syy = ______________
What is the correlation coefficient?
r = ______________
There is ______________ linear relationship between daily sales of ice cream and maximum daily temperature.
فتح الحزمة
افتح القفل للوصول البطاقات البالغ عددها 165 في هذه المجموعة.
فتح الحزمة
k this deck
45
If a sample of 25 observations is selected, and the sample correlation coefficient between the variables x and y is r = 0.525, what is the test statistic value for testing
A) About 3.65.
B) About 2.96.
C) About 3.08.
D) About 3.81.
E) About 3.96.
A) About 3.65.
B) About 2.96.
C) About 3.08.
D) About 3.81.
E) About 3.96.
فتح الحزمة
افتح القفل للوصول البطاقات البالغ عددها 165 في هذه المجموعة.
فتح الحزمة
k this deck
46
In order to predict with 98% confidence the expected value of y for a given value of x in a simple linear regression problem, a random sample of 15 observations is taken. Which of the following t-table values listed below would be used?
A) 1.350
B) 1.771
C) 2.160
D) 2.650
E) 1.750
A) 1.350
B) 1.771
C) 2.160
D) 2.650
E) 1.750
فتح الحزمة
افتح القفل للوصول البطاقات البالغ عددها 165 في هذه المجموعة.
فتح الحزمة
k this deck
47
In order to estimate with 95% confidence the expected value of y for a given value of x in a simple linear regression problem, a random sample of 10 observations is taken. Which of the following t-table values listed below would be used?
A) 2.228
B) 2.306
C) 1.860
D) 1.812
E) 2.812
A) 2.228
B) 2.306
C) 1.860
D) 1.812
E) 2.812
فتح الحزمة
افتح القفل للوصول البطاقات البالغ عددها 165 في هذه المجموعة.
فتح الحزمة
k this deck
48
If the true correlation between two variables is zero, then which of the following statements is true?
A) There is no linear relationship between the two variables.
B) There may be no relationship between the two variables.
C) Neither "There is no linear relationship between the two variables" nor "There may be no relationship between the two variables".
D) Both "There is no linear relationship between the two variables" and "There may be no relationship between the two variables".
فتح الحزمة
افتح القفل للوصول البطاقات البالغ عددها 165 في هذه المجموعة.
فتح الحزمة
k this deck
49
Given a specific value of x and confidence level, which of the following statements is correct?
A) The confidence interval estimate of the expected value of y can be calculated but the prediction interval of y for the given value of x cannot be calculated.
B) The confidence interval estimate of the expected value of y will be wider than the prediction interval.
C) The prediction interval of y for the given value of x can be calculated but the confidence interval estimate of the expected value of y cannot be calculated.
D) The confidence interval estimate of the expected value of y will be narrower than the prediction interval.
E) None of these.
فتح الحزمة
افتح القفل للوصول البطاقات البالغ عددها 165 في هذه المجموعة.
فتح الحزمة
k this deck
50
In order to predict with 90% confidence the expected value of y for a given value of x in a simple linear regression problem, a random sample of 10 observations is taken. Which of the following t-table values listed below would be used?
A) 2.228
B) 2.306
C) 1.860
D) 1.812
E) 2.812
A) 2.228
B) 2.306
C) 1.860
D) 1.812
E) 2.812
فتح الحزمة
افتح القفل للوصول البطاقات البالغ عددها 165 في هذه المجموعة.
فتح الحزمة
k this deck
51
The confidence interval estimate of the expected value of y for a given value y x, compared to the prediction interval of y for the same given value of x and confidence level, will be:
A) wider
B) narrower
C) the same
D) impossible to know
A) wider
B) narrower
C) the same
D) impossible to know
فتح الحزمة
افتح القفل للوصول البطاقات البالغ عددها 165 في هذه المجموعة.
فتح الحزمة
k this deck
52
In regression analysis we use the Spearman rank correlation coefficient to measure and test to determine whether a relationship exists between the two variables if:
A) one or both variables may be ordinal
B) both variables are interval but the normality requirement is not met
C) both one or both variables may be ordinal and both variables are interval but the normality requirement is not met
D) neither one or both variables may be ordinal nor both variables are interval but the normality requirement is not met
E) none of these
فتح الحزمة
افتح القفل للوصول البطاقات البالغ عددها 165 في هذه المجموعة.
فتح الحزمة
k this deck
53
In order to predict with 99% confidence the expected value of y for a given value of x in a simple linear regression problem, a random sample of 10 observations is taken. Which of the following t-table values listed below would be used?
A) 1.860
B) 2.306
C) 2.896
D) 3.355
E) 2.355
A) 1.860
B) 2.306
C) 2.896
D) 3.355
E) 2.355
فتح الحزمة
افتح القفل للوصول البطاقات البالغ عددها 165 في هذه المجموعة.
فتح الحزمة
k this deck
54
The width of the confidence interval estimate for the predicted value of y depends on:
A) the standard error of the estimate
B) the value of x for which the prediction is being made
C) the sample size
D) all of these
E) none of these
A) the standard error of the estimate
B) the value of x for which the prediction is being made
C) the sample size
D) all of these
E) none of these
فتح الحزمة
افتح القفل للوصول البطاقات البالغ عددها 165 في هذه المجموعة.
فتح الحزمة
k this deck
55
A company manager is interested in the relationship between x = number of years that an employee has been with the company and y = the employee's annual salary (in thousands of dollars). The following statistical software output is from a regression analysis for predicting y from x for n = 15 data points. Find the correlation coefficient.
r = ______________
There is ______________ linear relationship between x and y.
Find the correlation coefficient.r = ______________
There is ______________ linear relationship between x and y.
فتح الحزمة
افتح القفل للوصول البطاقات البالغ عددها 165 في هذه المجموعة.
فتح الحزمة
k this deck
56
A study of 20 students showed that the correlation between the time spent writing a test and the number of hours studied the night before the test was 0.35. Using a level of significance equal to 0.05, which of the following statements is true?
A) The sample correlation coefficient could be zero since the test statistic does not fall in the rejection region.
B) The null hypothesis that the population mean is equal to zero should not be rejected, and we should conclude that the true correlation coefficient is zero.
C) There is not enough statistical evidence to conclude that the true correlation coefficient is different from zero.
D) The null hypothesis that the population variance is equal to zero should be rejected, and we should conclude that the true correlation coefficient is zero.
E) None of these.
فتح الحزمة
افتح القفل للوصول البطاقات البالغ عددها 165 في هذه المجموعة.
فتح الحزمة
k this deck
57
In studying the relationship between two variables x and y, a scatterplot can be used to detect which of the following?
A) A positive linear relationship.
B) A negative linear relationship.
C) A relationship that is not linear.
D) All of these.
E) None of these.
A) A positive linear relationship.
B) A negative linear relationship.
C) A relationship that is not linear.
D) All of these.
E) None of these.
فتح الحزمة
افتح القفل للوصول البطاقات البالغ عددها 165 في هذه المجموعة.
فتح الحزمة
k this deck
58
If the plot of the residuals is fan shaped, which assumption of regression analysis if violated?
A) Normality.
B) Homoscedasticity.
C) Independence of errors.
D) No assumptions are violated, the graph should resemble a fan.
E) All of these.
A) Normality.
B) Homoscedasticity.
C) Independence of errors.
D) No assumptions are violated, the graph should resemble a fan.
E) All of these.
فتح الحزمة
افتح القفل للوصول البطاقات البالغ عددها 165 في هذه المجموعة.
فتح الحزمة
k this deck
59
The general manager of a chain of furniture stores believes that experience is the most important factor in determining the level of success of a salesperson. To examine this belief she records last month's sales (in $1,000s) and the years of experience of 10 randomly selected salespeople. These data are listed below. Predict with 95% confidence the monthly sales of a salesperson with 10 years of experience.
CI = ______________ Enter (n1, n2) in thousands
Estimate with 95% confidence the average monthly sales of all salespersons with 10 years of experience.
CI = ______________ Enter (n1, n2) in thousands
Which interval in the previous two questions is narrower: the confidence interval estimate of the expected value of y or the prediction interval for the same given value of x (10 years) and same confidence level?
______________
Why?
________________________________________________________
Predict with 95% confidence the monthly sales of a salesperson with 10 years of experience.CI = ______________ Enter (n1, n2) in thousands
Estimate with 95% confidence the average monthly sales of all salespersons with 10 years of experience.
CI = ______________ Enter (n1, n2) in thousands
Which interval in the previous two questions is narrower: the confidence interval estimate of the expected value of y or the prediction interval for the same given value of x (10 years) and same confidence level?
______________
Why?
________________________________________________________
فتح الحزمة
افتح القفل للوصول البطاقات البالغ عددها 165 في هذه المجموعة.
فتح الحزمة
k this deck
60
In order to predict with 80% confidence the expected value of y for a given value of x in a simple linear regression problem, a random sample of 15 observations is taken. Which of the following t-table values listed below would be used?
A) 1.350
B) 1.771
C) 2.160
D) 2.650
E) 2.260
A) 1.350
B) 1.771
C) 2.160
D) 2.650
E) 2.260
فتح الحزمة
افتح القفل للوصول البطاقات البالغ عددها 165 في هذه المجموعة.
فتح الحزمة
k this deck
61
One way to measure the strength of the relationship between the response variable y and the predictor variable x is to calculate the coefficient of determination; that is, the proportion of the total variation in y that is explained by the linear regression of y on x.
فتح الحزمة
افتح القفل للوصول البطاقات البالغ عددها 165 في هذه المجموعة.
فتح الحزمة
k this deck
62
Regression analysis is a statistical method that seeks to establish an equation that allows the unknown value of one variable to be estimated from the known value of one or more other variables.
فتح الحزمة
افتح القفل للوصول البطاقات البالغ عددها 165 في هذه المجموعة.
فتح الحزمة
k this deck
63
An ardent fan of television game shows has observed that, in general, the more educated the contestant, the less money he or she wins. To test her belief she gathers data about the last eight winners of her favorite game show. She records their winnings in dollars and the number of years of education. The results are as follows. Predict with 95% confidence the winnings of a contestant who has 15 years of education.
CI = ______________ Enter (n1, n2)
Predict with 95% confidence the winnings of a contestant who has 10 years of education.
CI = ______________ Enter (n1, n2)
Estimate with 95% confidence the average winnings of all contestants who have 15 years of education.
CI = ______________ Enter (n1, n2)
Estimate with 95% confidence the average winnings of all contestants who have 10 years of education.
CI = ______________ Enter (n1, n2)
Predict with 95% confidence the winnings of a contestant who has 15 years of education.CI = ______________ Enter (n1, n2)
Predict with 95% confidence the winnings of a contestant who has 10 years of education.
CI = ______________ Enter (n1, n2)
Estimate with 95% confidence the average winnings of all contestants who have 15 years of education.
CI = ______________ Enter (n1, n2)
Estimate with 95% confidence the average winnings of all contestants who have 10 years of education.
CI = ______________ Enter (n1, n2)
فتح الحزمة
افتح القفل للوصول البطاقات البالغ عددها 165 في هذه المجموعة.
فتح الحزمة
k this deck
64
The vertical spread of the data points about the regression line is measured by the y-intercept.
فتح الحزمة
افتح القفل للوصول البطاقات البالغ عددها 165 في هذه المجموعة.
فتح الحزمة
k this deck
65
In regression analysis, the independent variable is a variable whose value is known and is being used to explain or predict the value of another variable.
فتح الحزمة
افتح القفل للوصول البطاقات البالغ عددها 165 في هذه المجموعة.
فتح الحزمة
k this deck
66
A regression analysis between sales (in $1000) and advertising (in $100) resulted in the following least squares line: = 77 +8x. This implies that if advertising is $600, then the predicted amount of sales (in dollars) is $125,000.
= 77 +8x. This implies that if advertising is $600, then the predicted amount of sales (in dollars) is $125,000. فتح الحزمة
افتح القفل للوصول البطاقات البالغ عددها 165 في هذه المجموعة.
فتح الحزمة
k this deck
67
In simple linear regression, if the estimated values and the corresponding actual values are equal, then the standard error of estimate, SE( ), must equal -1.0.
and the corresponding actual values are equal, then the standard error of estimate, SE( ), must equal -1.0. فتح الحزمة
افتح القفل للوصول البطاقات البالغ عددها 165 في هذه المجموعة.
فتح الحزمة
k this deck
68
If a least squares regression line has a y-intercept of 6.84 and a slope of 2.16, then when x = 1 the actual value of y must be 9.
فتح الحزمة
افتح القفل للوصول البطاقات البالغ عددها 165 في هذه المجموعة.
فتح الحزمة
k this deck
69
The value of the sum of squares for regression (SSR) can never be larger than 100.
فتح الحزمة
افتح القفل للوصول البطاقات البالغ عددها 165 في هذه المجموعة.
فتح الحزمة
k this deck
70
A professor of economics wants to study the relationship between income (y in $1000s) and education (x in years). A random sample eight individuals is taken and the results are shown below. Predict with 95% confidence the income of an individual with 10 years of education.
CI = ______________ Enter (n1, n2) in thousands
Estimate with 95% confidence the average income of all individuals with 10 years of education.
CI = ______________ Enter (n1, n2) in thousands
Which interval in the previous two questions is narrower: the confidence interval estimate of the expected value of y or the prediction interval for the same given value of x (10 years) and same confidence level?
______________
Why?
________________________________________________________
Predict with 95% confidence the income of an individual with 10 years of education.CI = ______________ Enter (n1, n2) in thousands
Estimate with 95% confidence the average income of all individuals with 10 years of education.
CI = ______________ Enter (n1, n2) in thousands
Which interval in the previous two questions is narrower: the confidence interval estimate of the expected value of y or the prediction interval for the same given value of x (10 years) and same confidence level?
______________
Why?
________________________________________________________
فتح الحزمة
افتح القفل للوصول البطاقات البالغ عددها 165 في هذه المجموعة.
فتح الحزمة
k this deck
71
A regression analysis between weight (y in pounds) and height (x in inches) resulted in the following least squares line: = 135 + 6x. This implies that if the height is increased by 1 inch, the weight is expected to increase by an average of 6 pounds.
= 135 + 6x. This implies that if the height is increased by 1 inch, the weight is expected to increase by an average of 6 pounds. فتح الحزمة
افتح القفل للوصول البطاقات البالغ عددها 165 في هذه المجموعة.
فتح الحزمة
k this deck
72
A regression analysis between sales (in $1000) and advertising (in $) resulted in the following least squares line: = 60 + 5x. This implies that an increase of $1 in advertising is expected to result in an increase of $65 in sales.
= 60 + 5x. This implies that an increase of $1 in advertising is expected to result in an increase of $65 in sales. فتح الحزمة
افتح القفل للوصول البطاقات البالغ عددها 165 في هذه المجموعة.
فتح الحزمة
k this deck
73
The residuals are observations of the error variable . Consequently, the minimized sum of squared deviations is called the sum of squares for error, denoted SSE.
. Consequently, the minimized sum of squared deviations is called the sum of squares for error, denoted SSE. فتح الحزمة
افتح القفل للوصول البطاقات البالغ عددها 165 في هذه المجموعة.
فتح الحزمة
k this deck
74
The value of the sum of squares for error (SSE) can never be larger than the total sum of squares (Total SS).
فتح الحزمة
افتح القفل للوصول البطاقات البالغ عددها 165 في هذه المجموعة.
فتح الحزمة
k this deck
75
Given that the sum of squares for error (SSE) is 52 and the sum of squares for regression (SSR) is 148, then the coefficient of determination is 0.74.
فتح الحزمة
افتح القفل للوصول البطاقات البالغ عددها 165 في هذه المجموعة.
فتح الحزمة
k this deck
76
In a simple linear regression setting, the probabilistic model equation allows for some deviation of the points about the regression line, making it a more practical model.
فتح الحزمة
افتح القفل للوصول البطاقات البالغ عددها 165 في هذه المجموعة.
فتح الحزمة
k this deck
77
The sum of squares for regression (SSR) can never be larger than the sum of squares for error (SSE).
فتح الحزمة
افتح القفل للوصول البطاقات البالغ عددها 165 في هذه المجموعة.
فتح الحزمة
k this deck
78
If the coefficient of determination is 0.982, then the slope of the regression line must be positive.
فتح الحزمة
افتح القفل للوصول البطاقات البالغ عددها 165 في هذه المجموعة.
فتح الحزمة
k this deck
79
The method of least squares requires that the sum of the squared deviations between actual y values in the scatter diagram and y values predicted by the regression line be minimized.
فتح الحزمة
افتح القفل للوصول البطاقات البالغ عددها 165 في هذه المجموعة.
فتح الحزمة
k this deck
80
In a simple linear regression setting, the deterministic model equation determines an exact value of the dependent variable y when the value of the independent variable x is given, since all points must lie exactly on the line.
فتح الحزمة
افتح القفل للوصول البطاقات البالغ عددها 165 في هذه المجموعة.
فتح الحزمة
k this deck
فتح الحزمة
افتح القفل للوصول البطاقات البالغ عددها 165 في هذه المجموعة.


