Deck 2: Describing Data With Numerical Measures
ملء الشاشة (f)
سؤال
سؤال
سؤال
سؤال
سؤال
سؤال
سؤال
The following five-number summary for a sample of size 500 were obtained: Minimum = 250,  and Maximum = 4,950. Based on this information, the distribution of the data seems to be symmetric.
and Maximum = 4,950. Based on this information, the distribution of the data seems to be symmetric. سؤال
سؤال
The following five-number summary for a sample of size 500 were obtained: Minimum = 250,  and Maximum = 4,950. Based on this information, if you were to construct a box and whisker plot, the value corresponding to the upper fence is 10,200.
and Maximum = 4,950. Based on this information, if you were to construct a box and whisker plot, the value corresponding to the upper fence is 10,200. سؤال
سؤال
سؤال
The following five-number summary for a sample of size 500 were obtained: Minimum = 250,  and Maximum = 4,950. Based on this information, if you were to construct a box and whisker plot, the value 215 is considered an outlier.
and Maximum = 4,950. Based on this information, if you were to construct a box and whisker plot, the value 215 is considered an outlier. سؤال
سؤال
سؤال
سؤال
The following five-number summary for a sample of size 500 were obtained: Minimum = 250,  and Maximum = 4,950. Based on this information, if you were to construct a box and whisker plot, the value corresponding to the right - hand edge of the box would be 4,800.
and Maximum = 4,950. Based on this information, if you were to construct a box and whisker plot, the value corresponding to the right - hand edge of the box would be 4,800. سؤال
سؤال
سؤال
سؤال
The sample z-score is a measure of relative standing defined by:  . It measures the distance between an observation and the mean in units of the standard deviation.
. It measures the distance between an observation and the mean in units of the standard deviation. سؤال
سؤال
A sample of 2,500 vehicles in Minnesota showed the following statistics related to the number of accidents per month: 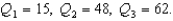 Based on these data, we can infer that the distribution accidents is skewed.
Based on these data, we can infer that the distribution accidents is skewed. سؤال
سؤال
سؤال
سؤال
سؤال
سؤال
سؤال
The following summary statistics were computed from a sample of size 250: 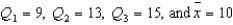 . Based on this information, which of the following statements is correct?
A) The distribution of the data is slightly right-skewed.
B) The distribution of the data is symmetric.
C) A data value of 20 is an outlier.
D) None of these.
E) All of these.
. Based on this information, which of the following statements is correct?A) The distribution of the data is slightly right-skewed.
B) The distribution of the data is symmetric.
C) A data value of 20 is an outlier.
D) None of these.
E) All of these.
سؤال
سؤال
سؤال
سؤال
A sample of 600 values produced the following summary statistics:  Based on this information, the lower fence on a box and whisker plot is:
A) 26.80
B) -4.60
C) 75.80
D) 102.60
E) 56.8
Based on this information, the lower fence on a box and whisker plot is:A) 26.80
B) -4.60
C) 75.80
D) 102.60
E) 56.8
سؤال
سؤال
A sample of 50 values produced the following summary statistics:  Based on this information, the left and right ends of the box in a box and whisker plot are, respectively,
A) 10 and 14.6
B) 14.6 and 16.7
C) 10 and 16.7
D) 5.3 and 32.0
E) none of these
Based on this information, the left and right ends of the box in a box and whisker plot are, respectively,A) 10 and 14.6
B) 14.6 and 16.7
C) 10 and 16.7
D) 5.3 and 32.0
E) none of these
سؤال
سؤال
سؤال
سؤال
A sample of 600 values produced the following summary statistics:  Based on this information, upper fence on a box and whisker plot is:
A) 26.80
B) -4.60
C) 75.80
D) 102.60
E) 62.4
Based on this information, upper fence on a box and whisker plot is:A) 26.80
B) -4.60
C) 75.80
D) 102.60
E) 62.4
سؤال
سؤال
سؤال
سؤال
Tchebysheff's Theorem states that: Given a number k greater than or equal to 1, and a set of measurements, at least (  ) of the measurements in the data set will lie within k standard deviations of their mean.
) of the measurements in the data set will lie within k standard deviations of their mean. سؤال
Tchebysheff's Theorem gives a lower bound to the fraction of measurements to be found in an interval constructed as  .
.
. سؤال
سؤال
سؤال
سؤال
Twenty-eight applicants interested in working for the Food Stamp program took an examination designed to measure their aptitude for social work. A stem-and-leaf plot of the 28 scores appears below, where the first column is the count per branch, the second column is the stem value, and the remaining digits are the leaves. 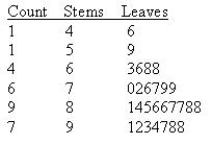 What is the value of the first quartile?
Q1 = ______________
What is the value of the third quartile?
Q3 = ______________
What is the interquartile range?
IQR = ______________
Find the inner fences.
______________
Find the outer fences.
______________
Construct a boxplot for this data.
Does the boxplot indicate the presence of any outliers?
______________
What is the value of the first quartile?Q1 = ______________
What is the value of the third quartile?
Q3 = ______________
What is the interquartile range?
IQR = ______________
Find the inner fences.
______________
Find the outer fences.
______________
Construct a boxplot for this data.
Does the boxplot indicate the presence of any outliers?
______________
سؤال
سؤال
سؤال
سؤال
سؤال
سؤال
سؤال
سؤال
The Empirical Rule states that: Given a distribution of measurements that is approximately bell-shaped (mound-shaped), the interval  contains approximately 68% of the measurements, the interval
  contains approximately 95% of the measurements, and the interval
  contains all or almost all of the measurements.
contains approximately 68% of the measurements, the interval contains approximately 95% of the measurements, and the interval contains all or almost all of the measurements. سؤال
سؤال
سؤال
سؤال
سؤال
سؤال
سؤال
سؤال
سؤال
سؤال
سؤال
The expression 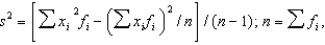 is recognizable as the formula for:
A) the sample variance, computed from ungrouped data
B) the population variance, computed from ungrouped data
C) the sample variance, computed from grouped data
D) the population variance, computed from grouped data
E) the population variance, computed from ungrouped or grouped data
is recognizable as the formula for:A) the sample variance, computed from ungrouped data
B) the population variance, computed from ungrouped data
C) the sample variance, computed from grouped data
D) the population variance, computed from grouped data
E) the population variance, computed from ungrouped or grouped data
سؤال
Thirty-three students were asked to rate themselves on whether they were outgoing or not using this five point scale: 1 = extremely extroverted, 2 = extroverted, 3 = neither extroverted nor introverted, 4 = introverted, or 5 = extremely introverted. The results are shown in the table below: 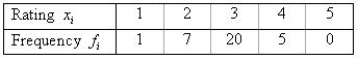
a. Find the percentage of measurements in the following intervals:
 = ______________
 = ______________
This interval contains approximately ______________% of the data.
 = ______________
 = ______________
This interval contains approximately ______________% of the data.
b. Comment on the shape of the distribution.
____________________________
a. Find the percentage of measurements in the following intervals:
= ______________ = ______________This interval contains approximately ______________% of the data.
= ______________ = ______________This interval contains approximately ______________% of the data.
b. Comment on the shape of the distribution.
____________________________
سؤال
According to Tchebysheff's Theorem, provided only  , regardless of the shape of a population's frequency distribution. The proportion of observations falling within k standard deviations of the mean is:
A) at most 1 -
B) at least 1 -
C) at most 1 -
D) at least 1 -
E) exactly 1 -
, regardless of the shape of a population's frequency distribution. The proportion of observations falling within k standard deviations of the mean is:A) at most 1 -
B) at least 1 -
C) at most 1 -
D) at least 1 -
E) exactly 1 -
سؤال
Given the following frequency table: 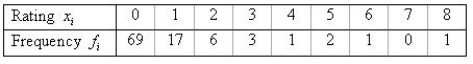
a. What fraction of the x values fall within two standard deviations of the mean?
______________
Within three standard deviations of the mean?
______________
b. Do the results of part (a) agree with Tchebysheff 's Theorem?
______________
c. Do the results of part (a) agree with the Empirical Rule?
______________
سؤال
سؤال
سؤال
سؤال
سؤال
سؤال
سؤال
سؤال
The expression  , where
  is recognizable as the formula for:
A) the population mean, computed from ungrouped data
B) the sample mean, computed from ungrouped data
C) the population mean, computed from grouped data
D) the sample mean, computed from grouped data
E) none of these
, where is recognizable as the formula for:A) the population mean, computed from ungrouped data
B) the sample mean, computed from ungrouped data
C) the population mean, computed from grouped data
D) the sample mean, computed from grouped data
E) none of these
سؤال
سؤال
Twenty-eight applicants interested in working for the Food Stamp program took an examination designed to measure their aptitude for social work. A stem-and-leaf plot of the 28 scores appears below, where the first column is the count per "branch," the second column is the stem value, and the remaining digits are the leaves. 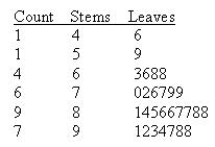
a. Should the Empirical Rule be applied to this data set?
______________
b. Use the range approximation to determine an approximate value for the standard deviation.
______________
Is this a good approximation?
______________
a. Should the Empirical Rule be applied to this data set?
______________
b. Use the range approximation to determine an approximate value for the standard deviation.
______________
Is this a good approximation?
______________

فتح الحزمة
قم بالتسجيل لفتح البطاقات في هذه المجموعة!
Unlock Deck
Unlock Deck
1/186
العب
ملء الشاشة (f)
Deck 2: Describing Data With Numerical Measures
1
Any unusually large observation (as measured by a z-score greater than 3), or any unusually small observation (as measured by a z-score smaller than -3) is considered an outlier.
True
2
If the mean value of a set of data is 83.5 and the median is 72.8, then the third quartile will be at least 83.5.
False
3
Assume that 75% of the households in Michigan have incomes of $24,375 or below. Given this information, it is certain that the mean household income is less than $24,375.
False
4
The left and right ends of the box in a box and whisker plot represent the 25th and 75th percentiles, respectively.
فتح الحزمة
افتح القفل للوصول البطاقات البالغ عددها 186 في هذه المجموعة.
فتح الحزمة
k this deck
5
The standard deviation is a measure of relative standing.
فتح الحزمة
افتح القفل للوصول البطاقات البالغ عددها 186 في هذه المجموعة.
فتح الحزمة
k this deck
6
Expressed in percentiles, the upper quartile is the 75th percentile.
فتح الحزمة
افتح القفل للوصول البطاقات البالغ عددها 186 في هذه المجموعة.
فتح الحزمة
k this deck
7
The following five-number summary for a sample of size 500 were obtained: Minimum = 250, and Maximum = 4,950. Based on this information, the distribution of the data seems to be symmetric.
and Maximum = 4,950. Based on this information, the distribution of the data seems to be symmetric. فتح الحزمة
افتح القفل للوصول البطاقات البالغ عددها 186 في هذه المجموعة.
فتح الحزمة
k this deck
8
The interquartile range is the difference between the lower and upper quartiles.
فتح الحزمة
افتح القفل للوصول البطاقات البالغ عددها 186 في هذه المجموعة.
فتح الحزمة
k this deck
9
The following five-number summary for a sample of size 500 were obtained: Minimum = 250, and Maximum = 4,950. Based on this information, if you were to construct a box and whisker plot, the value corresponding to the upper fence is 10,200.
and Maximum = 4,950. Based on this information, if you were to construct a box and whisker plot, the value corresponding to the upper fence is 10,200. فتح الحزمة
افتح القفل للوصول البطاقات البالغ عددها 186 في هذه المجموعة.
فتح الحزمة
k this deck
10
The distribution of a set of data is considered to be symmetric if the first quartile and the 25th percentile are equal.
فتح الحزمة
افتح القفل للوصول البطاقات البالغ عددها 186 في هذه المجموعة.
فتح الحزمة
k this deck
11
The 10th percentile of a set of measurements is the value which exceeds 90% of the measurements and is less than the remaining 10% of the measurements.
فتح الحزمة
افتح القفل للوصول البطاقات البالغ عددها 186 في هذه المجموعة.
فتح الحزمة
k this deck
12
The following five-number summary for a sample of size 500 were obtained: Minimum = 250, and Maximum = 4,950. Based on this information, if you were to construct a box and whisker plot, the value 215 is considered an outlier.
and Maximum = 4,950. Based on this information, if you were to construct a box and whisker plot, the value 215 is considered an outlier. فتح الحزمة
افتح القفل للوصول البطاقات البالغ عددها 186 في هذه المجموعة.
فتح الحزمة
k this deck
13
z-scores exceeding 3 in absolute value are likely to occur.
فتح الحزمة
افتح القفل للوصول البطاقات البالغ عددها 186 في هذه المجموعة.
فتح الحزمة
k this deck
14
The median equals the second quartile.
فتح الحزمة
افتح القفل للوصول البطاقات البالغ عددها 186 في هذه المجموعة.
فتح الحزمة
k this deck
15
Measures of relative standing indicate the position of one observation relative to other observations in a set of data.
فتح الحزمة
افتح القفل للوصول البطاقات البالغ عددها 186 في هذه المجموعة.
فتح الحزمة
k this deck
16
The following five-number summary for a sample of size 500 were obtained: Minimum = 250, and Maximum = 4,950. Based on this information, if you were to construct a box and whisker plot, the value corresponding to the right - hand edge of the box would be 4,800.
and Maximum = 4,950. Based on this information, if you were to construct a box and whisker plot, the value corresponding to the right - hand edge of the box would be 4,800. فتح الحزمة
افتح القفل للوصول البطاقات البالغ عددها 186 في هذه المجموعة.
فتح الحزمة
k this deck
17
If a set of data has 120 values, the value of the 30th percentile will be calculated using the 36th and 37th values in the data, when the data values have been arranged in ascending order.
فتح الحزمة
افتح القفل للوصول البطاقات البالغ عددها 186 في هذه المجموعة.
فتح الحزمة
k this deck
18
The difference between the largest and smallest values in an ordered array is called the interquartile range.
فتح الحزمة
افتح القفل للوصول البطاقات البالغ عددها 186 في هذه المجموعة.
فتح الحزمة
k this deck
19
Quartiles divide the values in a data set into four parts of equal size.
فتح الحزمة
افتح القفل للوصول البطاقات البالغ عددها 186 في هذه المجموعة.
فتح الحزمة
k this deck
20
The sample z-score is a measure of relative standing defined by: . It measures the distance between an observation and the mean in units of the standard deviation.
. It measures the distance between an observation and the mean in units of the standard deviation. فتح الحزمة
افتح القفل للوصول البطاقات البالغ عددها 186 في هذه المجموعة.
فتح الحزمة
k this deck
21
A graphical device that highlights the highest and lowest values in a data set, along with a number of other key observations in an ordered array of the data, such as the upper quartile, the middle value (or median), and the lower quartile, is called:
A) a boxplot
B) a five-number summary
C) a dotplot
D) a stem-and-leaf plot
E) a histogram
A) a boxplot
B) a five-number summary
C) a dotplot
D) a stem-and-leaf plot
E) a histogram
فتح الحزمة
افتح القفل للوصول البطاقات البالغ عددها 186 في هذه المجموعة.
فتح الحزمة
k this deck
22
A sample of 2,500 vehicles in Minnesota showed the following statistics related to the number of accidents per month: Based on these data, we can infer that the distribution accidents is skewed.
Based on these data, we can infer that the distribution accidents is skewed. فتح الحزمة
افتح القفل للوصول البطاقات البالغ عددها 186 في هذه المجموعة.
فتح الحزمة
k this deck
23
Attendance at London Symphony concerts for the past two years showed an average of 3,000 people per performance with a standard deviation of 100 people per performance. Attendance at a randomly selected concert was found to be 3,290. If attendance data is mound-shaped, does the attendance at the selected concert appear to be unusual?
__________
Justify your conclusion.
________________________________________________________
__________
Justify your conclusion.
________________________________________________________
فتح الحزمة
افتح القفل للوصول البطاقات البالغ عددها 186 في هذه المجموعة.
فتح الحزمة
k this deck
24
If a data set has 15 values that have been sorted in ascending order, which value in the data set will be the 25th percentile?
A) the fourth value
B) the third value
C) the second value
D) the first value
E) There is not enough information to answer this question.
A) the fourth value
B) the third value
C) the second value
D) the first value
E) There is not enough information to answer this question.
فتح الحزمة
افتح القفل للوصول البطاقات البالغ عددها 186 في هذه المجموعة.
فتح الحزمة
k this deck
25
A student took a chemistry exam where the exam scores were mound-shaped with a mean score of 90 and a standard deviation of 64. She also took a statistics exam where the scores were mound-shaped, the mean score was 70 and the standard deviation was 16. If the student's grades were 102 on the chemistry exam and 77 on the statistics exam, then:
A) the student did relatively better on the chemistry exam than on the statistics exam, compared to the other students in each class.
B) the student did relatively better on the statistics exam than on the chemistry exam, compared to the other students in the two classes.
C) the student's scores on both exams are comparable, when accounting for the scores of the other students in the two classes.
D) it is impossible to say which of the student's exam scores indicates the better performance.
E) the student did relatively the same on both exams.
فتح الحزمة
افتح القفل للوصول البطاقات البالغ عددها 186 في هذه المجموعة.
فتح الحزمة
k this deck
26
Which of the following summary measures is affected most by outliers?
A) the first quartile
B) the second quartile
C) the third quartile
D) the fourth quartile
E) none of these
A) the first quartile
B) the second quartile
C) the third quartile
D) the fourth quartile
E) none of these
فتح الحزمة
افتح القفل للوصول البطاقات البالغ عددها 186 في هذه المجموعة.
فتح الحزمة
k this deck
27
Which one of the values below represents a lower quartile for the data set 23, 24, 21, and 20?
A) 22.0
B) 22.5
C) 20.25
D) 23.5
E) none of these
A) 22.0
B) 22.5
C) 20.25
D) 23.5
E) none of these
فتح الحزمة
افتح القفل للوصول البطاقات البالغ عددها 186 في هذه المجموعة.
فتح الحزمة
k this deck
28
Which one of the values below represents the upper quartile of the data set 10, 12, 16, 7, 9, 7, 41, and 14?
A) 8
B) 15.5
C) 7
D) 24
E) 10
A) 8
B) 15.5
C) 7
D) 24
E) 10
فتح الحزمة
افتح القفل للوصول البطاقات البالغ عددها 186 في هذه المجموعة.
فتح الحزمة
k this deck
29
The following summary statistics were computed from a sample of size 250: . Based on this information, which of the following statements is correct?
A) The distribution of the data is slightly right-skewed.
B) The distribution of the data is symmetric.
C) A data value of 20 is an outlier.
D) None of these.
E) All of these.
. Based on this information, which of the following statements is correct?A) The distribution of the data is slightly right-skewed.
B) The distribution of the data is symmetric.
C) A data value of 20 is an outlier.
D) None of these.
E) All of these.
فتح الحزمة
افتح القفل للوصول البطاقات البالغ عددها 186 في هذه المجموعة.
فتح الحزمة
k this deck
30
If the distribution of sales is thought to be symmetric with very little variation, then:
A) the whiskers on a box and whisker plot should be about half as long as the box is wide
B) the width of the box in a box and whisker plot will be very wide but the whisker will be very short
C) the left and right edges of the box in a box and whisker plot will be approximately equal distance from the second quartile
D) none of these
E) all of these
فتح الحزمة
افتح القفل للوصول البطاقات البالغ عددها 186 في هذه المجموعة.
فتح الحزمة
k this deck
31
An exam is given to both the fourth period class and the sixth period class. If a student's score is at the 30th percentile in the fourth period class but at the 60th percentile in the sixth period class, which one of the following statements is true?
A) Students in the sixth period class generally performed better on the exam than the students in the fourth period class.
B) A person whose score is at the 15th percentile in the fourth period class will have a score at the 30th percentile in the sixth period class.
C) A person whose score is at the 70th percentile in the sixth period class will have a score at the 40th percentile in the fourth period class.
D) Students in the fourth period class generally performed better on the exam than students in the sixth period class.
E) None of these.
فتح الحزمة
افتح القفل للوصول البطاقات البالغ عددها 186 في هذه المجموعة.
فتح الحزمة
k this deck
32
Consider the following set of measurements: 6, 3, 5, 14, 2, 6, 0, and 8.
a. Find the 25th percentile:
______________,
Find the 50th percentile:
______________,
Find the 75th percentile:
______________.
b. What is the value of the interquartile range?
______________
a. Find the 25th percentile:
______________,
Find the 50th percentile:
______________,
Find the 75th percentile:
______________.
b. What is the value of the interquartile range?
______________
فتح الحزمة
افتح القفل للوصول البطاقات البالغ عددها 186 في هذه المجموعة.
فتح الحزمة
k this deck
33
A sample of 600 values produced the following summary statistics: Based on this information, the lower fence on a box and whisker plot is:
A) 26.80
B) -4.60
C) 75.80
D) 102.60
E) 56.8
Based on this information, the lower fence on a box and whisker plot is:A) 26.80
B) -4.60
C) 75.80
D) 102.60
E) 56.8
فتح الحزمة
افتح القفل للوصول البطاقات البالغ عددها 186 في هذه المجموعة.
فتح الحزمة
k this deck
34
Expressed in percentiles, the interquartile range is the difference between the:
A) 20% and 80% values
B) 45% and 95% values
C) 25% and 75% values
D) 20% and 70% values
E) 10% and 90% values
A) 20% and 80% values
B) 45% and 95% values
C) 25% and 75% values
D) 20% and 70% values
E) 10% and 90% values
فتح الحزمة
افتح القفل للوصول البطاقات البالغ عددها 186 في هذه المجموعة.
فتح الحزمة
k this deck
35
A sample of 50 values produced the following summary statistics: Based on this information, the left and right ends of the box in a box and whisker plot are, respectively,
A) 10 and 14.6
B) 14.6 and 16.7
C) 10 and 16.7
D) 5.3 and 32.0
E) none of these
Based on this information, the left and right ends of the box in a box and whisker plot are, respectively,A) 10 and 14.6
B) 14.6 and 16.7
C) 10 and 16.7
D) 5.3 and 32.0
E) none of these
فتح الحزمة
افتح القفل للوصول البطاقات البالغ عددها 186 في هذه المجموعة.
فتح الحزمة
k this deck
36
The percentage of all observations in a data set that lies between the 30th percentile and the third quartile:
A) equals 30
B) equals 45
C) equals 75
D) equals 85
E) cannot be determined without additional information
A) equals 30
B) equals 45
C) equals 75
D) equals 85
E) cannot be determined without additional information
فتح الحزمة
افتح القفل للوصول البطاقات البالغ عددها 186 في هذه المجموعة.
فتح الحزمة
k this deck
37
Which of the following randomly selected measurements, x, might be considered a potential outlier (i.e., an unusual measurement) if it was selected from the given population?
A) x = 0 from a population with= 0 and= 2
B) x = -5 from a population with= 1 and= 4
C) x = 7 from a population with= 3 and= 2
D) x = 4 from a population with= 0 and= 1
E) x = 1 from a population with= 0 and= 2
A) x = 0 from a population with= 0 and= 2
B) x = -5 from a population with= 1 and= 4
C) x = 7 from a population with= 3 and= 2
D) x = 4 from a population with= 0 and= 1
E) x = 1 from a population with= 0 and= 2
فتح الحزمة
افتح القفل للوصول البطاقات البالغ عددها 186 في هذه المجموعة.
فتح الحزمة
k this deck
38
The following data represent the number of small cracks per bar for a sample of eight steel bars:
4 6 10 1 3 1 25 8
Which, if any, of the observations appear to be outliers? Justify your answer.
____________________________
4 6 10 1 3 1 25 8
Which, if any, of the observations appear to be outliers? Justify your answer.
____________________________
فتح الحزمة
افتح القفل للوصول البطاقات البالغ عددها 186 في هذه المجموعة.
فتح الحزمة
k this deck
39
A sample of 600 values produced the following summary statistics: Based on this information, upper fence on a box and whisker plot is:
A) 26.80
B) -4.60
C) 75.80
D) 102.60
E) 62.4
Based on this information, upper fence on a box and whisker plot is:A) 26.80
B) -4.60
C) 75.80
D) 102.60
E) 62.4
فتح الحزمة
افتح القفل للوصول البطاقات البالغ عددها 186 في هذه المجموعة.
فتح الحزمة
k this deck
40
Lily recently took a biochemistry test, and it was reported back to her that her score placed her at the 97th percentile. Therefore:
A) Lily's score has a z-score of 0.97
B) Lily was in the bottom 3% of the students who took the test
C) Lily scored as high or higher than 97% of the students who took the test
D) ninety-seven students who took the test scored below Lily
E) ninety-seven students who took the test scored the same as Lily
فتح الحزمة
افتح القفل للوصول البطاقات البالغ عددها 186 في هذه المجموعة.
فتح الحزمة
k this deck
41
Since Tchebysheff's Theorem applies to any distribution, it is very conservative.
فتح الحزمة
افتح القفل للوصول البطاقات البالغ عددها 186 في هذه المجموعة.
فتح الحزمة
k this deck
42
If the 90th and 91st observations in a set of 100 data values are 158 and 167, respectively, then the 90th percentile value is:
______________
______________
فتح الحزمة
افتح القفل للوصول البطاقات البالغ عددها 186 في هذه المجموعة.
فتح الحزمة
k this deck
43
Tchebysheff's Theorem states that: Given a number k greater than or equal to 1, and a set of measurements, at least ( ) of the measurements in the data set will lie within k standard deviations of their mean.
) of the measurements in the data set will lie within k standard deviations of their mean. فتح الحزمة
افتح القفل للوصول البطاقات البالغ عددها 186 في هذه المجموعة.
فتح الحزمة
k this deck
44
Tchebysheff's Theorem gives a lower bound to the fraction of measurements to be found in an interval constructed as .
. فتح الحزمة
افتح القفل للوصول البطاقات البالغ عددها 186 في هذه المجموعة.
فتح الحزمة
k this deck
45
The Empirical Rule can be applied to any numerical data set.
فتح الحزمة
افتح القفل للوصول البطاقات البالغ عددها 186 في هذه المجموعة.
فتح الحزمة
k this deck
46
While Tchebysheff's Theorem applies to any distribution, regardless of shape, the empirical rule applies only to distributions that are mound-shaped.
فتح الحزمة
افتح القفل للوصول البطاقات البالغ عددها 186 في هذه المجموعة.
فتح الحزمة
k this deck
47
The Empirical Rule and Tchebysheff's Theorem can be used to describe data sets.
فتح الحزمة
افتح القفل للوصول البطاقات البالغ عددها 186 في هذه المجموعة.
فتح الحزمة
k this deck
48
Twenty-eight applicants interested in working for the Food Stamp program took an examination designed to measure their aptitude for social work. A stem-and-leaf plot of the 28 scores appears below, where the first column is the count per branch, the second column is the stem value, and the remaining digits are the leaves. What is the value of the first quartile?
Q1 = ______________
What is the value of the third quartile?
Q3 = ______________
What is the interquartile range?
IQR = ______________
Find the inner fences.
______________
Find the outer fences.
______________
Construct a boxplot for this data.
Does the boxplot indicate the presence of any outliers?
______________
What is the value of the first quartile?Q1 = ______________
What is the value of the third quartile?
Q3 = ______________
What is the interquartile range?
IQR = ______________
Find the inner fences.
______________
Find the outer fences.
______________
Construct a boxplot for this data.
Does the boxplot indicate the presence of any outliers?
______________
فتح الحزمة
افتح القفل للوصول البطاقات البالغ عددها 186 في هذه المجموعة.
فتح الحزمة
k this deck
49
The following data represent the number of calories in 12 ounce cans of eight popular soft drinks:
124 144 147 146 148 154 150 234
Find the inner fences.
______________
Find the outer fences.
______________
Construct a boxplot for this data.
Does the boxplot indicate the presence of any outliers?
______________
124 144 147 146 148 154 150 234
Find the inner fences.
______________
Find the outer fences.
______________
Construct a boxplot for this data.
Does the boxplot indicate the presence of any outliers?
______________
فتح الحزمة
افتح القفل للوصول البطاقات البالغ عددها 186 في هذه المجموعة.
فتح الحزمة
k this deck
50
If the 18th and 19th observations in a set of 25 data values are 42.6 and 43.8, then the 70th percentile value is:
______________
______________
فتح الحزمة
افتح القفل للوصول البطاقات البالغ عددها 186 في هذه المجموعة.
فتح الحزمة
k this deck
51
The distribution of checking account balances for customers at Independent Bank is known to be bell - shaped with a mean of $1,800 and a standard deviation of $300. Given this information, the percentage of accounts with balances between $1,500 and $2,100 will be approximately 95%.
فتح الحزمة
افتح القفل للوصول البطاقات البالغ عددها 186 في هذه المجموعة.
فتح الحزمة
k this deck
52
The mean of forty sales receipts is $69.75 and the standard deviation is $10.25. Using Tchebysheff's Theorem, at least 75% of the sales receipts were between $49.25 and $90.25.
فتح الحزمة
افتح القفل للوصول البطاقات البالغ عددها 186 في هذه المجموعة.
فتح الحزمة
k this deck
53
Tchebysheff's Theorem applies only to data sets that have a mound-shaped distribution.
فتح الحزمة
افتح القفل للوصول البطاقات البالغ عددها 186 في هذه المجموعة.
فتح الحزمة
k this deck
54
The following data represent the scores for a sample of 10 students on a 20-point chemistry quiz:
16 14 2 8 12 12 9 10 15 13
Calculate the z score for the smallest and largest observations.
Smallest: ______________
Largest: ______________
Is either of these observations unusually large or unusually small?
______________
16 14 2 8 12 12 9 10 15 13
Calculate the z score for the smallest and largest observations.
Smallest: ______________
Largest: ______________
Is either of these observations unusually large or unusually small?
______________
فتح الحزمة
افتح القفل للوصول البطاقات البالغ عددها 186 في هذه المجموعة.
فتح الحزمة
k this deck
55
Two students are enrolled in different sections of an introductory statistics class at a local university. The first student, enrolled in the morning section, earns a score of 76 on a midterm exam where the class mean was 64 with a standard deviation of 8. The second student, enrolled in the afternoon section, earns a score of 72 on a midterm exam where the class mean was 60 with a standard deviation of 7.5. If the scores on the midterm exams are normally distributed, which student scored better relative to his or her classmates?
____________________________
Explain.
________________________________________________________
____________________________
Explain.
________________________________________________________
فتح الحزمة
افتح القفل للوصول البطاقات البالغ عددها 186 في هذه المجموعة.
فتح الحزمة
k this deck
56
The Empirical Rule states that: Given a distribution of measurements that is approximately bell-shaped (mound-shaped), the interval contains approximately 68% of the measurements, the interval contains approximately 95% of the measurements, and the interval contains all or almost all of the measurements.
contains approximately 68% of the measurements, the interval contains approximately 95% of the measurements, and the interval contains all or almost all of the measurements. فتح الحزمة
افتح القفل للوصول البطاقات البالغ عددها 186 في هذه المجموعة.
فتح الحزمة
k this deck
57
For larger sample sizes, a rough approximation for the sample standard deviation s is that s R / 4, where R is the range.
فتح الحزمة
افتح القفل للوصول البطاقات البالغ عددها 186 في هذه المجموعة.
فتح الحزمة
k this deck
58
Consider the following set of measurements:
5.4, 5.9, 3.5, 4.1, 4.6, 2.5, 4.7, 6.0,
5.4, 4.6, 4.9, 4.6, 4.1, 3.4, 2.2
You may use the Data Analysis tool if you want.
a. Find the 25th percentile:
______________,
Find the 50th percentile:
______________,
Find the 75th percentile:
______________.
b. What is the value of the interquartile range?
______________
فتح الحزمة
افتح القفل للوصول البطاقات البالغ عددها 186 في هذه المجموعة.
فتح الحزمة
k this deck
59
Tchebysheff's Theorem provides us with a measure of shape that focuses on the difference between the mode and the mean and then relates it to the standard deviation.
فتح الحزمة
افتح القفل للوصول البطاقات البالغ عددها 186 في هذه المجموعة.
فتح الحزمة
k this deck
60
According to Tchebysheff's Theorem, at least 96% of observations should fall within 5 standard deviations of the mean.
فتح الحزمة
افتح القفل للوصول البطاقات البالغ عددها 186 في هذه المجموعة.
فتح الحزمة
k this deck
61
Given a distribution of measurements that is approximately mound-shaped, the Empirical Rule states that the approximate percentage of measurements in a data set that fall within two standard deviations of their mean is approximately:
A) 99%
B) 95%
C) 90%
D) 68%
E) 75%
A) 99%
B) 95%
C) 90%
D) 68%
E) 75%
فتح الحزمة
افتح القفل للوصول البطاقات البالغ عددها 186 في هذه المجموعة.
فتح الحزمة
k this deck
62
The following data represents the number of minutes an athlete spends training per day.
73 74 76 77 79 79 83 84 88 84 84 85 86
86 87 87 88 91 92 92 93 97 98 98 81 82
The mean and standard deviation were computed to be 85.54 and 6.97, respectively.
a. What percentage of measurements would you expect to be between 71.60 and 99.48?
______________
b. What percentage of the measurements lies in the interval (71.60, 99.48)?
______________
فتح الحزمة
افتح القفل للوصول البطاقات البالغ عددها 186 في هذه المجموعة.
فتح الحزمة
k this deck
63
A college placement office conducted a survey of 100 engineers who had graduated from Stanford University. For these engineers, the mean salary was computed to be $72,000 with a standard deviation of $8,000. The percentage of these engineers who earn more than $96,000 or less than $48,000 is:
A) approximately 0%
B) at least 5.6% (1/18 of the engineers)
C) at most 5.6% (1/18 of the engineers)
D) at most 11.1% (1/9 of the engineers)
E) at least 11.1% (1/9 of the engineers)
A) approximately 0%
B) at least 5.6% (1/18 of the engineers)
C) at most 5.6% (1/18 of the engineers)
D) at most 11.1% (1/9 of the engineers)
E) at least 11.1% (1/9 of the engineers)
فتح الحزمة
افتح القفل للوصول البطاقات البالغ عددها 186 في هذه المجموعة.
فتح الحزمة
k this deck
64
From a sample of size 100, the following descriptive measures were calculated: median = 23, mean = 20, standard deviation = 5, range = 35; seventy-five sample values are between 10 and 30; and ninety-nine sample values are between 5 and 35. If you knew the sample mean, median, and standard deviation were correct, which one of the following conclusions might you draw?
A) The distribution is skewed to the right because the median exceeds the mean.
B) The range must have been calculated incorrectly because it should not be seven times the standard deviation's value.
C) The number of sample values between 10 and 30 was miscounted.
D) The number of sample values between 5 and 35 must have been miscounted because all 100 values must be in this interval.
E) All of these.
فتح الحزمة
افتح القفل للوصول البطاقات البالغ عددها 186 في هذه المجموعة.
فتح الحزمة
k this deck
65
Whenever a statistical population can be described, at least roughly, by the perfectly symmetrical, bell-shaped normal curve, we can estimate the percentages of all population values that lie within specified numbers of standard deviations from the mean with the help of:
A) Tchebysheff's Theorem
B) the empirical rule
C) the interquartile range
D) box plot
E) none of these
A) Tchebysheff's Theorem
B) the empirical rule
C) the interquartile range
D) box plot
E) none of these
فتح الحزمة
افتح القفل للوصول البطاقات البالغ عددها 186 في هذه المجموعة.
فتح الحزمة
k this deck
66
When a machine dispensing cola at a bottling plant is working correctly, it dispenses a mean of 12 ounces of cola per bottle with a standard deviation of 0.2 ounces.
a. When the machine is working correctly, what percentage of the bottles will be filled with between 11.6 and 12.4 ounces of cola?
At least ______________.
b. On a particular day, the bottling plant supervisor randomly selects two bottles from among those filled by the machine. One bottle contains 11.8 ounces of cola, and the other contains 12.1 ounces of cola. Based on the contents of these two bottles, what can the supervisor infer (conclude) about the machine's performance?
____________________________
فتح الحزمة
افتح القفل للوصول البطاقات البالغ عددها 186 في هذه المجموعة.
فتح الحزمة
k this deck
67
The expression is recognizable as the formula for:
A) the sample variance, computed from ungrouped data
B) the population variance, computed from ungrouped data
C) the sample variance, computed from grouped data
D) the population variance, computed from grouped data
E) the population variance, computed from ungrouped or grouped data
is recognizable as the formula for:A) the sample variance, computed from ungrouped data
B) the population variance, computed from ungrouped data
C) the sample variance, computed from grouped data
D) the population variance, computed from grouped data
E) the population variance, computed from ungrouped or grouped data
فتح الحزمة
افتح القفل للوصول البطاقات البالغ عددها 186 في هذه المجموعة.
فتح الحزمة
k this deck
68
Thirty-three students were asked to rate themselves on whether they were outgoing or not using this five point scale: 1 = extremely extroverted, 2 = extroverted, 3 = neither extroverted nor introverted, 4 = introverted, or 5 = extremely introverted. The results are shown in the table below:
a. Find the percentage of measurements in the following intervals:
= ______________
= ______________
This interval contains approximately ______________% of the data.
= ______________
= ______________
This interval contains approximately ______________% of the data.
b. Comment on the shape of the distribution.
____________________________
a. Find the percentage of measurements in the following intervals:
= ______________ = ______________This interval contains approximately ______________% of the data.
= ______________ = ______________This interval contains approximately ______________% of the data.
b. Comment on the shape of the distribution.
____________________________
فتح الحزمة
افتح القفل للوصول البطاقات البالغ عددها 186 في هذه المجموعة.
فتح الحزمة
k this deck
69
According to Tchebysheff's Theorem, provided only , regardless of the shape of a population's frequency distribution. The proportion of observations falling within k standard deviations of the mean is:
A) at most 1 -
B) at least 1 -
C) at most 1 -
D) at least 1 -
E) exactly 1 -
, regardless of the shape of a population's frequency distribution. The proportion of observations falling within k standard deviations of the mean is:A) at most 1 -
B) at least 1 -
C) at most 1 -
D) at least 1 -
E) exactly 1 -
فتح الحزمة
افتح القفل للوصول البطاقات البالغ عددها 186 في هذه المجموعة.
فتح الحزمة
k this deck
70
Given the following frequency table:
a. What fraction of the x values fall within two standard deviations of the mean?
______________
Within three standard deviations of the mean?
______________
b. Do the results of part (a) agree with Tchebysheff 's Theorem?
______________
c. Do the results of part (a) agree with the Empirical Rule?
______________
فتح الحزمة
افتح القفل للوصول البطاقات البالغ عددها 186 في هذه المجموعة.
فتح الحزمة
k this deck
71
Suppose the hourly dollar amount of food sold by a Burger King franchise follows an approximately mound-shaped distribution with a mean sales level of $400 per hour and a standard deviation of $60 per hour.
a. What percentage of the working hours does this Burger King franchise sell between $280 and $520 worth of food per hour?
______________
b. Suppose yesterday, during a one-hour period, this Burger King franchise had sales at the 84th percentile. What dollar sales figure does this represent?
______________
فتح الحزمة
افتح القفل للوصول البطاقات البالغ عددها 186 في هذه المجموعة.
فتح الحزمة
k this deck
72
The distribution of actual weight of tomato soup in a 16 ounce can is thought to be bell-shaped with a mean equal to 16 ounces, and a standard deviation equal to 0.25 ounces. Based on this information, between what two values could we expect 95% of all cans to weigh?
A) 15.75 to 16.25 ounces
B) 15.50 to 16.50 ounces
C) 15.25 to 16.75 ounces
D) 15 to 17 ounces
E) 15 to 16 ounces
A) 15.75 to 16.25 ounces
B) 15.50 to 16.50 ounces
C) 15.25 to 16.75 ounces
D) 15 to 17 ounces
E) 15 to 16 ounces
فتح الحزمة
افتح القفل للوصول البطاقات البالغ عددها 186 في هذه المجموعة.
فتح الحزمة
k this deck
73
The distribution of credit card balances for customers is highly skewed to the right with a mean of $1,200 and a standard deviation of $150. Based on this information, approximately 68% of the customers will have credit card balances between $1,050 and $1,350.
فتح الحزمة
افتح القفل للوصول البطاقات البالغ عددها 186 في هذه المجموعة.
فتح الحزمة
k this deck
74
The lengths of screws produced by a machine are normally distributed with a mean of 3 inches and a standard deviation of .2 inches. Therefore, we know:
A) that approximately 68 percent of all screws have lengths between 2.8 and 3.2 inches
B) that approximately 95 percent of all screws have lengths between 2.8 and 3.2 inches
C) that just about all screws have lengths between 2.8 and 3.2 inches
D) that approximately 98 percent of all screws have lengths between 2.8 and 3.2 inches
E) none of these
فتح الحزمة
افتح القفل للوصول البطاقات البالغ عددها 186 في هذه المجموعة.
فتح الحزمة
k this deck
75
Incomes of workers in an automobile company in Michigan are known to be right - skewed with a mean equal to $36,100. If at least 8/9 of all incomes are in the range of $29,600 to $42,800, and this was based on Tchebysheff's Theorem, what is the standard deviation for the auto workers?
A) $6,500
B) $6,700
C) Approximately $4,755
D) $2,200
E) $2,600
A) $6,500
B) $6,700
C) Approximately $4,755
D) $2,200
E) $2,600
فتح الحزمة
افتح القفل للوصول البطاقات البالغ عددها 186 في هذه المجموعة.
فتح الحزمة
k this deck
76
A new manufacturing plant has 20 job openings. To select the best 20 applicants from among the 1,000 job seekers, the plant's personnel office administers a written aptitude test to all applicants. The average score on the aptitude test is 150 points with a standard deviation of 10 points. Assume the distribution of test scores is approximately mound-shaped.
a. What percentage of the test scores will fall between 130 and 160 points?
Approximately ______________. (Enter as a decimal percent or use the % sign.)
b. How many applicants will score between 130 and 160 points?
At least ______________ applicants.
c. One of the applicants scored 192 points on the test. What might you conclude about this test score?
____________________________
فتح الحزمة
افتح القفل للوصول البطاقات البالغ عددها 186 في هذه المجموعة.
فتح الحزمة
k this deck
77
Tchebysheff's Theorem states that the percentage of measurements in a data set that fall within three standard deviations of their mean is:
A) 75%
B) 68%
C) 16%
D) at least 89%
E) at most 80%
A) 75%
B) 68%
C) 16%
D) at least 89%
E) at most 80%
فتح الحزمة
افتح القفل للوصول البطاقات البالغ عددها 186 في هذه المجموعة.
فتح الحزمة
k this deck
78
The expression , where is recognizable as the formula for:
A) the population mean, computed from ungrouped data
B) the sample mean, computed from ungrouped data
C) the population mean, computed from grouped data
D) the sample mean, computed from grouped data
E) none of these
, where is recognizable as the formula for:A) the population mean, computed from ungrouped data
B) the sample mean, computed from ungrouped data
C) the population mean, computed from grouped data
D) the sample mean, computed from grouped data
E) none of these
فتح الحزمة
افتح القفل للوصول البطاقات البالغ عددها 186 في هذه المجموعة.
فتح الحزمة
k this deck
79
The distribution of dollars paid for home insurance by home owners in Detroit is bell - shaped with a mean equal to $800 every six months, and a standard deviation equal to $120. Based on this information, we can use Tchebysheff's Theorem to determine the percentage of home owners that will pay between $560 and $1,040 for home insurance.
فتح الحزمة
افتح القفل للوصول البطاقات البالغ عددها 186 في هذه المجموعة.
فتح الحزمة
k this deck
80
Twenty-eight applicants interested in working for the Food Stamp program took an examination designed to measure their aptitude for social work. A stem-and-leaf plot of the 28 scores appears below, where the first column is the count per "branch," the second column is the stem value, and the remaining digits are the leaves.
a. Should the Empirical Rule be applied to this data set?
______________
b. Use the range approximation to determine an approximate value for the standard deviation.
______________
Is this a good approximation?
______________
a. Should the Empirical Rule be applied to this data set?
______________
b. Use the range approximation to determine an approximate value for the standard deviation.
______________
Is this a good approximation?
______________
فتح الحزمة
افتح القفل للوصول البطاقات البالغ عددها 186 في هذه المجموعة.
فتح الحزمة
k this deck
فتح الحزمة
افتح القفل للوصول البطاقات البالغ عددها 186 في هذه المجموعة.


