Deck 15: Nonparametric Statistics
ملء الشاشة (f)
سؤال
سؤال
سؤال
A school principal suspected that a teacher's attitude toward a first-grader depended on his original judgment of the child's ability. The principal also suspected that much of that judgment was based on the first-grader's IQ score, which was usually known to the teacher. After three weeks of teaching, a teacher was asked to rank the nine children in his class from 1 (highest) to 9 (lowest) as to his opinion of their ability. 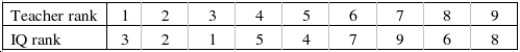 Do the data provide sufficient evidence to indicate a positive correlation between the teacher's ranks and the ranks of the IQs? Use
  = .05.
Test Statistic: = ______________
Reject Region:
Reject if |
if |  | > ______________
Conclude:
______________
A positive correlation ______________ between the teacher's ranks of the IQs.
Do the data provide sufficient evidence to indicate a positive correlation between the teacher's ranks and the ranks of the IQs? Use = .05.Test Statistic:
= ______________Reject Region:
Reject
if | | > ______________Conclude:
______________
A positive correlation ______________ between the teacher's ranks of the IQs.
سؤال
سؤال
The following paired observations were obtained on two variables x and y: 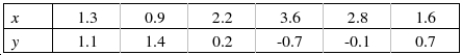 Calculate Spearman's rank correlation coefficient
  :
:
______________
Do the data present sufficient evidence to indicate a correlation between x and y? Test using = 0.05.
Reject Region:
Reject if |
if |  | > ______________
Conclude:
______________
There ______________ correlation between x and y.
Calculate Spearman's rank correlation coefficient :______________
Do the data present sufficient evidence to indicate a correlation between x and y? Test using
= 0.05.Reject Region:
Reject
if | | > ______________Conclude:
______________
There ______________ correlation between x and y.
سؤال
سؤال
سؤال
سؤال
سؤال
If the Friedman test is applied to a data set that are generated from a randomized block experiment with 5 treatments and 7 blocks, then the rejection region at the 5% significance level is  .
.
. سؤال
A professor was interested in the relationship between a student's rank on an oral exam and the student's rank on a written exam. The professor selected 8 students at random and ranked their scores for both the oral exam and the written exam. The following data was recorded: 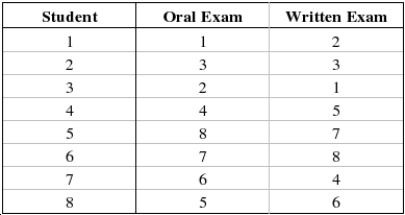 Find and interpret the rank correlation between a student's rank on the oral exam and the student's rank on the written exam.
Compute : ______________
There is ______________ relationship between the student's rank on the oral exam and the student's rank on the written exam.
Find and interpret the rank correlation between a student's rank on the oral exam and the student's rank on the written exam.Compute
: ______________There is ______________ relationship between the student's rank on the oral exam and the student's rank on the written exam.
سؤال
Two psychometricians (educators who are experts in the field of psychological test design) were asked to rank six designs for a new standardized college entrance exam. 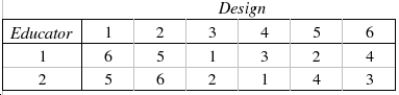 This problem uses Spearman's rank correlation coefficient to see if there is a (positive) relationship between the educators' rankings.
The null and alternate hypotheses are as follows: (There is no association between the rank pairs)
  (The correlation between the rank pairs is positive)
Describe why the test statistic is called the rank correlation coefficient.
________________________________________________________
Test Statistic: = ______________
Rejection region (for = 0.05):
Reject if
if  > ______________
Conclude: ______________
There ______________ sufficient evidence to indicate there is any significant positive correlation between the educators' rankings.
What does this result mean in the context of the problem?
________________________________________________________
What is the observed significance level for this test?
______________
This problem uses Spearman's rank correlation coefficient to see if there is a (positive) relationship between the educators' rankings.The null and alternate hypotheses are as follows:
(There is no association between the rank pairs) (The correlation between the rank pairs is positive)Describe why the test statistic
is called the rank correlation coefficient.________________________________________________________
Test Statistic:
= ______________Rejection region (for
= 0.05):Reject
if > ______________Conclude: ______________
There ______________ sufficient evidence to indicate there is any significant positive correlation between the educators' rankings.
What does this result mean in the context of the problem?
________________________________________________________
What is the observed significance level for this test?
______________
سؤال
The population Spearman correlation coefficient is labeled  , and the sample statistic used to estimate its value is labeled
  .
.
, and the sample statistic used to estimate its value is labeled . سؤال
سؤال
سؤال
سؤال
To determine if a relationship exists between two variables, the hypotheses to be tested are  .
.
. سؤال
سؤال
In testing  at the 5% significance level, a sample of size 20 is used. The rejection region is:
A) -.377. 377
B) .777 or-.377
C) .450 or-.450
D) -.450. 450
E) none of these
at the 5% significance level, a sample of size 20 is used. The rejection region is:A) -.377. 377
B) .777 or-.377
C) .450 or-.450
D) -.450. 450
E) none of these
سؤال
سؤال
سؤال
A toy store manager was interested in determining whether the assembly time is the same for three models of baby strollers. The manager selected five employees at random and asked each of them to assemble each of the strollers. The assembly time, in minutes, was recorded as follows: 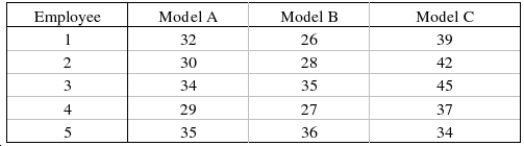 The manager wasn't sure whether the assumptions for the usual analysis of variance were valid, so she decided to use a nonparametric procedure. Use the appropriate method to determine whether the assembly time is the same for the three models of baby strollers. Use
  = 0.05.
Test Statistic: = ______________
Reject Region:
Reject if
if  > ______________
Conclude: ______________
The distributions of assembly time for the three models of baby strollers are ______________.
The manager wasn't sure whether the assumptions for the usual analysis of variance were valid, so she decided to use a nonparametric procedure. Use the appropriate method to determine whether the assembly time is the same for the three models of baby strollers. Use = 0.05.Test Statistic:
= ______________Reject Region:
Reject
if > ______________Conclude: ______________
The distributions of assembly time for the three models of baby strollers are ______________.
سؤال
The following data were generated from a blocked experiment. Conduct a Friedman test at the 5% significance level to determine if at least two population locations differ. 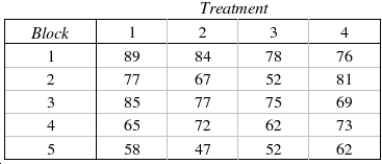 Test Statistic:
  = ______________
Reject Region:
Reject if
if  > ______________
Conclude: ______________
The locations of all four populations are ______________.
Test Statistic: = ______________Reject Region:
Reject
if > ______________Conclude: ______________
The locations of all four populations are ______________.
سؤال
سؤال
The reaction times to three stimuli were recorded for each of 8 subjects. The data, recorded in seconds, are shown below. This problem uses Friedman's  test to determine if there is a difference among the population distributions of reaction times.
 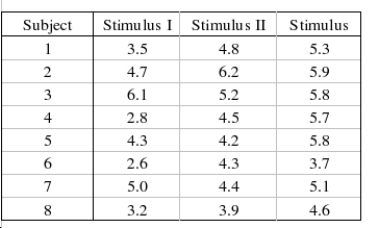 What experimental design is being used in this problem?
____________________________
The null and alternate hypotheses are as follows: : The three population distributions are identical.
  : At least two of the three population distributions differ in location.
Describe what the Test statistic is.
is.
________________________________________________________
Test statistic: = ______________
Rejection region for =0.05:
Reject if
if  > ______________
Conclusion: ______________
There is ______________ evidence to conclude that the reaction times for the three stimuli are different.
Estimate the p-value for this problem?
______________
test to determine if there is a difference among the population distributions of reaction times. What experimental design is being used in this problem?____________________________
The null and alternate hypotheses are as follows:
: The three population distributions are identical. : At least two of the three population distributions differ in location.Describe what the Test statistic
is.________________________________________________________
Test statistic:
= ______________Rejection region for
=0.05:Reject
if > ______________Conclusion: ______________
There is ______________ evidence to conclude that the reaction times for the three stimuli are different.
Estimate the p-value for this problem?
______________
سؤال
Another school district also planned to evaluate two different workbooks and two distinct teaching machines to assess their effectiveness in teaching the concept of multiplication. However, the administrators in this school district consulted a statistician about the design of their study. Because they were looking for a method effective on children of all abilities, the statistician suggested they check the children's past scholastic records and divide the children into groups according to their ability level. These ability groups represent relatively homogeneous experimental units within which the comparison of teaching methods may be made. She assigned one child from each ability level to each teaching method. Twenty students participated in the study. After receiving instruction, the children took a multiplication test and the number of errors they made were recorded. 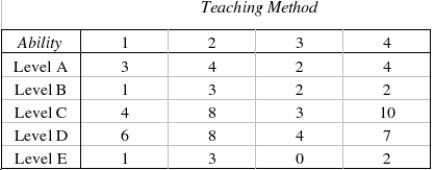 What experimental design did the statistician use?
________________________________________________________
The null and alternate hypotheses are as follows: : The three population distributions are identical.
  : At least two of the three population distributions differ in location.
Describe what the test statistic is.
is.
________________________________________________________
Test Statistic: = ______________
Reject Region:
Reject if F > ______________
Conclude: ______________
The teaching methods ______________ equally effective.
Estimate the observed significance level of this test.
______________
What experimental design did the statistician use?________________________________________________________
The null and alternate hypotheses are as follows:
: The three population distributions are identical. : At least two of the three population distributions differ in location.Describe what the test statistic
is.________________________________________________________
Test Statistic:
= ______________Reject Region:
Reject
if F > ______________Conclude: ______________
The teaching methods ______________ equally effective.
Estimate the observed significance level of this test.
______________
سؤال
سؤال
سؤال
The restaurant critic on a newspaper claims that the hamburgers that one gets at the hamburger chain restaurants are all equally bad and that people who claim to like one hamburger over others are victims of advertising. In fact, he claims that if there were no differences in appearance, then all hamburgers would be rated equally. To test the critic's assertion, ten teenagers are asked to taste hamburgers from three different fast-food chains. Each hamburger is dressed in the same way (mustard, relish, tomato, and pickle) with the same type of bun. The teenagers taste each hamburger and rate it on a 9-point scale with 1 = bad and 9 = excellent. The data are listed below. 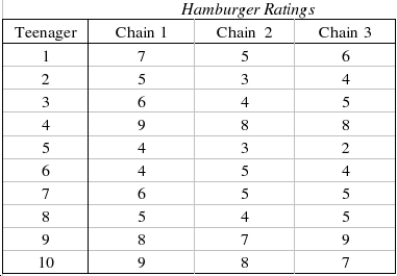 Which statistical technique is appropriate if you want to compare the quality of hamburger of the three chain restaurants?
______________
Can we infer at the 1% significance level that the critic is wrong?
Test Statistic: ______________
Reject Region:
Reject if the test statistic > ______________
Conclude: ______________
We ______________ infer at the 1% significance level that the critic is wrong.
Using the appropriate statistical table, what statement can be made about the p-value for this test?
______________
Which statistical technique is appropriate if you want to compare the quality of hamburger of the three chain restaurants?______________
Can we infer at the 1% significance level that the critic is wrong?
Test Statistic: ______________
Reject Region:
Reject
if the test statistic > ______________Conclude: ______________
We ______________ infer at the 1% significance level that the critic is wrong.
Using the appropriate statistical table, what statement can be made about the p-value for this test?
______________
سؤال
سؤال
In a Friedman test for comparing three populations, provided that there are five blocks, the test statistic is calculated as  = 6.594. Then, the most accurate statement that can be made about the p-value is that:
A) p-value < 0.01
B) .05 < p-value < .10
C) .025 < p-value < .05
D) p-value > .10
E) 0.01< p-value < 0.025
= 6.594. Then, the most accurate statement that can be made about the p-value is that:A) p-value < 0.01
B) .05 < p-value < .10
C) .025 < p-value < .05
D) p-value > .10
E) 0.01< p-value < 0.025
سؤال
سؤال
The general manager of a frozen TV dinner maker must decide which one of four new dinners to introduce to the market. He decides to perform an experiment to help make a decision. Each dinner is sampled by ten people who then rate the product on a 7-point scale, where 1 = poor, and 7 = excellent. The results are shown below. 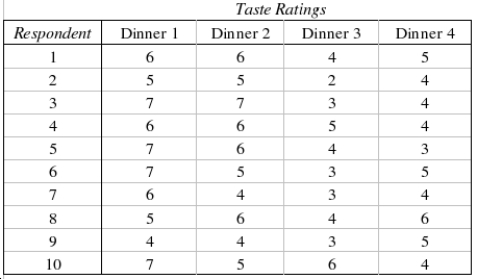 Which statistical technique the general manager can use to help him make a decision?
______________
Can the general manager infer at the 5% significance level that there are differences in the taste ratings of the four dinners?
Test Statistic: ______________
Reject Region:
Reject if test statistic > ______________
Conclude: ______________
The general manager ______________ infer at the 5% significance level that there are differences in the taste ratings of the four dinners.
Using the appropriate statistical table, what statement can be made about the p-value for this test?
______________
Which statistical technique the general manager can use to help him make a decision?______________
Can the general manager infer at the 5% significance level that there are differences in the taste ratings of the four dinners?
Test Statistic: ______________
Reject Region:
Reject
if test statistic > ______________Conclude: ______________
The general manager ______________ infer at the 5% significance level that there are differences in the taste ratings of the four dinners.
Using the appropriate statistical table, what statement can be made about the p-value for this test?
______________
سؤال
سؤال
If the Friedman test is applied to a data set that are generated from a randomized block experiment with 3 treatments and 5 blocks, then the rejection region at the 2.5% significance level is  > 12.8325.
> 12.8325. سؤال
In a Friedman test for comparing four populations, provided that there as eight blocks, the test statistic is calculated as  = 10.98. If the test is conducted at the 5% significance level, the conclusion and p-value will be:
A) reject the null hypothesis, and 0.01 < p-value < 0.025
B) reject the null hypothesis, and p-value > 0.025
C) do not reject the null hypothesis, and 0.025 < p-value < 0.05
D) do not reject the null hypothesis, and p-value < 0.05
E) reject the null hypothesis, p-value = 0
= 10.98. If the test is conducted at the 5% significance level, the conclusion and p-value will be:A) reject the null hypothesis, and 0.01 < p-value < 0.025
B) reject the null hypothesis, and p-value > 0.025
C) do not reject the null hypothesis, and 0.025 < p-value < 0.05
D) do not reject the null hypothesis, and p-value < 0.05
E) reject the null hypothesis, p-value = 0
سؤال
سؤال
سؤال
سؤال
سؤال
Apply the Friedman test to the accompany table of ordinal data to determine whether we can infer at the 10% significance level that at least two population locations differ. 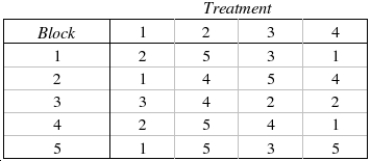 Test Statistic:
  = ______________
Reject Region:
Reject if
if  > ______________
Conclude: ______________
We ______________ infer at the 10% significance level that at least two population locations differ.
Test Statistic: = ______________Reject Region:
Reject
if > ______________Conclude: ______________
We ______________ infer at the 10% significance level that at least two population locations differ.
سؤال
سؤال
سؤال
سؤال
سؤال
سؤال
سؤال
سؤال
سؤال
سؤال
سؤال
سؤال
سؤال
سؤال
سؤال
سؤال
سؤال
سؤال
سؤال
سؤال
سؤال
سؤال
A computer laboratory manager was interested in whether there was a difference in functioning time before needing to be recharged for three battery packs for laptop computers. The manager took a random sample of six battery packs of each brand and tested them. The results, in hours of functioning before needing to be recharged, were recorded as 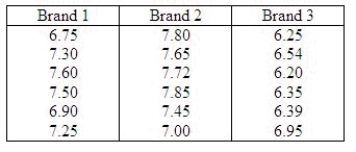 The manager, unsure that the assumptions for the usual parametric analysis of variance were valid, decided to employ nonparametric methods. Use the appropriate nonparametric procedure to determine whether the distribution of functioning time before needing to be recharged is the same for the three brands of battery packs. Use
  = 0.05.
Test Statistic:
H = ______________
What is the critical value for the test statistic?
Reject if the test statistic > ______________.
Conclude: ______________
There ______________ sufficient evidence at = 0.05 to say that at least two of the distributions of functioning times before battery needing to be recharged differ in location.
The manager, unsure that the assumptions for the usual parametric analysis of variance were valid, decided to employ nonparametric methods. Use the appropriate nonparametric procedure to determine whether the distribution of functioning time before needing to be recharged is the same for the three brands of battery packs. Use = 0.05.Test Statistic:
H = ______________
What is the critical value for the test statistic?
Reject
if the test statistic > ______________.Conclude: ______________
There ______________ sufficient evidence at
= 0.05 to say that at least two of the distributions of functioning times before battery needing to be recharged differ in location. سؤال
Apply the Kruskal-Wallis test to determine if there is enough evidence at the 5% significance level to infer that at least two populations differ. 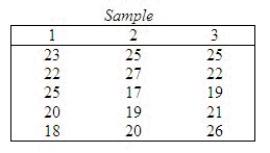 Test statistic: H = ______________
Reject if H > ______________
Conclude: ______________
There ______________ enough evidence at the 5% significance level to infer that at least two populations differ.
Test statistic: H = ______________Reject
if H > ______________Conclude: ______________
There ______________ enough evidence at the 5% significance level to infer that at least two populations differ.
سؤال
سؤال
سؤال
An experiment was conducted to examine the effect of age on heart rate when a person is subjected to a specific amount of exercise. Ten men randomly selected from each of four age groups: 10-19, 20-39, 40-59, and 60-69. Each man walked a treadmill at a fixed grade for a period of 12 minutes, and the increase in heart rate (the difference before and after exercise) was recorded (in beats per minute). The data are shown in the table. 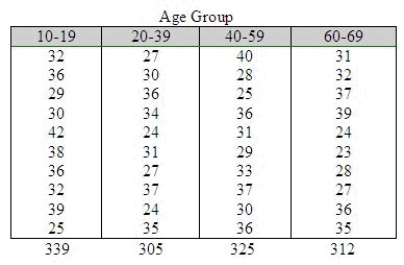 Do the data present sufficient evidence to indicate differences in location for at least two of the four age groups? Test using the Kruskal-Wallis H test with
  = 0.01.
What is H?
______________
What is the critical value for the test statistic?
Reject if H > ______________
Conclude: ______________
There is ______________ of a difference in location.
Find the approximate p-value for the test above.
______________
Do the data present sufficient evidence to indicate differences in location for at least two of the four age groups? Test using the Kruskal-Wallis H test with = 0.01.What is H?
______________
What is the critical value for the test statistic?
Reject
if H > ______________Conclude: ______________
There is ______________ of a difference in location.
Find the approximate p-value for the test above.
______________
سؤال
A movie critic wanted to determine whether or not moviegoers of different age groups evaluated a movie differently. With this objective, he commissioned a survey that asked people their ratings of the most recently watched movies. The rating categories were: 1 = terrible, 2 = fair, 3 = good, and 4 = excellent. Each respondent was also asked to categorize his or her age as either: 1 = teenager, 2 = young adult (20-34), 3 = middle age (35-50), and 4 = senior (over 50). The results are shown below. 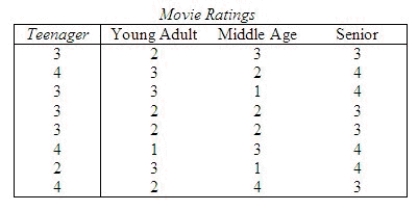 Do these data provide sufficient evidence to infer at the 5% significance level that there were differences in ratings among the different age categories?
Test statistic:
H = ______________
What is the critical value for the test statistic?
Reject if the test statistic > ______________.
Conclude: ______________
There ______________ sufficient evidence to infer at the 5% significance level that there were differences in ratings among the different age categories.
What statement can be made about the p-value for this test?
______________
Do these data provide sufficient evidence to infer at the 5% significance level that there were differences in ratings among the different age categories?Test statistic:
H = ______________
What is the critical value for the test statistic?
Reject
if the test statistic > ______________.Conclude: ______________
There ______________ sufficient evidence to infer at the 5% significance level that there were differences in ratings among the different age categories.
What statement can be made about the p-value for this test?
______________
سؤال
سؤال
In a Kruskal-Wallis test to determine whether differences exist among three different advertisements, the following statistics were obtained: 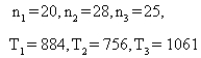 Conduct the test at the 5% significance level.
Test statistic: H = ______________
Reject if H > ______________
Conclude: ______________
There ______________ enough evidence to conclude that differences exist among three different advertisements.
What is the most accurate statement that can be made about the p-value of this test?
______________
Conduct the test at the 5% significance level.Test statistic: H = ______________
Reject
if H > ______________Conclude: ______________
There ______________ enough evidence to conclude that differences exist among three different advertisements.
What is the most accurate statement that can be made about the p-value of this test?
______________
سؤال
سؤال
سؤال
سؤال
سؤال
The marketing manager of a pizza chain is in the process of examining some of the demographic characteristics of her customers. In particular, she would like to investigate the belief that the ages of the customers of pizza parlors, hamburger emporiums, and fast-food chicken restaurants are different. As an experiment, the ages of eight customers of each of the restaurants are recorded and listed below. From previous analysis we know that the ages are not normally distributed. 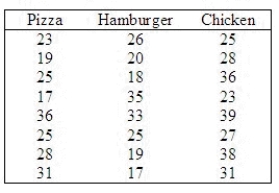 Do these data provide enough evidence at the 10% significance level to infer that there are differences in ages among the customers of the three restaurants?
Test statistic: H = ______________
Reject if H > ______________
Conclude: ______________
There ______________ enough evidence at the 10% significance level to infer that there are differences in ages among the customers of the three restaurants.
Do these data provide enough evidence at the 10% significance level to infer that there are differences in ages among the customers of the three restaurants?Test statistic: H = ______________
Reject
if H > ______________Conclude: ______________
There ______________ enough evidence at the 10% significance level to infer that there are differences in ages among the customers of the three restaurants.
سؤال
Three treatments were compared using a completely randomized design. The data are shown in the table. 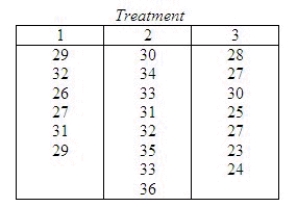 Do the data provide sufficient evidence to indicate a difference in location for at least two of the population distributions? Test using the Kruskal-Wallis H statistic with
  = 0.05.
Test statistic:
H = ______________
What is the critical value for the test statistic?
Reject if the test statistic > ______________.
Conclude: ______________
There ______________ a difference in location among the three treatments.
Do the data provide sufficient evidence to indicate a difference in location for at least two of the population distributions? Test using the Kruskal-Wallis H statistic with = 0.05.Test statistic:
H = ______________
What is the critical value for the test statistic?
Reject
if the test statistic > ______________.Conclude: ______________
There ______________ a difference in location among the three treatments.
سؤال
سؤال
The Wilcoxon signed rank test for matched pairs is the nonparametric counterpart of the paired two-sample t-test of  .
.
. سؤال
Two different workbooks and two distinct teaching machines were to be evaluated on their effectiveness in teaching the concept of multiplication. A fourth grade class of 24 subjects was randomly assigned to 4 groups and each group in turn was randomly assigned to a teaching method. A test was given and the number of errors was recorded. This problem uses the Kruskal-Wallis H test to see if the number of errors differs from one teaching method to another. 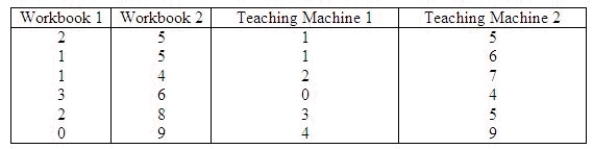 What is the value of H in this problem?
______________
Find the rejection region for = 0.05.
Reject if H > ______________
Conclude: ______________
There is ______________ evidence at = 0.05 to say that the number of errors differs from one teaching method to another.
What is the p-value for this test?
______________
What is the value of H in this problem?______________
Find the rejection region for
= 0.05.Reject
if H > ______________Conclude: ______________
There is ______________ evidence at
= 0.05 to say that the number of errors differs from one teaching method to another.What is the p-value for this test?
______________
سؤال

فتح الحزمة
قم بالتسجيل لفتح البطاقات في هذه المجموعة!
Unlock Deck
Unlock Deck
1/198
العب
ملء الشاشة (f)
Deck 15: Nonparametric Statistics
1
The rank correlation coefficient is used when one is:
A) correlating quantitative data
B) correlating rankings of individual values for two variables
C) analyzing data which are assumed to be linearly related
D) not interested in drawing inferences from the study
E) analyzing data which are assumed to be non-linearly related
A) correlating quantitative data
B) correlating rankings of individual values for two variables
C) analyzing data which are assumed to be linearly related
D) not interested in drawing inferences from the study
E) analyzing data which are assumed to be non-linearly related
correlating rankings of individual values for two variables
2
The Spearman rank correlation coefficient is calculated by first ranking the data values, and then calculating the Pearson correlation coefficient of the ranks.
True
3
A school principal suspected that a teacher's attitude toward a first-grader depended on his original judgment of the child's ability. The principal also suspected that much of that judgment was based on the first-grader's IQ score, which was usually known to the teacher. After three weeks of teaching, a teacher was asked to rank the nine children in his class from 1 (highest) to 9 (lowest) as to his opinion of their ability. Do the data provide sufficient evidence to indicate a positive correlation between the teacher's ranks and the ranks of the IQs? Use = .05.
Test Statistic: = ______________
Reject Region:
Reject if | | > ______________
Conclude:
______________
A positive correlation ______________ between the teacher's ranks of the IQs.
Do the data provide sufficient evidence to indicate a positive correlation between the teacher's ranks and the ranks of the IQs? Use = .05.Test Statistic:
= ______________Reject Region:
Reject
if | | > ______________Conclude:
______________
A positive correlation ______________ between the teacher's ranks of the IQs.
.8333; .60; Reject the null hypothesis; exists
4
The Spearman rank-correlation is a nonparametric test that 1) uses the directions of differences observed in a matched-pairs sample to determine whether the relative frequency distributions of two statistical populations are identical to or different from one another and 2) determines whether a sample comes from a population with a specified median.
فتح الحزمة
افتح القفل للوصول البطاقات البالغ عددها 198 في هذه المجموعة.
فتح الحزمة
k this deck
5
The following paired observations were obtained on two variables x and y: Calculate Spearman's rank correlation coefficient :
______________
Do the data present sufficient evidence to indicate a correlation between x and y? Test using = 0.05.
Reject Region:
Reject if | | > ______________
Conclude:
______________
There ______________ correlation between x and y.
Calculate Spearman's rank correlation coefficient :______________
Do the data present sufficient evidence to indicate a correlation between x and y? Test using
= 0.05.Reject Region:
Reject
if | | > ______________Conclude:
______________
There ______________ correlation between x and y.
فتح الحزمة
افتح القفل للوصول البطاقات البالغ عددها 198 في هذه المجموعة.
فتح الحزمة
k this deck
6
The Spearman rank correlation coefficient allows us to measure and test to determine whether there is evidence of a linear relationship between two variables if:
A) one or both variables ordinal
B) both variables are interval but the normality requirement for parametric tests is not satisfied
C) both one or both variables ordinal and both variables are interval but the normality requirement for parametric tests is not satisfied
D) neither one or both variables ordinal nor both variables are interval but the normality requirement for parametric tests is not satisfied
E) none of these
فتح الحزمة
افتح القفل للوصول البطاقات البالغ عددها 198 في هذه المجموعة.
فتح الحزمة
k this deck
7
The Spearman rank-correlation test is a nonparametric test that uses the directions of differences observed in a matched-pairs sample to determine whether the relative frequency distributions of two statistical populations are identical to or different from one another.
فتح الحزمة
افتح القفل للوصول البطاقات البالغ عددها 198 في هذه المجموعة.
فتح الحزمة
k this deck
8
The Friedman test is employed to compare two or more populations when the data are generated from a matched pairs experiment, and are either ordinal or interval, but not normally distributed.
فتح الحزمة
افتح القفل للوصول البطاقات البالغ عددها 198 في هذه المجموعة.
فتح الحزمة
k this deck
9
Spearman's rank-correlation coefficient can only take on values between:
A) 0 and
B) and 0
C) 1 and +1
D) and +1
E) and
A) 0 and
B) and 0
C) 1 and +1
D) and +1
E) and
فتح الحزمة
افتح القفل للوصول البطاقات البالغ عددها 198 في هذه المجموعة.
فتح الحزمة
k this deck
10
If the Friedman test is applied to a data set that are generated from a randomized block experiment with 5 treatments and 7 blocks, then the rejection region at the 5% significance level is .
. فتح الحزمة
افتح القفل للوصول البطاقات البالغ عددها 198 في هذه المجموعة.
فتح الحزمة
k this deck
11
A professor was interested in the relationship between a student's rank on an oral exam and the student's rank on a written exam. The professor selected 8 students at random and ranked their scores for both the oral exam and the written exam. The following data was recorded: Find and interpret the rank correlation between a student's rank on the oral exam and the student's rank on the written exam.
Compute : ______________
There is ______________ relationship between the student's rank on the oral exam and the student's rank on the written exam.
Find and interpret the rank correlation between a student's rank on the oral exam and the student's rank on the written exam.Compute
: ______________There is ______________ relationship between the student's rank on the oral exam and the student's rank on the written exam.
فتح الحزمة
افتح القفل للوصول البطاقات البالغ عددها 198 في هذه المجموعة.
فتح الحزمة
k this deck
12
Two psychometricians (educators who are experts in the field of psychological test design) were asked to rank six designs for a new standardized college entrance exam. This problem uses Spearman's rank correlation coefficient to see if there is a (positive) relationship between the educators' rankings.
The null and alternate hypotheses are as follows: (There is no association between the rank pairs) (The correlation between the rank pairs is positive)
Describe why the test statistic is called the rank correlation coefficient.
________________________________________________________
Test Statistic: = ______________
Rejection region (for = 0.05):
Reject if > ______________
Conclude: ______________
There ______________ sufficient evidence to indicate there is any significant positive correlation between the educators' rankings.
What does this result mean in the context of the problem?
________________________________________________________
What is the observed significance level for this test?
______________
This problem uses Spearman's rank correlation coefficient to see if there is a (positive) relationship between the educators' rankings.The null and alternate hypotheses are as follows:
(There is no association between the rank pairs) (The correlation between the rank pairs is positive)Describe why the test statistic
is called the rank correlation coefficient.________________________________________________________
Test Statistic:
= ______________Rejection region (for
= 0.05):Reject
if > ______________Conclude: ______________
There ______________ sufficient evidence to indicate there is any significant positive correlation between the educators' rankings.
What does this result mean in the context of the problem?
________________________________________________________
What is the observed significance level for this test?
______________
فتح الحزمة
افتح القفل للوصول البطاقات البالغ عددها 198 في هذه المجموعة.
فتح الحزمة
k this deck
13
The population Spearman correlation coefficient is labeled , and the sample statistic used to estimate its value is labeled .
, and the sample statistic used to estimate its value is labeled . فتح الحزمة
افتح القفل للوصول البطاقات البالغ عددها 198 في هذه المجموعة.
فتح الحزمة
k this deck
14
We can use the Friedman test to determine whether a difference exists between two populations. However, if we want to determine whether one population location is larger than another, we must use the sign test.
فتح الحزمة
افتح القفل للوصول البطاقات البالغ عددها 198 في هذه المجموعة.
فتح الحزمة
k this deck
15
A one-sample t-test is the parametric counterpart of the Friedman test for randomized block experimental design.
فتح الحزمة
افتح القفل للوصول البطاقات البالغ عددها 198 في هذه المجموعة.
فتح الحزمة
k this deck
16
Which of the following statements about Spearman's rank-correlation coefficient is false?
A) It is the test statistic used in Spearmen's rank-correlation test, symbolized by.
B) It can only take on values between 0 and + 1.
C) Positive values near + 1 point to a monotonically increasing relationship between the two variables, such that steady increases in one are associated with steady increases in the other.
D) None of these.
E) All of these.
فتح الحزمة
افتح القفل للوصول البطاقات البالغ عددها 198 في هذه المجموعة.
فتح الحزمة
k this deck
17
To determine if a relationship exists between two variables, the hypotheses to be tested are .
. فتح الحزمة
افتح القفل للوصول البطاقات البالغ عددها 198 في هذه المجموعة.
فتح الحزمة
k this deck
18
The Friedman test is the nonparametric counterpart to the randomized block design of the analysis of variance.
فتح الحزمة
افتح القفل للوصول البطاقات البالغ عددها 198 في هذه المجموعة.
فتح الحزمة
k this deck
19
In testing at the 5% significance level, a sample of size 20 is used. The rejection region is:
A) -.377. 377
B) .777 or-.377
C) .450 or-.450
D) -.450. 450
E) none of these
at the 5% significance level, a sample of size 20 is used. The rejection region is:A) -.377. 377
B) .777 or-.377
C) .450 or-.450
D) -.450. 450
E) none of these
فتح الحزمة
افتح القفل للوصول البطاقات البالغ عددها 198 في هذه المجموعة.
فتح الحزمة
k this deck
20
The Friedman test is a nonparametric test that can be used to compare more than two dependent samples when the assumptions for an analysis of variance are invalid.
فتح الحزمة
افتح القفل للوصول البطاقات البالغ عددها 198 في هذه المجموعة.
فتح الحزمة
k this deck
21
A three independent samples one-way analysis of variance test corresponds to:
A) a Wilcoxon signed rank test for paired samples
B) a Wilcoxon rank sum test
C) a Wilcoxon signed rank test for one sample
D) a Kruskal-Wallis test
E) a Friedman test
A) a Wilcoxon signed rank test for paired samples
B) a Wilcoxon rank sum test
C) a Wilcoxon signed rank test for one sample
D) a Kruskal-Wallis test
E) a Friedman test
فتح الحزمة
افتح القفل للوصول البطاقات البالغ عددها 198 في هذه المجموعة.
فتح الحزمة
k this deck
22
A toy store manager was interested in determining whether the assembly time is the same for three models of baby strollers. The manager selected five employees at random and asked each of them to assemble each of the strollers. The assembly time, in minutes, was recorded as follows: The manager wasn't sure whether the assumptions for the usual analysis of variance were valid, so she decided to use a nonparametric procedure. Use the appropriate method to determine whether the assembly time is the same for the three models of baby strollers. Use = 0.05.
Test Statistic: = ______________
Reject Region:
Reject if > ______________
Conclude: ______________
The distributions of assembly time for the three models of baby strollers are ______________.
The manager wasn't sure whether the assumptions for the usual analysis of variance were valid, so she decided to use a nonparametric procedure. Use the appropriate method to determine whether the assembly time is the same for the three models of baby strollers. Use = 0.05.Test Statistic:
= ______________Reject Region:
Reject
if > ______________Conclude: ______________
The distributions of assembly time for the three models of baby strollers are ______________.
فتح الحزمة
افتح القفل للوصول البطاقات البالغ عددها 198 في هذه المجموعة.
فتح الحزمة
k this deck
23
The following data were generated from a blocked experiment. Conduct a Friedman test at the 5% significance level to determine if at least two population locations differ. Test Statistic: = ______________
Reject Region:
Reject if > ______________
Conclude: ______________
The locations of all four populations are ______________.
Test Statistic: = ______________Reject Region:
Reject
if > ______________Conclude: ______________
The locations of all four populations are ______________.
فتح الحزمة
افتح القفل للوصول البطاقات البالغ عددها 198 في هذه المجموعة.
فتح الحزمة
k this deck
24
If Friedman test is applied to a data set that are generated from a randomized block experiment with 4 treatments and 8 blocks, then the rejection region at the 5% significance level is:
A) 1.6450
B) 7.8147
C) 9.4877
D) 11.0705
E) 1.8450
A) 1.6450
B) 7.8147
C) 9.4877
D) 11.0705
E) 1.8450
فتح الحزمة
افتح القفل للوصول البطاقات البالغ عددها 198 في هذه المجموعة.
فتح الحزمة
k this deck
25
The reaction times to three stimuli were recorded for each of 8 subjects. The data, recorded in seconds, are shown below. This problem uses Friedman's test to determine if there is a difference among the population distributions of reaction times. What experimental design is being used in this problem?
____________________________
The null and alternate hypotheses are as follows: : The three population distributions are identical. : At least two of the three population distributions differ in location.
Describe what the Test statistic is.
________________________________________________________
Test statistic: = ______________
Rejection region for =0.05:
Reject if > ______________
Conclusion: ______________
There is ______________ evidence to conclude that the reaction times for the three stimuli are different.
Estimate the p-value for this problem?
______________
test to determine if there is a difference among the population distributions of reaction times. What experimental design is being used in this problem?____________________________
The null and alternate hypotheses are as follows:
: The three population distributions are identical. : At least two of the three population distributions differ in location.Describe what the Test statistic
is.________________________________________________________
Test statistic:
= ______________Rejection region for
=0.05:Reject
if > ______________Conclusion: ______________
There is ______________ evidence to conclude that the reaction times for the three stimuli are different.
Estimate the p-value for this problem?
______________
فتح الحزمة
افتح القفل للوصول البطاقات البالغ عددها 198 في هذه المجموعة.
فتح الحزمة
k this deck
26
Another school district also planned to evaluate two different workbooks and two distinct teaching machines to assess their effectiveness in teaching the concept of multiplication. However, the administrators in this school district consulted a statistician about the design of their study. Because they were looking for a method effective on children of all abilities, the statistician suggested they check the children's past scholastic records and divide the children into groups according to their ability level. These ability groups represent relatively homogeneous experimental units within which the comparison of teaching methods may be made. She assigned one child from each ability level to each teaching method. Twenty students participated in the study. After receiving instruction, the children took a multiplication test and the number of errors they made were recorded. What experimental design did the statistician use?
________________________________________________________
The null and alternate hypotheses are as follows: : The three population distributions are identical. : At least two of the three population distributions differ in location.
Describe what the test statistic is.
________________________________________________________
Test Statistic: = ______________
Reject Region:
Reject if F > ______________
Conclude: ______________
The teaching methods ______________ equally effective.
Estimate the observed significance level of this test.
______________
What experimental design did the statistician use?________________________________________________________
The null and alternate hypotheses are as follows:
: The three population distributions are identical. : At least two of the three population distributions differ in location.Describe what the test statistic
is.________________________________________________________
Test Statistic:
= ______________Reject Region:
Reject
if F > ______________Conclude: ______________
The teaching methods ______________ equally effective.
Estimate the observed significance level of this test.
______________
فتح الحزمة
افتح القفل للوصول البطاقات البالغ عددها 198 في هذه المجموعة.
فتح الحزمة
k this deck
27
A randomized block design analysis of variance test corresponds to:
A) a Wilcoxon signed rank test for paired samples
B) a Wilcoxon rank sum test
C) a Wilcoxon signed rank test for one sample
D) a Friedman test for randomized block design
E) all of these
A) a Wilcoxon signed rank test for paired samples
B) a Wilcoxon rank sum test
C) a Wilcoxon signed rank test for one sample
D) a Friedman test for randomized block design
E) all of these
فتح الحزمة
افتح القفل للوصول البطاقات البالغ عددها 198 في هذه المجموعة.
فتح الحزمة
k this deck
28
To apply the Friedman test to determine whether the locations of two or more populations are the same, the samples must be:
A) from matched pairs experiment
B) from normal populations
C) independent
D) larger than 20
E) from matched pairs experiment and from normal populations
A) from matched pairs experiment
B) from normal populations
C) independent
D) larger than 20
E) from matched pairs experiment and from normal populations
فتح الحزمة
افتح القفل للوصول البطاقات البالغ عددها 198 في هذه المجموعة.
فتح الحزمة
k this deck
29
The restaurant critic on a newspaper claims that the hamburgers that one gets at the hamburger chain restaurants are all equally bad and that people who claim to like one hamburger over others are victims of advertising. In fact, he claims that if there were no differences in appearance, then all hamburgers would be rated equally. To test the critic's assertion, ten teenagers are asked to taste hamburgers from three different fast-food chains. Each hamburger is dressed in the same way (mustard, relish, tomato, and pickle) with the same type of bun. The teenagers taste each hamburger and rate it on a 9-point scale with 1 = bad and 9 = excellent. The data are listed below. Which statistical technique is appropriate if you want to compare the quality of hamburger of the three chain restaurants?
______________
Can we infer at the 1% significance level that the critic is wrong?
Test Statistic: ______________
Reject Region:
Reject if the test statistic > ______________
Conclude: ______________
We ______________ infer at the 1% significance level that the critic is wrong.
Using the appropriate statistical table, what statement can be made about the p-value for this test?
______________
Which statistical technique is appropriate if you want to compare the quality of hamburger of the three chain restaurants?______________
Can we infer at the 1% significance level that the critic is wrong?
Test Statistic: ______________
Reject Region:
Reject
if the test statistic > ______________Conclude: ______________
We ______________ infer at the 1% significance level that the critic is wrong.
Using the appropriate statistical table, what statement can be made about the p-value for this test?
______________
فتح الحزمة
افتح القفل للوصول البطاقات البالغ عددها 198 في هذه المجموعة.
فتح الحزمة
k this deck
30
The Friedman test is the nonparametric counterpart of the randomized block experimental design of the analysis of variance.
فتح الحزمة
افتح القفل للوصول البطاقات البالغ عددها 198 في هذه المجموعة.
فتح الحزمة
k this deck
31
In a Friedman test for comparing three populations, provided that there are five blocks, the test statistic is calculated as = 6.594. Then, the most accurate statement that can be made about the p-value is that:
A) p-value < 0.01
B) .05 < p-value < .10
C) .025 < p-value < .05
D) p-value > .10
E) 0.01< p-value < 0.025
= 6.594. Then, the most accurate statement that can be made about the p-value is that:A) p-value < 0.01
B) .05 < p-value < .10
C) .025 < p-value < .05
D) p-value > .10
E) 0.01< p-value < 0.025
فتح الحزمة
افتح القفل للوصول البطاقات البالغ عددها 198 في هذه المجموعة.
فتح الحزمة
k this deck
32
The Friedman test are always:
A) one-tail
B) two-tail
C) used with one sample
D) used when the populations are normally distributed
E) used all the time
A) one-tail
B) two-tail
C) used with one sample
D) used when the populations are normally distributed
E) used all the time
فتح الحزمة
افتح القفل للوصول البطاقات البالغ عددها 198 في هذه المجموعة.
فتح الحزمة
k this deck
33
The general manager of a frozen TV dinner maker must decide which one of four new dinners to introduce to the market. He decides to perform an experiment to help make a decision. Each dinner is sampled by ten people who then rate the product on a 7-point scale, where 1 = poor, and 7 = excellent. The results are shown below. Which statistical technique the general manager can use to help him make a decision?
______________
Can the general manager infer at the 5% significance level that there are differences in the taste ratings of the four dinners?
Test Statistic: ______________
Reject Region:
Reject if test statistic > ______________
Conclude: ______________
The general manager ______________ infer at the 5% significance level that there are differences in the taste ratings of the four dinners.
Using the appropriate statistical table, what statement can be made about the p-value for this test?
______________
Which statistical technique the general manager can use to help him make a decision?______________
Can the general manager infer at the 5% significance level that there are differences in the taste ratings of the four dinners?
Test Statistic: ______________
Reject Region:
Reject
if test statistic > ______________Conclude: ______________
The general manager ______________ infer at the 5% significance level that there are differences in the taste ratings of the four dinners.
Using the appropriate statistical table, what statement can be made about the p-value for this test?
______________
فتح الحزمة
افتح القفل للوصول البطاقات البالغ عددها 198 في هذه المجموعة.
فتح الحزمة
k this deck
34
The Friedman test is applied to problems with the following characteristics:
A) the problem objective is to compare two or more populations
B) the data are either ordinal or interval but not nominal
C) the data are generated from a randomized block experiment
D) all of these
E) the problem objective is to compare two or more populations and the data are either ordinal or interval but not nominal
فتح الحزمة
افتح القفل للوصول البطاقات البالغ عددها 198 في هذه المجموعة.
فتح الحزمة
k this deck
35
If the Friedman test is applied to a data set that are generated from a randomized block experiment with 3 treatments and 5 blocks, then the rejection region at the 2.5% significance level is > 12.8325.
> 12.8325. فتح الحزمة
افتح القفل للوصول البطاقات البالغ عددها 198 في هذه المجموعة.
فتح الحزمة
k this deck
36
In a Friedman test for comparing four populations, provided that there as eight blocks, the test statistic is calculated as = 10.98. If the test is conducted at the 5% significance level, the conclusion and p-value will be:
A) reject the null hypothesis, and 0.01 < p-value < 0.025
B) reject the null hypothesis, and p-value > 0.025
C) do not reject the null hypothesis, and 0.025 < p-value < 0.05
D) do not reject the null hypothesis, and p-value < 0.05
E) reject the null hypothesis, p-value = 0
= 10.98. If the test is conducted at the 5% significance level, the conclusion and p-value will be:A) reject the null hypothesis, and 0.01 < p-value < 0.025
B) reject the null hypothesis, and p-value > 0.025
C) do not reject the null hypothesis, and 0.025 < p-value < 0.05
D) do not reject the null hypothesis, and p-value < 0.05
E) reject the null hypothesis, p-value = 0
فتح الحزمة
افتح القفل للوصول البطاقات البالغ عددها 198 في هذه المجموعة.
فتح الحزمة
k this deck
37
We can use the Friedman test to determine whether two populations differ. The conclusion will be the same as that produced from the sign test.
فتح الحزمة
افتح القفل للوصول البطاقات البالغ عددها 198 في هذه المجموعة.
فتح الحزمة
k this deck
38
The Friedman test statistic is approximately chi-squared distributed with (k - 1) degrees of freedom, provided that either the number of blocks b or the number of treatments k is greater than or equal to 5.
فتح الحزمة
افتح القفل للوصول البطاقات البالغ عددها 198 في هذه المجموعة.
فتح الحزمة
k this deck
39
The nonparametric counterpart of the randomized block model of the analysis of variance is the:
A) Kruskal-Wallis test
B) Friedman test
C) Wilcoxon rank sum test
D) Wilcoxon signed rank sum test
E) Wilcoxon rank sum test and Wilcoxon signed rank sum test
A) Kruskal-Wallis test
B) Friedman test
C) Wilcoxon rank sum test
D) Wilcoxon signed rank sum test
E) Wilcoxon rank sum test and Wilcoxon signed rank sum test
فتح الحزمة
افتح القفل للوصول البطاقات البالغ عددها 198 في هذه المجموعة.
فتح الحزمة
k this deck
40
A nonparametric method to compare two or more populations, when the samples are matched pairs and the data are either ordinal or interval but not normal, is:
A) the Wilcoxon signed rank sum test
B) the sign test
C) the Friedman test
D) the Kruskal-Wallis test
E) none of these
A) the Wilcoxon signed rank sum test
B) the sign test
C) the Friedman test
D) the Kruskal-Wallis test
E) none of these
فتح الحزمة
افتح القفل للوصول البطاقات البالغ عددها 198 في هذه المجموعة.
فتح الحزمة
k this deck
41
Apply the Friedman test to the accompany table of ordinal data to determine whether we can infer at the 10% significance level that at least two population locations differ. Test Statistic: = ______________
Reject Region:
Reject if > ______________
Conclude: ______________
We ______________ infer at the 10% significance level that at least two population locations differ.
Test Statistic: = ______________Reject Region:
Reject
if > ______________Conclude: ______________
We ______________ infer at the 10% significance level that at least two population locations differ.
فتح الحزمة
افتح القفل للوصول البطاقات البالغ عددها 198 في هذه المجموعة.
فتح الحزمة
k this deck
42
The Kruskal-Wallis test can be used to determine whether a difference exists between two populations. However, to determine whether one population location is larger than another, we must apply the Wilcoxon rank sum test.
فتح الحزمة
افتح القفل للوصول البطاقات البالغ عددها 198 في هذه المجموعة.
فتح الحزمة
k this deck
43
A one-sample t-test corresponds to a Kruskal-Wallis test.
فتح الحزمة
افتح القفل للوصول البطاقات البالغ عددها 198 في هذه المجموعة.
فتح الحزمة
k this deck
44
The Kruskal-Wallis test can be conducted as one or two-tail test.
فتح الحزمة
افتح القفل للوصول البطاقات البالغ عددها 198 في هذه المجموعة.
فتح الحزمة
k this deck
45
The Kruskal-Wallis test can be used to test for a difference between two populations. It will produce the same outcome as the two-tail Wilcoxon rank sum test.
فتح الحزمة
افتح القفل للوصول البطاقات البالغ عددها 198 في هذه المجموعة.
فتح الحزمة
k this deck
46
In all applications of the Kruskal-Wallis test, the alternative hypothesis to be tested is always stated as:
A) the locations of all k populations are the same
B) at least two population locations differ
C) the locations of all w populations differ
D) the locations of all k populations differ
E) at least two population locations are the same
A) the locations of all k populations are the same
B) at least two population locations differ
C) the locations of all w populations differ
D) the locations of all k populations differ
E) at least two population locations are the same
فتح الحزمة
افتح القفل للوصول البطاقات البالغ عددها 198 في هذه المجموعة.
فتح الحزمة
k this deck
47
In a Kruskal-Wallis test for comparing three populations, the test statistic is calculated as H = 2.80. If the test is conducted at the 5% significance level, then:
A) the null hypothesis will be rejected
B) the null hypothesis will not be rejected
C) the alternative hypothesis will not be rejected
D) the test results are inconclusive
E) the t-test for matched pairs must be used
A) the null hypothesis will be rejected
B) the null hypothesis will not be rejected
C) the alternative hypothesis will not be rejected
D) the test results are inconclusive
E) the t-test for matched pairs must be used
فتح الحزمة
افتح القفل للوصول البطاقات البالغ عددها 198 في هذه المجموعة.
فتح الحزمة
k this deck
48
In a Kruskal-Wallis test, there are five samples, and the value of the test statistic is calculated as H = 12.32. Then the most accurate statement that can be made about the p-value of the test is that it is greater than 0.025 but smaller than 0.05.
فتح الحزمة
افتح القفل للوصول البطاقات البالغ عددها 198 في هذه المجموعة.
فتح الحزمة
k this deck
49
The normal approximation to the Wilcoxon signed rank sum test is used whenever the number of none zero differences is 50 or more.
فتح الحزمة
افتح القفل للوصول البطاقات البالغ عددها 198 في هذه المجموعة.
فتح الحزمة
k this deck
50
The critical value is taken from the F-distribution whenever the test is a Kruskal-Wallis test.
فتح الحزمة
افتح القفل للوصول البطاقات البالغ عددها 198 في هذه المجموعة.
فتح الحزمة
k this deck
51
The Kruskal-Wallis test is applied to compare two or more populations, when the samples are independent and the data are either ordinal or interval but not normal.
فتح الحزمة
افتح القفل للوصول البطاقات البالغ عددها 198 في هذه المجموعة.
فتح الحزمة
k this deck
52
A one-sample t-test is the parametric counterpart of the Kruskal-Wallis test.
فتح الحزمة
افتح القفل للوصول البطاقات البالغ عددها 198 في هذه المجموعة.
فتح الحزمة
k this deck
53
Kruskal-Wallis test is a nonparametric test that can be used to compare more than two independent samples when the assumptions for an analysis of variance are invalid.
فتح الحزمة
افتح القفل للوصول البطاقات البالغ عددها 198 في هذه المجموعة.
فتح الحزمة
k this deck
54
The nonparametric counterpart of the parametric one-way analysis of variance F-test is the:
A) Kruskal-Wallis test
B) Friedman test
C) Wilcoxon rank sum test
D) Wilcoxon signed rank sum test
E) two-tailed t-test
A) Kruskal-Wallis test
B) Friedman test
C) Wilcoxon rank sum test
D) Wilcoxon signed rank sum test
E) two-tailed t-test
فتح الحزمة
افتح القفل للوصول البطاقات البالغ عددها 198 في هذه المجموعة.
فتح الحزمة
k this deck
55
In a Kruskal-Wallis test, there are four samples, and the value of the test statistic is calculated as H = 13.21. Then the most accurate statement that can be made about the p-value of the test is that it is greater than 0.005 but smaller than 0.01.
فتح الحزمة
افتح القفل للوصول البطاقات البالغ عددها 198 في هذه المجموعة.
فتح الحزمة
k this deck
56
In a Kruskal-Wallis test, there are three samples, and the value of the test statistic is calculated as H = 7.378. Then the p-value of the test is 0.025.
فتح الحزمة
افتح القفل للوصول البطاقات البالغ عددها 198 في هذه المجموعة.
فتح الحزمة
k this deck
57
The Kruskal-Wallis test is always:
A) one-tail
B) two-tail
C) used with one sample
D) used with only two samples
E) used when the populations are normally distributed
A) one-tail
B) two-tail
C) used with one sample
D) used with only two samples
E) used when the populations are normally distributed
فتح الحزمة
افتح القفل للوصول البطاقات البالغ عددها 198 في هذه المجموعة.
فتح الحزمة
k this deck
58
The Kruskal-Wallis Test for Differences in more than 2 Medians is a nonparametric alternative to:
A) ANOVA F test for completely randomized experiments
B) Student's t-test for related samples
C) Student's t-test for independent samples
D) Wilcoxon's Rank Sum Test for differences in two medians
E) Student's t-test for related samples and Student's t-test for independent samples
A) ANOVA F test for completely randomized experiments
B) Student's t-test for related samples
C) Student's t-test for independent samples
D) Wilcoxon's Rank Sum Test for differences in two medians
E) Student's t-test for related samples and Student's t-test for independent samples
فتح الحزمة
افتح القفل للوصول البطاقات البالغ عددها 198 في هذه المجموعة.
فتح الحزمة
k this deck
59
The Kruskal-Wallis H test is an extension of the Wilcoxon rank-sum test from two to more than two statistical populations.
فتح الحزمة
افتح القفل للوصول البطاقات البالغ عددها 198 في هذه المجموعة.
فتح الحزمة
k this deck
60
The Kruskal-Wallis test is an extension of the Wilcoxon rank-sum test from two to more than two statistical populations.
فتح الحزمة
افتح القفل للوصول البطاقات البالغ عددها 198 في هذه المجموعة.
فتح الحزمة
k this deck
61
The Wilcoxon signed rank test is a nonparametric test that uses the directions of differences observed in a matched-pairs sample to determine whether the relative frequency distributions of two statistical populations are identical to or different from one another.
فتح الحزمة
افتح القفل للوصول البطاقات البالغ عددها 198 في هذه المجموعة.
فتح الحزمة
k this deck
62
The Wilcoxon signed rank test is applied to compare two populations, when the samples are matched pairs and the data are interval but not normally distributed.
فتح الحزمة
افتح القفل للوصول البطاقات البالغ عددها 198 في هذه المجموعة.
فتح الحزمة
k this deck
63
A computer laboratory manager was interested in whether there was a difference in functioning time before needing to be recharged for three battery packs for laptop computers. The manager took a random sample of six battery packs of each brand and tested them. The results, in hours of functioning before needing to be recharged, were recorded as The manager, unsure that the assumptions for the usual parametric analysis of variance were valid, decided to employ nonparametric methods. Use the appropriate nonparametric procedure to determine whether the distribution of functioning time before needing to be recharged is the same for the three brands of battery packs. Use = 0.05.
Test Statistic:
H = ______________
What is the critical value for the test statistic?
Reject if the test statistic > ______________.
Conclude: ______________
There ______________ sufficient evidence at = 0.05 to say that at least two of the distributions of functioning times before battery needing to be recharged differ in location.
The manager, unsure that the assumptions for the usual parametric analysis of variance were valid, decided to employ nonparametric methods. Use the appropriate nonparametric procedure to determine whether the distribution of functioning time before needing to be recharged is the same for the three brands of battery packs. Use = 0.05.Test Statistic:
H = ______________
What is the critical value for the test statistic?
Reject
if the test statistic > ______________.Conclude: ______________
There ______________ sufficient evidence at
= 0.05 to say that at least two of the distributions of functioning times before battery needing to be recharged differ in location. فتح الحزمة
افتح القفل للوصول البطاقات البالغ عددها 198 في هذه المجموعة.
فتح الحزمة
k this deck
64
Apply the Kruskal-Wallis test to determine if there is enough evidence at the 5% significance level to infer that at least two populations differ. Test statistic: H = ______________
Reject if H > ______________
Conclude: ______________
There ______________ enough evidence at the 5% significance level to infer that at least two populations differ.
Test statistic: H = ______________Reject
if H > ______________Conclude: ______________
There ______________ enough evidence at the 5% significance level to infer that at least two populations differ.
فتح الحزمة
افتح القفل للوصول البطاقات البالغ عددها 198 في هذه المجموعة.
فتح الحزمة
k this deck
65
A two-independent sample t-test corresponds to a Wilcoxon signed rank test for paired samples.
فتح الحزمة
افتح القفل للوصول البطاقات البالغ عددها 198 في هذه المجموعة.
فتح الحزمة
k this deck
66
In a Kruskal-Wallis test, there are four samples and the value of the test statistic is calculated as H = 8.79. The most accurate statement that can be made about the p-value is that:
A) it is greater than 0.10
B) it is greater than 0.05 but smaller than 0.10
C) it is greater than 0.05
D) it is greater than 0.025 but smaller than 0.05
E) it is less than 0.025
A) it is greater than 0.10
B) it is greater than 0.05 but smaller than 0.10
C) it is greater than 0.05
D) it is greater than 0.025 but smaller than 0.05
E) it is less than 0.025
فتح الحزمة
افتح القفل للوصول البطاقات البالغ عددها 198 في هذه المجموعة.
فتح الحزمة
k this deck
67
An experiment was conducted to examine the effect of age on heart rate when a person is subjected to a specific amount of exercise. Ten men randomly selected from each of four age groups: 10-19, 20-39, 40-59, and 60-69. Each man walked a treadmill at a fixed grade for a period of 12 minutes, and the increase in heart rate (the difference before and after exercise) was recorded (in beats per minute). The data are shown in the table. Do the data present sufficient evidence to indicate differences in location for at least two of the four age groups? Test using the Kruskal-Wallis H test with = 0.01.
What is H?
______________
What is the critical value for the test statistic?
Reject if H > ______________
Conclude: ______________
There is ______________ of a difference in location.
Find the approximate p-value for the test above.
______________
Do the data present sufficient evidence to indicate differences in location for at least two of the four age groups? Test using the Kruskal-Wallis H test with = 0.01.What is H?
______________
What is the critical value for the test statistic?
Reject
if H > ______________Conclude: ______________
There is ______________ of a difference in location.
Find the approximate p-value for the test above.
______________
فتح الحزمة
افتح القفل للوصول البطاقات البالغ عددها 198 في هذه المجموعة.
فتح الحزمة
k this deck
68
A movie critic wanted to determine whether or not moviegoers of different age groups evaluated a movie differently. With this objective, he commissioned a survey that asked people their ratings of the most recently watched movies. The rating categories were: 1 = terrible, 2 = fair, 3 = good, and 4 = excellent. Each respondent was also asked to categorize his or her age as either: 1 = teenager, 2 = young adult (20-34), 3 = middle age (35-50), and 4 = senior (over 50). The results are shown below. Do these data provide sufficient evidence to infer at the 5% significance level that there were differences in ratings among the different age categories?
Test statistic:
H = ______________
What is the critical value for the test statistic?
Reject if the test statistic > ______________.
Conclude: ______________
There ______________ sufficient evidence to infer at the 5% significance level that there were differences in ratings among the different age categories.
What statement can be made about the p-value for this test?
______________
Do these data provide sufficient evidence to infer at the 5% significance level that there were differences in ratings among the different age categories?Test statistic:
H = ______________
What is the critical value for the test statistic?
Reject
if the test statistic > ______________.Conclude: ______________
There ______________ sufficient evidence to infer at the 5% significance level that there were differences in ratings among the different age categories.
What statement can be made about the p-value for this test?
______________
فتح الحزمة
افتح القفل للوصول البطاقات البالغ عددها 198 في هذه المجموعة.
فتح الحزمة
k this deck
69
The Kruskal-Wallis test statistic can be approximated by a chi-squared distribution with k - 1 degrees of freedom (where k is the number of populations) whenever the sample sizes are all greater than or equal to:
A) 5
B) 15
C) 25
D) 30
E) 45
A) 5
B) 15
C) 25
D) 30
E) 45
فتح الحزمة
افتح القفل للوصول البطاقات البالغ عددها 198 في هذه المجموعة.
فتح الحزمة
k this deck
70
In a Kruskal-Wallis test to determine whether differences exist among three different advertisements, the following statistics were obtained: Conduct the test at the 5% significance level.
Test statistic: H = ______________
Reject if H > ______________
Conclude: ______________
There ______________ enough evidence to conclude that differences exist among three different advertisements.
What is the most accurate statement that can be made about the p-value of this test?
______________
Conduct the test at the 5% significance level.Test statistic: H = ______________
Reject
if H > ______________Conclude: ______________
There ______________ enough evidence to conclude that differences exist among three different advertisements.
What is the most accurate statement that can be made about the p-value of this test?
______________
فتح الحزمة
افتح القفل للوصول البطاقات البالغ عددها 198 في هذه المجموعة.
فتح الحزمة
k this deck
71
The critical value is taken from the F-distribution whenever the Wilcoxon signed rank test is employed.
فتح الحزمة
افتح القفل للوصول البطاقات البالغ عددها 198 في هذه المجموعة.
فتح الحزمة
k this deck
72
A nonparametric method to compare two or more populations, when the samples are independent and the data are either ordinal or interval but not normal, is the:
A) Kruskal-Wallis test
B) Friedman test
C) Wilcoxon rank sum test
D) Wilcoxon signed rank sum test
E) chi-square test
A) Kruskal-Wallis test
B) Friedman test
C) Wilcoxon rank sum test
D) Wilcoxon signed rank sum test
E) chi-square test
فتح الحزمة
افتح القفل للوصول البطاقات البالغ عددها 198 في هذه المجموعة.
فتح الحزمة
k this deck
73
Suppose there is interest in comparing the median response time for three independent groups learning a new specific task. The appropriate nonparametric procedure is:
A) the Wilcoxon Rank Sums Test
B) the Wilcoxon Signed Rank Test
C) the Kruskal-Wallis Test for Differences in Medians
D) the Friedman test
E) none of these
A) the Wilcoxon Rank Sums Test
B) the Wilcoxon Signed Rank Test
C) the Kruskal-Wallis Test for Differences in Medians
D) the Friedman test
E) none of these
فتح الحزمة
افتح القفل للوصول البطاقات البالغ عددها 198 في هذه المجموعة.
فتح الحزمة
k this deck
74
A one-sample t-test is the parametric counterpart of the Wilcoxon signed rank test for matched pairs.
فتح الحزمة
افتح القفل للوصول البطاقات البالغ عددها 198 في هذه المجموعة.
فتح الحزمة
k this deck
75
The marketing manager of a pizza chain is in the process of examining some of the demographic characteristics of her customers. In particular, she would like to investigate the belief that the ages of the customers of pizza parlors, hamburger emporiums, and fast-food chicken restaurants are different. As an experiment, the ages of eight customers of each of the restaurants are recorded and listed below. From previous analysis we know that the ages are not normally distributed. Do these data provide enough evidence at the 10% significance level to infer that there are differences in ages among the customers of the three restaurants?
Test statistic: H = ______________
Reject if H > ______________
Conclude: ______________
There ______________ enough evidence at the 10% significance level to infer that there are differences in ages among the customers of the three restaurants.
Do these data provide enough evidence at the 10% significance level to infer that there are differences in ages among the customers of the three restaurants?Test statistic: H = ______________
Reject
if H > ______________Conclude: ______________
There ______________ enough evidence at the 10% significance level to infer that there are differences in ages among the customers of the three restaurants.
فتح الحزمة
افتح القفل للوصول البطاقات البالغ عددها 198 في هذه المجموعة.
فتح الحزمة
k this deck
76
Three treatments were compared using a completely randomized design. The data are shown in the table. Do the data provide sufficient evidence to indicate a difference in location for at least two of the population distributions? Test using the Kruskal-Wallis H statistic with = 0.05.
Test statistic:
H = ______________
What is the critical value for the test statistic?
Reject if the test statistic > ______________.
Conclude: ______________
There ______________ a difference in location among the three treatments.
Do the data provide sufficient evidence to indicate a difference in location for at least two of the population distributions? Test using the Kruskal-Wallis H statistic with = 0.05.Test statistic:
H = ______________
What is the critical value for the test statistic?
Reject
if the test statistic > ______________.Conclude: ______________
There ______________ a difference in location among the three treatments.
فتح الحزمة
افتح القفل للوصول البطاقات البالغ عددها 198 في هذه المجموعة.
فتح الحزمة
k this deck
77
Which of the following distributions approximate Kruskal-Wallis test statistic H when the problem objective is to compare k distributions and the sample sizes are greater than or equal to 5?
A) normal distribution
B) chi-squared distribution with k - 1 degrees of freedom
C) Student t-distribution with k - 2 degrees of freedom
D) Student t-distribution with k - 3 degrees of freedom
E) either chi-squared distribution with k - 5 degrees of freedom or Student t distribution with k + 5 degrees of freedom
فتح الحزمة
افتح القفل للوصول البطاقات البالغ عددها 198 في هذه المجموعة.
فتح الحزمة
k this deck
78
The Wilcoxon signed rank test for matched pairs is the nonparametric counterpart of the paired two-sample t-test of .
. فتح الحزمة
افتح القفل للوصول البطاقات البالغ عددها 198 في هذه المجموعة.
فتح الحزمة
k this deck
79
Two different workbooks and two distinct teaching machines were to be evaluated on their effectiveness in teaching the concept of multiplication. A fourth grade class of 24 subjects was randomly assigned to 4 groups and each group in turn was randomly assigned to a teaching method. A test was given and the number of errors was recorded. This problem uses the Kruskal-Wallis H test to see if the number of errors differs from one teaching method to another. What is the value of H in this problem?
______________
Find the rejection region for = 0.05.
Reject if H > ______________
Conclude: ______________
There is ______________ evidence at = 0.05 to say that the number of errors differs from one teaching method to another.
What is the p-value for this test?
______________
What is the value of H in this problem?______________
Find the rejection region for
= 0.05.Reject
if H > ______________Conclude: ______________
There is ______________ evidence at
= 0.05 to say that the number of errors differs from one teaching method to another.What is the p-value for this test?
______________
فتح الحزمة
افتح القفل للوصول البطاقات البالغ عددها 198 في هذه المجموعة.
فتح الحزمة
k this deck
80
The Wilcoxon signed-rank test is a nonparametric test that 1) uses the directions of differences observed in a matched pairs sample to determine whether the relative frequency distributions of two statistical populations are identical to or different from one another and 2) determines whether a sample comes from a population with a specified median.
فتح الحزمة
افتح القفل للوصول البطاقات البالغ عددها 198 في هذه المجموعة.
فتح الحزمة
k this deck
فتح الحزمة
افتح القفل للوصول البطاقات البالغ عددها 198 في هذه المجموعة.


