Deck 2: Basic Descriptive Statistics: Tables, Percentages, Ratios and Rates, and Graphs
ملء الشاشة (f)
سؤال
Problems are labeled with the social science discipline from which they are drawn: SOC is for sociology, SW is for social work, PS is for Political Science, CJ is for Criminal Justice, PA is for Public Administration, and GER is for Gerontology.
SOC: The tables that follow report the marital status of 20 respondents in two different apartment complexes.
Read each of the following problems carefully before constructing the fraction and solving for the answer. (HINT: Make sure you have the correct numbers in the numerator and denominator before solving these problems. For example, problem 2.1a asks which "percentage of the respondents at each complex are married" and the denominators will be 20 for these two fractions. On the other hand, problem 2.1d, asks which "percentage of the single respondents live in Complex B" and the denominator for this fraction will be 4 + 6, or 10.)
a. What percentage of the respondents at each complex are married?
b. What is the ratio of single to married respondents at each complex?
c. What proportion of each sample are widowed?
d. What percentage of the single respondents live in Complex B?
e. What is the ratio of the unmarried/living together to the married at each complex?
سؤال
Problems are labeled with the social science discipline from which they are drawn: SOC is for sociology, SW is for social work, PS is for Political Science, CJ is for Criminal Justice, PA is for Public Administration, and GER is for Gerontology.
SOC: At St. Algebra College, the numbers of males and females in the various major fields of study are:
Read each of the following problems carefully before constructing the fraction and solving for the answer. (HINT: Be sure you place the proper number in the denominator of the fractions. For example, some problems use the total number of males or females as the denominator, whereas others use the total number of majors.)
a. What percentage of social science majors are male?
b. What proportion of business majors are female?
c. For the humanities, what is the ratio of males to females?
d. What percentage of the total student body are males?
e. What is the ratio of males to females for the entire sample?
f. What proportion of the nursing majors are male?
g. What percentage of the sample are social science majors?
h. What is the ratio of humanities majors to business majors?
i. What is the ratio of female business majors to female nursing majors?
j. What proportion of the males are education majors?
سؤال
سؤال
Problems are labeled with the social science discipline from which they are drawn: SOC is for sociology, SW is for social work, PS is for Political Science, CJ is for Criminal Justice, PA is for Public Administration, and GER is for Gerontology.
CJ: The numbers of homicides in five states and five Canadian provinces for the years 1997 and 2009 were:
a. Calculate the homicide rate per 100,000 population for each state and each province for each year. Relatively speaking, which state and which province had the highest homicide rates in each year? Which nation seems to have the higher homicide rate? Write a paragraph describing these results.
b. Using the rates you calculated in part a, calculate the percent change between 1997 and 2009 for each state and each province. Which states and provinces had the largest increase and decrease? Which nation seems to have the largest change in homicide rates? Summarize your results in a paragraph.
سؤال
Problems are labeled with the social science discipline from which they are drawn: SOC is for sociology, SW is for social work, PS is for Political Science, CJ is for Criminal Justice, PA is for Public Administration, and GER is for Gerontology.
SOC: The scores of 15 respondents on four variables are as reported below. These scores were taken from a public opinion survey called the General Social Survey, or the GSS. This data set is used for the computer exercises in this text. Small subsamples from the GSS will be used throughout the text to provide "real" data for problems. For the actual questions and other details, see Appendix G. The numerical codes for the variables are:
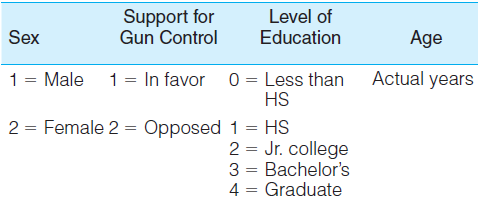
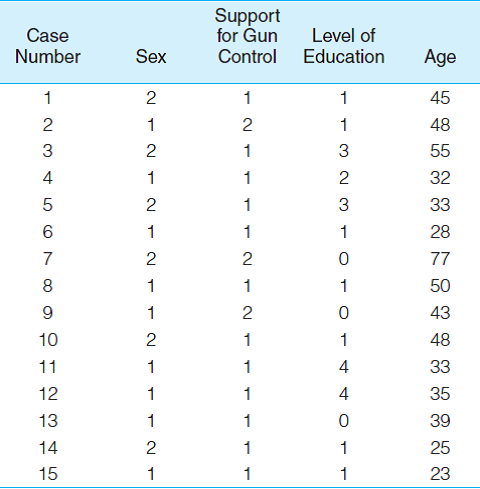
a. Construct a frequency distribution for each variable. Include a column for percentages.
b. Construct pie and bar charts to display the distributions of sex, support for gun control, and level of education.
SOC: The scores of 15 respondents on four variables are as reported below. These scores were taken from a public opinion survey called the General Social Survey, or the GSS. This data set is used for the computer exercises in this text. Small subsamples from the GSS will be used throughout the text to provide "real" data for problems. For the actual questions and other details, see Appendix G. The numerical codes for the variables are:
a. Construct a frequency distribution for each variable. Include a column for percentages.
b. Construct pie and bar charts to display the distributions of sex, support for gun control, and level of education.
سؤال
Problems are labeled with the social science discipline from which they are drawn: SOC is for sociology, SW is for social work, PS is for Political Science, CJ is for Criminal Justice, PA is for Public Administration, and GER is for Gerontology.
SW: A local youth service agency has begun a sex education program for teenage girls who have been referred by the juvenile courts. The girls were given a 20-item test for general knowledge about sex, contraception, and anatomy and physiology on admission to the program and again after completing the program. The scores of the first 15 girls to complete the program are:
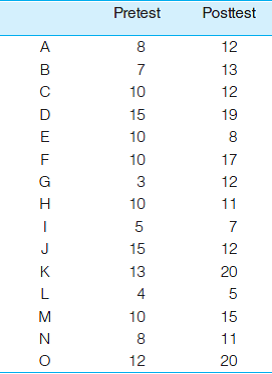
Construct frequency distributions for the pretest and posttest scores. Include a column for percentages. (HINT: There were 20 items on the test, so the maximum range for these scores is 20. If you use 10 class intervals to display these scores, the interval size will be 2. Because there are no scores of 0 or 1 for either test, you may state the first interval as 2-3. To make comparisons easier, both frequency distributions should have the same intervals.)
SW: A local youth service agency has begun a sex education program for teenage girls who have been referred by the juvenile courts. The girls were given a 20-item test for general knowledge about sex, contraception, and anatomy and physiology on admission to the program and again after completing the program. The scores of the first 15 girls to complete the program are:
Construct frequency distributions for the pretest and posttest scores. Include a column for percentages. (HINT: There were 20 items on the test, so the maximum range for these scores is 20. If you use 10 class intervals to display these scores, the interval size will be 2. Because there are no scores of 0 or 1 for either test, you may state the first interval as 2-3. To make comparisons easier, both frequency distributions should have the same intervals.)
سؤال
Problems are labeled with the social science discipline from which they are drawn: SOC is for sociology, SW is for social work, PS is for Political Science, CJ is for Criminal Justice, PA is for Public Administration, and GER is for Gerontology.
SOC: Sixteen high school students completed a class to prepare them for the college boards. Their scores were:
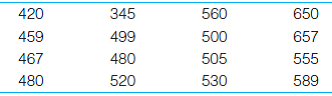
These same 16 students were given a test of math and verbal ability to measure their readiness for college level work. Scores are reported here in terms of the percentage of correct answers for each test.
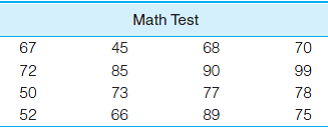
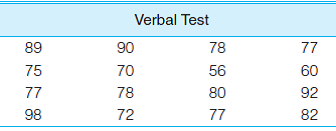
a. Display each of these variables in a frequency distribution with columns for percentages and cumulative percentages.
b. Construct a histogram and frequency polygon for this data.
SOC: Sixteen high school students completed a class to prepare them for the college boards. Their scores were:
These same 16 students were given a test of math and verbal ability to measure their readiness for college level work. Scores are reported here in terms of the percentage of correct answers for each test.
a. Display each of these variables in a frequency distribution with columns for percentages and cumulative percentages.
b. Construct a histogram and frequency polygon for this data.
سؤال
Problems are labeled with the social science discipline from which they are drawn: SOC is for sociology, SW is for social work, PS is for Political Science, CJ is for Criminal Justice, PA is for Public Administration, and GER is for Gerontology.
GER: The reported number of times 25 residents of a community for senior citizens left their homes for any reason during the past week:
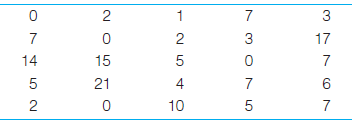
a. Construct a frequency distribution to display these data.
b. What are the midpoints of the class intervals?
c. Add columns to the table to display the percentage distribution, cumulative frequency, and cumulative percentage.
d. Construct a histogram and a frequency polygon to display this distribution. e. Write a paragraph summarizing this distribution of scores.
GER: The reported number of times 25 residents of a community for senior citizens left their homes for any reason during the past week:
a. Construct a frequency distribution to display these data.
b. What are the midpoints of the class intervals?
c. Add columns to the table to display the percentage distribution, cumulative frequency, and cumulative percentage.
d. Construct a histogram and a frequency polygon to display this distribution. e. Write a paragraph summarizing this distribution of scores.
سؤال
Problems are labeled with the social science discipline from which they are drawn: SOC is for sociology, SW is for social work, PS is for Political Science, CJ is for Criminal Justice, PA is for Public Administration, and GER is for Gerontology.
SOC: Twenty-five students completed a questionnaire that measured their attitudes toward interpersonal violence. Respondents who scored high believed that a person could legitimately use physical force against another person in many situations. Respondents who scored low believed that the use of violence could be justified in few or no situations.
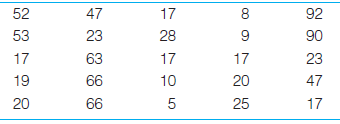
a. Construct a frequency distribution to display this data.
b. What are the midpoints of the class intervals?
c. Add columns to the table to display the percentage distribution, cumulative frequency, and cumulative percentage.
d. Construct a histogram and a frequency polygon to display these data.
e. Write a paragraph summarizing this distribution of scores.
SOC: Twenty-five students completed a questionnaire that measured their attitudes toward interpersonal violence. Respondents who scored high believed that a person could legitimately use physical force against another person in many situations. Respondents who scored low believed that the use of violence could be justified in few or no situations.
a. Construct a frequency distribution to display this data.
b. What are the midpoints of the class intervals?
c. Add columns to the table to display the percentage distribution, cumulative frequency, and cumulative percentage.
d. Construct a histogram and a frequency polygon to display these data.
e. Write a paragraph summarizing this distribution of scores.
سؤال
Problems are labeled with the social science discipline from which they are drawn: SOC is for sociology, SW is for social work, PS is for Political Science, CJ is for Criminal Justice, PA is for Public Administration, and GER is for Gerontology.
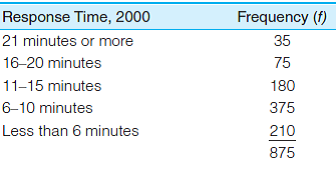
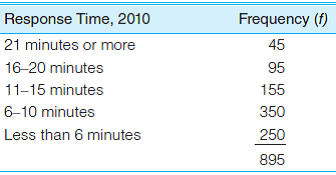
PA/CJ: As part of an evaluation of the efficiency of your local police force, you have gathered the following data on police response time to calls for assistance during two different years. (Response times were rounded off to whole minutes.) Convert both frequency distributions into percentages, and construct pie charts and bar charts to display the data. Write a paragraph comparing the changes in response time between the two years.
PA/CJ: As part of an evaluation of the efficiency of your local police force, you have gathered the following data on police response time to calls for assistance during two different years. (Response times were rounded off to whole minutes.) Convert both frequency distributions into percentages, and construct pie charts and bar charts to display the data. Write a paragraph comparing the changes in response time between the two years.
سؤال
Problems are labeled with the social science discipline from which they are drawn: SOC is for sociology, SW is for social work, PS is for Political Science, CJ is for Criminal Justice, PA is for Public Administration, and GER is for Gerontology.
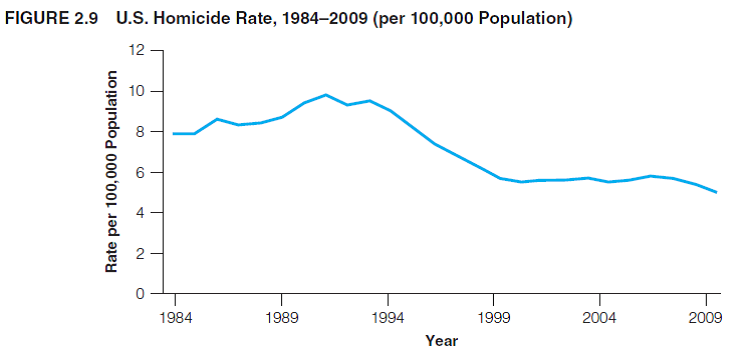
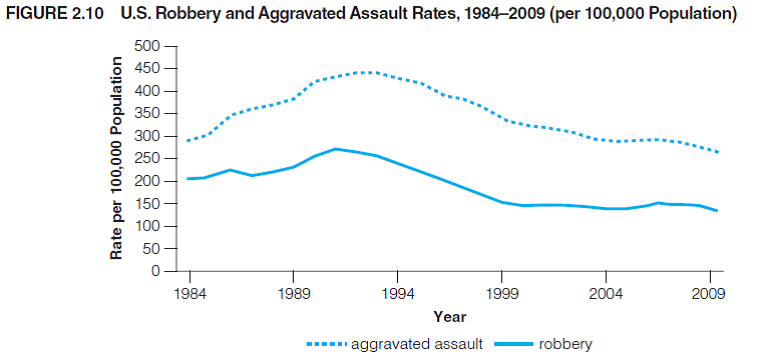
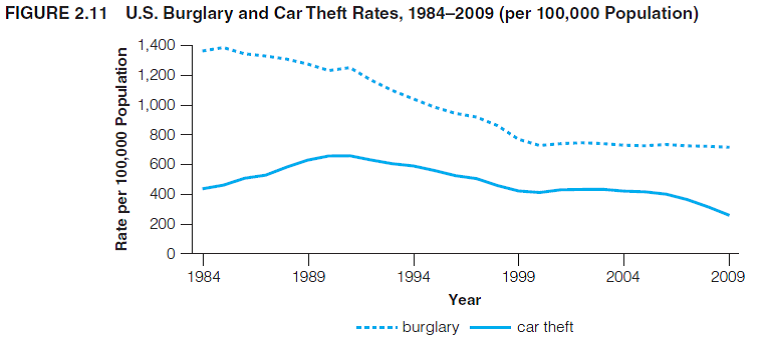
SOC: Figures 2.9 through 2.11 display trends in crime in the United States over the last two decades. Write a paragraph describing each of these graphs. What similarities and differences can you observe among the three graphs? (For example, do crime rates always change in the same direction?) Note the differences in the vertical axes from chart to chart; for homicide, the axis ranges from 0 to 12, while for burglary and auto theft, the range is from 0 to 1,600. The latter crimes are far more common, and a scale with smaller intervals is needed to display the rates.
SOC: Figures 2.9 through 2.11 display trends in crime in the United States over the last two decades. Write a paragraph describing each of these graphs. What similarities and differences can you observe among the three graphs? (For example, do crime rates always change in the same direction?) Note the differences in the vertical axes from chart to chart; for homicide, the axis ranges from 0 to 12, while for burglary and auto theft, the range is from 0 to 1,600. The latter crimes are far more common, and a scale with smaller intervals is needed to display the rates.
سؤال
Problems are labeled with the social science discipline from which they are drawn: SOC is for sociology, SW is for social work, PS is for Political Science, CJ is for Criminal Justice, PA is for Public Administration, and GER is for Gerontology.
PA: A city's Department of Transportation has been keeping track of accidents on a particularly dangerous stretch of highway. Early in the year, the city lowered the speed limit on this highway and increased police patrols. Data on the number of accidents before and after the changes are presented here. Did the changes work? Is the highway safer? Construct a line chart to display these two sets of data (use graphics software if available), and write a paragraph describing the changes.
PA: A city's Department of Transportation has been keeping track of accidents on a particularly dangerous stretch of highway. Early in the year, the city lowered the speed limit on this highway and increased police patrols. Data on the number of accidents before and after the changes are presented here. Did the changes work? Is the highway safer? Construct a line chart to display these two sets of data (use graphics software if available), and write a paragraph describing the changes.

فتح الحزمة
قم بالتسجيل لفتح البطاقات في هذه المجموعة!
Unlock Deck
Unlock Deck
1/12
العب
ملء الشاشة (f)
Deck 2: Basic Descriptive Statistics: Tables, Percentages, Ratios and Rates, and Graphs
1
Problems are labeled with the social science discipline from which they are drawn: SOC is for sociology, SW is for social work, PS is for Political Science, CJ is for Criminal Justice, PA is for Public Administration, and GER is for Gerontology.
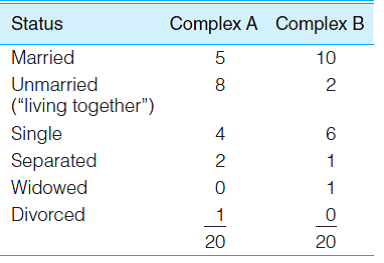
SOC: The tables that follow report the marital status of 20 respondents in two different apartment complexes.
Read each of the following problems carefully before constructing the fraction and solving for the answer. (HINT: Make sure you have the correct numbers in the numerator and denominator before solving these problems. For example, problem 2.1a asks which "percentage of the respondents at each complex are married" and the denominators will be 20 for these two fractions. On the other hand, problem 2.1d, asks which "percentage of the single respondents live in Complex B" and the denominator for this fraction will be 4 + 6, or 10.)
a. What percentage of the respondents at each complex are married?
b. What is the ratio of single to married respondents at each complex?
c. What proportion of each sample are widowed?
d. What percentage of the single respondents live in Complex B?
e. What is the ratio of the unmarried/living together to the married at each complex?
The given table follows that report the marital status of 20 respondents in two different complexes.
a)Calculate the percentage of the respondents at each complex A is married. Calculate the percentage of the respondents at each complex B is married.
  b)Calculate the ratio of single to married respondents at complex A.
  Calculate the ratio of single to married respondents at complex A.
  c)Calculate the proportions of each sample are widowed.
 d)Calculate the percentage of single respondents live in complex B.
  e)Calculate the ratio of the unmarried to the married respondents at complex A.
  Calculate the ratio of the unmarried to the married respondents at complex B.
a)Calculate the percentage of the respondents at each complex A is married.
Calculate the percentage of the respondents at each complex B is married. b)Calculate the ratio of single to married respondents at complex A. Calculate the ratio of single to married respondents at complex A. c)Calculate the proportions of each sample are widowed. d)Calculate the percentage of single respondents live in complex B. e)Calculate the ratio of the unmarried to the married respondents at complex A. Calculate the ratio of the unmarried to the married respondents at complex B. 2
Problems are labeled with the social science discipline from which they are drawn: SOC is for sociology, SW is for social work, PS is for Political Science, CJ is for Criminal Justice, PA is for Public Administration, and GER is for Gerontology.
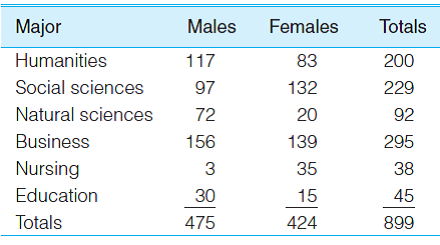
SOC: At St. Algebra College, the numbers of males and females in the various major fields of study are:
Read each of the following problems carefully before constructing the fraction and solving for the answer. (HINT: Be sure you place the proper number in the denominator of the fractions. For example, some problems use the total number of males or females as the denominator, whereas others use the total number of majors.)
a. What percentage of social science majors are male?
b. What proportion of business majors are female?
c. For the humanities, what is the ratio of males to females?
d. What percentage of the total student body are males?
e. What is the ratio of males to females for the entire sample?
f. What proportion of the nursing majors are male?
g. What percentage of the sample are social science majors?
h. What is the ratio of humanities majors to business majors?
i. What is the ratio of female business majors to female nursing majors?
j. What proportion of the males are education majors?
The given table follows that the numbers of males and females in the various major fields.
a)Calculate the percentages of social science majors are male. b)Calculate the proportions of business majors are female.
  c)For the humanities, calculate the ratio of males to females.
  d)Calculate the percentages of the total student body are males.
  e)Calculate the ratio of males to females for the entire sample.
  f)Calculate the proportions of the nursing majors are male.
  g)Calculate the percentages of the sample are social science majors.
  h)Calculate the ratio of humanities majors to business majors
  i)Calculate the ratio of female business majors to female nursing majors.
  j)Calculate the proportions of the males are education majors..
a)Calculate the percentages of social science majors are male.
b)Calculate the proportions of business majors are female. c)For the humanities, calculate the ratio of males to females. d)Calculate the percentages of the total student body are males. e)Calculate the ratio of males to females for the entire sample. f)Calculate the proportions of the nursing majors are male. g)Calculate the percentages of the sample are social science majors. h)Calculate the ratio of humanities majors to business majors i)Calculate the ratio of female business majors to female nursing majors. j)Calculate the proportions of the males are education majors.. 3
Problems are labeled with the social science discipline from which they are drawn: SOC is for sociology, SW is for social work, PS is for Political Science, CJ is for Criminal Justice, PA is for Public Administration, and GER is for Gerontology.
CJ: The town of Shinbone, Kansas, has a population of 211,732 and experienced 47 bank robberies, 13 murders, and 23 auto thefts during the past year. Compute a rate for each type of crime per 100,000 population. ( HINT: Make sure you set up the fraction with size of population in the denominator. )
CJ: The town of Shinbone, Kansas, has a population of 211,732 and experienced 47 bank robberies, 13 murders, and 23 auto thefts during the past year. Compute a rate for each type of crime per 100,000 population. ( HINT: Make sure you set up the fraction with size of population in the denominator. )
It is given the town has a population of 211,732 and experienced 47 bank robberies 13 murders, and 23 auto thefts during the past year.
Compute a rate for Bank robbery crime per 100,000 populations. Compute a rate for murders of crime per 100,000 populations.
  Compute a rate for Auto thefts of crime per 100,000 populations.
Compute a rate for Bank robbery crime per 100,000 populations.
Compute a rate for murders of crime per 100,000 populations. Compute a rate for Auto thefts of crime per 100,000 populations. 4
Problems are labeled with the social science discipline from which they are drawn: SOC is for sociology, SW is for social work, PS is for Political Science, CJ is for Criminal Justice, PA is for Public Administration, and GER is for Gerontology.
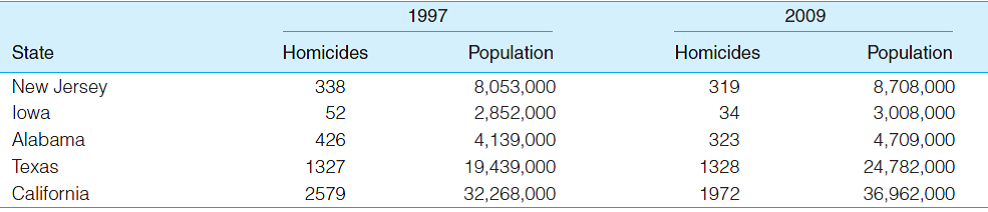
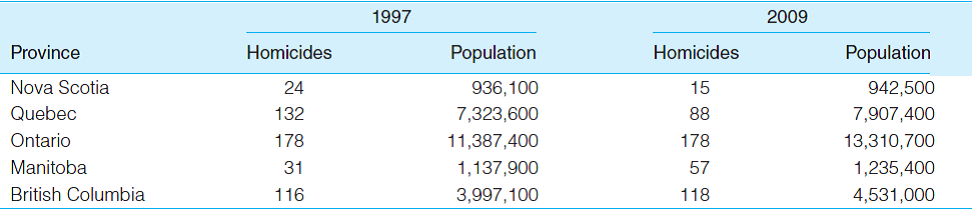
CJ: The numbers of homicides in five states and five Canadian provinces for the years 1997 and 2009 were:
a. Calculate the homicide rate per 100,000 population for each state and each province for each year. Relatively speaking, which state and which province had the highest homicide rates in each year? Which nation seems to have the higher homicide rate? Write a paragraph describing these results.
b. Using the rates you calculated in part a, calculate the percent change between 1997 and 2009 for each state and each province. Which states and provinces had the largest increase and decrease? Which nation seems to have the largest change in homicide rates? Summarize your results in a paragraph.
فتح الحزمة
افتح القفل للوصول البطاقات البالغ عددها 12 في هذه المجموعة.
فتح الحزمة
k this deck
5
Problems are labeled with the social science discipline from which they are drawn: SOC is for sociology, SW is for social work, PS is for Political Science, CJ is for Criminal Justice, PA is for Public Administration, and GER is for Gerontology.
SOC: The scores of 15 respondents on four variables are as reported below. These scores were taken from a public opinion survey called the General Social Survey, or the GSS. This data set is used for the computer exercises in this text. Small subsamples from the GSS will be used throughout the text to provide "real" data for problems. For the actual questions and other details, see Appendix G. The numerical codes for the variables are:
a. Construct a frequency distribution for each variable. Include a column for percentages.
b. Construct pie and bar charts to display the distributions of sex, support for gun control, and level of education.
فتح الحزمة
افتح القفل للوصول البطاقات البالغ عددها 12 في هذه المجموعة.
فتح الحزمة
k this deck
6
Problems are labeled with the social science discipline from which they are drawn: SOC is for sociology, SW is for social work, PS is for Political Science, CJ is for Criminal Justice, PA is for Public Administration, and GER is for Gerontology.
SW: A local youth service agency has begun a sex education program for teenage girls who have been referred by the juvenile courts. The girls were given a 20-item test for general knowledge about sex, contraception, and anatomy and physiology on admission to the program and again after completing the program. The scores of the first 15 girls to complete the program are:
Construct frequency distributions for the pretest and posttest scores. Include a column for percentages. (HINT: There were 20 items on the test, so the maximum range for these scores is 20. If you use 10 class intervals to display these scores, the interval size will be 2. Because there are no scores of 0 or 1 for either test, you may state the first interval as 2-3. To make comparisons easier, both frequency distributions should have the same intervals.)
فتح الحزمة
افتح القفل للوصول البطاقات البالغ عددها 12 في هذه المجموعة.
فتح الحزمة
k this deck
7
Problems are labeled with the social science discipline from which they are drawn: SOC is for sociology, SW is for social work, PS is for Political Science, CJ is for Criminal Justice, PA is for Public Administration, and GER is for Gerontology.
SOC: Sixteen high school students completed a class to prepare them for the college boards. Their scores were:
These same 16 students were given a test of math and verbal ability to measure their readiness for college level work. Scores are reported here in terms of the percentage of correct answers for each test.
a. Display each of these variables in a frequency distribution with columns for percentages and cumulative percentages.
b. Construct a histogram and frequency polygon for this data.
فتح الحزمة
افتح القفل للوصول البطاقات البالغ عددها 12 في هذه المجموعة.
فتح الحزمة
k this deck
8
Problems are labeled with the social science discipline from which they are drawn: SOC is for sociology, SW is for social work, PS is for Political Science, CJ is for Criminal Justice, PA is for Public Administration, and GER is for Gerontology.
GER: The reported number of times 25 residents of a community for senior citizens left their homes for any reason during the past week:
a. Construct a frequency distribution to display these data.
b. What are the midpoints of the class intervals?
c. Add columns to the table to display the percentage distribution, cumulative frequency, and cumulative percentage.
d. Construct a histogram and a frequency polygon to display this distribution. e. Write a paragraph summarizing this distribution of scores.
فتح الحزمة
افتح القفل للوصول البطاقات البالغ عددها 12 في هذه المجموعة.
فتح الحزمة
k this deck
9
Problems are labeled with the social science discipline from which they are drawn: SOC is for sociology, SW is for social work, PS is for Political Science, CJ is for Criminal Justice, PA is for Public Administration, and GER is for Gerontology.
SOC: Twenty-five students completed a questionnaire that measured their attitudes toward interpersonal violence. Respondents who scored high believed that a person could legitimately use physical force against another person in many situations. Respondents who scored low believed that the use of violence could be justified in few or no situations.
a. Construct a frequency distribution to display this data.
b. What are the midpoints of the class intervals?
c. Add columns to the table to display the percentage distribution, cumulative frequency, and cumulative percentage.
d. Construct a histogram and a frequency polygon to display these data.
e. Write a paragraph summarizing this distribution of scores.
فتح الحزمة
افتح القفل للوصول البطاقات البالغ عددها 12 في هذه المجموعة.
فتح الحزمة
k this deck
10
Problems are labeled with the social science discipline from which they are drawn: SOC is for sociology, SW is for social work, PS is for Political Science, CJ is for Criminal Justice, PA is for Public Administration, and GER is for Gerontology.
PA/CJ: As part of an evaluation of the efficiency of your local police force, you have gathered the following data on police response time to calls for assistance during two different years. (Response times were rounded off to whole minutes.) Convert both frequency distributions into percentages, and construct pie charts and bar charts to display the data. Write a paragraph comparing the changes in response time between the two years.
PA/CJ: As part of an evaluation of the efficiency of your local police force, you have gathered the following data on police response time to calls for assistance during two different years. (Response times were rounded off to whole minutes.) Convert both frequency distributions into percentages, and construct pie charts and bar charts to display the data. Write a paragraph comparing the changes in response time between the two years.
فتح الحزمة
افتح القفل للوصول البطاقات البالغ عددها 12 في هذه المجموعة.
فتح الحزمة
k this deck
11
Problems are labeled with the social science discipline from which they are drawn: SOC is for sociology, SW is for social work, PS is for Political Science, CJ is for Criminal Justice, PA is for Public Administration, and GER is for Gerontology.
SOC: Figures 2.9 through 2.11 display trends in crime in the United States over the last two decades. Write a paragraph describing each of these graphs. What similarities and differences can you observe among the three graphs? (For example, do crime rates always change in the same direction?) Note the differences in the vertical axes from chart to chart; for homicide, the axis ranges from 0 to 12, while for burglary and auto theft, the range is from 0 to 1,600. The latter crimes are far more common, and a scale with smaller intervals is needed to display the rates.
SOC: Figures 2.9 through 2.11 display trends in crime in the United States over the last two decades. Write a paragraph describing each of these graphs. What similarities and differences can you observe among the three graphs? (For example, do crime rates always change in the same direction?) Note the differences in the vertical axes from chart to chart; for homicide, the axis ranges from 0 to 12, while for burglary and auto theft, the range is from 0 to 1,600. The latter crimes are far more common, and a scale with smaller intervals is needed to display the rates.
فتح الحزمة
افتح القفل للوصول البطاقات البالغ عددها 12 في هذه المجموعة.
فتح الحزمة
k this deck
12
Problems are labeled with the social science discipline from which they are drawn: SOC is for sociology, SW is for social work, PS is for Political Science, CJ is for Criminal Justice, PA is for Public Administration, and GER is for Gerontology.
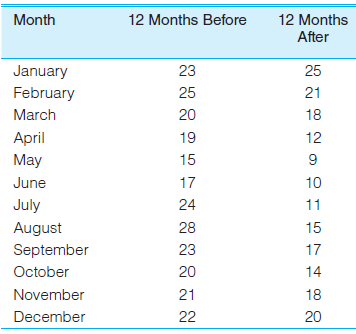
PA: A city's Department of Transportation has been keeping track of accidents on a particularly dangerous stretch of highway. Early in the year, the city lowered the speed limit on this highway and increased police patrols. Data on the number of accidents before and after the changes are presented here. Did the changes work? Is the highway safer? Construct a line chart to display these two sets of data (use graphics software if available), and write a paragraph describing the changes.
PA: A city's Department of Transportation has been keeping track of accidents on a particularly dangerous stretch of highway. Early in the year, the city lowered the speed limit on this highway and increased police patrols. Data on the number of accidents before and after the changes are presented here. Did the changes work? Is the highway safer? Construct a line chart to display these two sets of data (use graphics software if available), and write a paragraph describing the changes.
فتح الحزمة
افتح القفل للوصول البطاقات البالغ عددها 12 في هذه المجموعة.
فتح الحزمة
k this deck
فتح الحزمة
افتح القفل للوصول البطاقات البالغ عددها 12 في هذه المجموعة.


