Deck 11: Statistically Based Quality Improvement for Variables
ملء الشاشة (f)
سؤال
سؤال
Return to the chart in Figure. Is this process stable? Explain.
FIGURE Completed x and R Chart
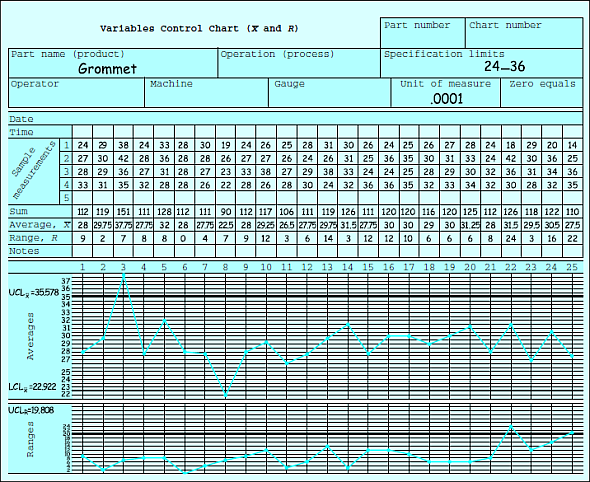
FIGURE Completed x and R Chart
سؤال
سؤال
Return to the data in Figure. Is this process capable? Compute both Cpk and Ppk.
FIGURE Completed x and R Chart

FIGURE Completed x and R Chart
سؤال
سؤال
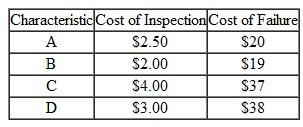
For the following product characteristics, choose where to inspect first:
سؤال
سؤال
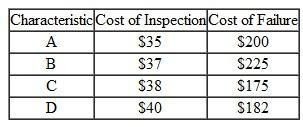
For the following product characteristics, choose where to inspect first:
سؤال
سؤال
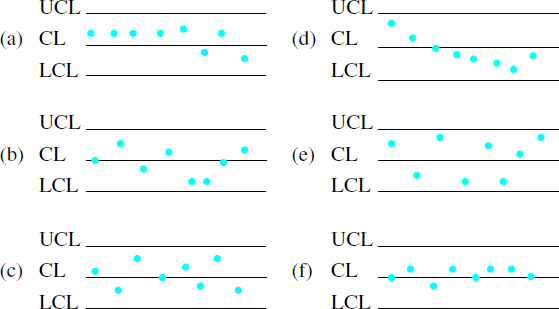
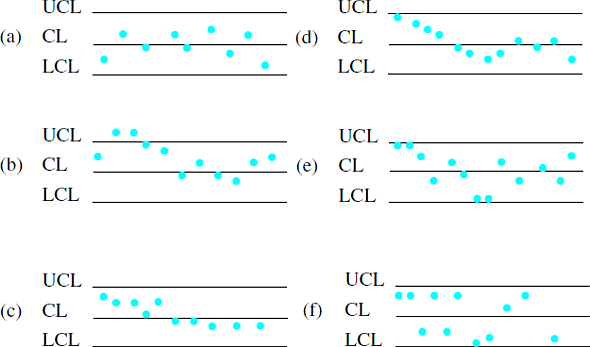
Interpret the following charts to determine if the processes are stable.
سؤال
سؤال
Interpret the following charts to determine if the processes are stable.
سؤال
When would you choose an np chart over a p chart? An X chart over an
 chart? An s chart over an R chart?
chart? An s chart over an R chart? سؤال
سؤال
سؤال
سؤال
سؤال
سؤال
سؤال
A services process is monitored using
 and R charts. Eight samples of n = 10 observations have been gathered with the following results:
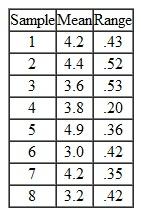 a. Using the data in the table, compute the center line, the upper control limit, and the lower control limit for the
 and R charts.
b. Is the process in control? Interpret the charts.
c. If the next sample results in the following values (2.5, 5.5, 4.6, 3.2, 4.6, 3.2, 4.0, 4.0, 3.6, 4.2), will the process be in control?
and R charts. Eight samples of n = 10 observations have been gathered with the following results: a. Using the data in the table, compute the center line, the upper control limit, and the lower control limit for the and R charts.b. Is the process in control? Interpret the charts.
c. If the next sample results in the following values (2.5, 5.5, 4.6, 3.2, 4.6, 3.2, 4.0, 4.0, 3.6, 4.2), will the process be in control?
سؤال
A production process for the JMF Semicon is monitored using
 and R charts. Ten samples of n = 15 observations have been gathered with the following results:
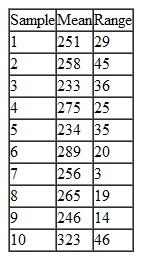 a. Develop a control chart and plot the means.
b. Is the process in control? Explain.
and R charts. Ten samples of n = 15 observations have been gathered with the following results: a. Develop a control chart and plot the means.b. Is the process in control? Explain.
سؤال
سؤال
A finishing process packages assemblies into boxes. You have noticed variability in the boxes and desire to improve the process to fix the problem because some products fit too tightly into the boxes and others fit too loosely. Following are width measurements for the boxes.
 Using
Using
 and R charts, plot and interpret the process.
Using and R charts, plot and interpret the process. سؤال
For the data in Problem, if the mean specification is 68.5 ±.25 and the estimated process standard deviation is.10, is the process capable? Compute Cpu, Cpl, and Cpk.
Problem
A finishing process packages assemblies into boxes. You have noticed variability in the boxes and desire to improve the process to fix the problem because some products fit too tightly into the boxes and others fit too loosely. Following are width measurements for the boxes.
 Using
Using
 and R charts, plot and interpret the process.
Problem
A finishing process packages assemblies into boxes. You have noticed variability in the boxes and desire to improve the process to fix the problem because some products fit too tightly into the boxes and others fit too loosely. Following are width measurements for the boxes.
Using and R charts, plot and interpret the process. سؤال
For the data in Problem 1, treat the data as if they were population data, and find the limits for an X chart. Is the process in control? Compare your answer with the answers to Problem 2. Hint : Use the formula CL x =
 ± (3/ d 2 )
 (Figure).
Problem 1
A finishing process packages assemblies into boxes. You have noticed variability in the boxes and desire to improve the process to fix the problem because some products fit too tightly into the boxes and others fit too loosely. Following are width measurements for the boxes.
 Using
Using
 and R charts, plot and interpret the process.
Problem 2
For the data in Problem 1, if the mean specification is 68.5 ±.25 and the estimated process standard deviation is.10, is the process capable? Compute Cpu, Cpl, and Cpk.
Figure
± (3/ d 2 ) (Figure).Problem 1
A finishing process packages assemblies into boxes. You have noticed variability in the boxes and desire to improve the process to fix the problem because some products fit too tightly into the boxes and others fit too loosely. Following are width measurements for the boxes.
Using and R charts, plot and interpret the process.Problem 2
For the data in Problem 1, if the mean specification is 68.5 ±.25 and the estimated process standard deviation is.10, is the process capable? Compute Cpu, Cpl, and Cpk.
Figure
سؤال
A Rochester, New York, firm produces grommets that have to fit into a slot in an assembly. Following are dimensions of grommets (in millimeters):
 a. Use
 and R charts to determine if the process is in control.
a. Use and R charts to determine if the process is in control. سؤال
Using the data from Problem, compute the limits for
 and s charts. Is the process still in control?
Problem
A finishing process packages assemblies into boxes. You have noticed variability in the boxes and desire to improve the process to fix the problem because some products fit too tightly into the boxes and others fit too loosely. Following are width measurements for the boxes.
 Using
Using
 and R charts, plot and interpret the process.
and s charts. Is the process still in control?Problem
A finishing process packages assemblies into boxes. You have noticed variability in the boxes and desire to improve the process to fix the problem because some products fit too tightly into the boxes and others fit too loosely. Following are width measurements for the boxes.
Using and R charts, plot and interpret the process. سؤال
Using the data from Problem, compute the limits for
 and s charts. Is the process still in control?
Problem
A Rochester, New York, firm produces grommets that have to fit into a slot in an assembly. Following are dimensions of grommets (in millimeters):
 a. Use
 and R charts to determine if the process is in control.
and s charts. Is the process still in control?Problem
A Rochester, New York, firm produces grommets that have to fit into a slot in an assembly. Following are dimensions of grommets (in millimeters):
a. Use and R charts to determine if the process is in control. سؤال
Use a median chart to determine if the process for the following data is centered.
سؤال
Use an
 chart to determine if the data in Problem are in control. Do you get the same answer?
Problem
Use a median chart to determine if the process for the following data is centered.

chart to determine if the data in Problem are in control. Do you get the same answer?Problem
Use a median chart to determine if the process for the following data is centered.
سؤال
The following data are for a component used in the space shuttle. Because the process dispersion is
closely monitored, use an
 and s chart to see if the process is in control.
closely monitored, use an
and s chart to see if the process is in control. سؤال
Develop an R chart for the data in Problem. Do you get the same answer?
Problem
The following data are for a component used in the space shuttle. Because the process dispersion is closely monitored, use an
 and s chart to see if the process is in control.

Problem
The following data are for a component used in the space shuttle. Because the process dispersion is closely monitored, use an
and s chart to see if the process is in control. سؤال
Using the data from Problem, compute limits for a median chart. Is the process in control?
Problem
The following data are for a component used in the space shuttle. Because the process dispersion is closely monitored, use an
 and s chart to see if the process is in control.

Problem
The following data are for a component used in the space shuttle. Because the process dispersion is closely monitored, use an
and s chart to see if the process is in control. سؤال
سؤال
سؤال
For the data in Problem, if the process target is 50.25 with spec limits +/?5, describe statistically the
problems that would occur if you used your spec limits on a control chart where n = 5. Discuss type I
and type II error.
Problem
A Rochester, New York, firm produces grommets that have to fit into a slot in an assembly. Following are dimensions of grommets (in millimeters):
 a. Use
 and R charts to determine if the process is in control.
problems that would occur if you used your spec limits on a control chart where n = 5. Discuss type I
and type II error.
Problem
A Rochester, New York, firm produces grommets that have to fit into a slot in an assembly. Following are dimensions of grommets (in millimeters):
a. Use and R charts to determine if the process is in control.
فتح الحزمة
قم بالتسجيل لفتح البطاقات في هذه المجموعة!
Unlock Deck
Unlock Deck
1/36
العب
ملء الشاشة (f)
Deck 11: Statistically Based Quality Improvement for Variables
1
Discuss the concept of control. Is control helpful? Isn't being controlling a negative?
Control is also an important managerial function like plan, organize, recruitment and directing.
Yes, this control function is used to check errors in the samples and helps to take corrective actions. Also the control function is used to reduce the deviation from standards, and avowed targets of the organization are attained in a desired manner.
In earlier methods, control was used to find out the errors in the samples. But in this modern world, control is used to setting standards, measuring real performance and taking corrective action.
Now control function is considered as the following activities:
• A continuous process,
• Managing process,
• Advance looking process,
• Closely associated with planning,
• Embedded with every stage of managerial hierarchy,
• Consider as a tool to achieve organizational activities,
• An end process.
Hence, the concept of control function is discussed.
2
Return to the chart in Figure. Is this process stable? Explain.
FIGURE Completed x and R Chart
FIGURE Completed x and R Chart
Refer to FIGURE 11.8 in the textbook. The process is not stable due to the following reasons:
• In this chart, subgroup 3 and 8 violated the control limits.
• Sample 3 is above the upper control limit and sample 8 is below the lower control limit.
• There are no patterns or drifts on the chart.
• Finally, entire points are not balanced between the limits.
Hence, it can be concluded that this chart does not contain a stable control. Therefore, assignable causes for the variation in process should be investigated.
3
The concept of statistical thinking is an important theme in this chapter. What are some examples of statistical thinking?
The concept of statistical thinking is a decision-making skill established by the capability to illustrate conclusion based on information.
The statistical thinking is attentiveness on the deviation, and is the fiscal point.
The statistical thinking is used to allow the permissible limits in upper and lower side without affecting the quality of the product.
Examining the quantity of sample products, it allows sustaining a continuing quality control.
Measurement of sugar level in human blood before and after taking breakfast is varied in limited time period. Based on the measurement data, statistical thinking concludes the corrective actions.
Hence, the examples of statistical thinking concept are discussed.
4
Return to the data in Figure. Is this process capable? Compute both Cpk and Ppk.
FIGURE Completed x and R Chart
FIGURE Completed x and R Chart
فتح الحزمة
افتح القفل للوصول البطاقات البالغ عددها 36 في هذه المجموعة.
فتح الحزمة
k this deck
5
Sometimes you do well on exams. Sometimes you have bad days. What are the assignable causes when you do poorly?
فتح الحزمة
افتح القفل للوصول البطاقات البالغ عددها 36 في هذه المجموعة.
فتح الحزمة
k this deck
6
For the following product characteristics, choose where to inspect first:
فتح الحزمة
افتح القفل للوصول البطاقات البالغ عددها 36 في هذه المجموعة.
فتح الحزمة
k this deck
7
What is the relationship between statistical quality improvement and Deming's 14 points?
فتح الحزمة
افتح القفل للوصول البطاقات البالغ عددها 36 في هذه المجموعة.
فتح الحزمة
k this deck
8
For the following product characteristics, choose where to inspect first:
فتح الحزمة
افتح القفل للوصول البطاقات البالغ عددها 36 في هذه المجموعة.
فتح الحزمة
k this deck
9
What are some applications of process charts in services? Could demerits (points off for mistakes) be charted? How?
فتح الحزمة
افتح القفل للوصول البطاقات البالغ عددها 36 في هذه المجموعة.
فتح الحزمة
k this deck
10
Interpret the following charts to determine if the processes are stable.
فتح الحزمة
افتح القفل للوصول البطاقات البالغ عددها 36 في هذه المجموعة.
فتح الحزمة
k this deck
11
What is random variation? Is it always uncontrollable?
فتح الحزمة
افتح القفل للوصول البطاقات البالغ عددها 36 في هذه المجموعة.
فتح الحزمة
k this deck
12
Interpret the following charts to determine if the processes are stable.
فتح الحزمة
افتح القفل للوصول البطاقات البالغ عددها 36 في هذه المجموعة.
فتح الحزمة
k this deck
13
When would you choose an np chart over a p chart? An X chart over an
chart? An s chart over an R chart?
chart? An s chart over an R chart? فتح الحزمة
افتح القفل للوصول البطاقات البالغ عددها 36 في هذه المجموعة.
فتح الحزمة
k this deck
14
Tolerances for a new assembly call for weights between 32 and 33 pounds. The assembly is made using a process that has a mean of 32.6 pounds with a population standard deviation of.22 pounds. The process population is normally distributed.
a. Is the process capable?
b. If not, what proportion will meet tolerances?
c. Within what values will 99.5% of sample means of this process fall if the sample size is constant at 10 and the process is stable?
a. Is the process capable?
b. If not, what proportion will meet tolerances?
c. Within what values will 99.5% of sample means of this process fall if the sample size is constant at 10 and the process is stable?
فتح الحزمة
افتح القفل للوصول البطاقات البالغ عددها 36 في هذه المجموعة.
فتح الحزمة
k this deck
15
Design a control chart to monitor the gas mileage in your car. Collect the data over time. What did you find?
فتح الحزمة
افتح القفل للوصول البطاقات البالغ عددها 36 في هذه المجموعة.
فتح الحزمة
k this deck
16
Specifications for a part are 62? +/?.01. ? The part is constructed from a process with a mean of 62.01? and a population standard deviation of.033. The process is normally distributed.
a. Is the process capable?
b. What proportion will meet specifications?
c. Within what values will 95% of sample means of the process fall if the sample size is constant at 5 and the process is stable?
a. Is the process capable?
b. What proportion will meet specifications?
c. Within what values will 95% of sample means of the process fall if the sample size is constant at 5 and the process is stable?
فتح الحزمة
افتح القفل للوصول البطاقات البالغ عددها 36 في هذه المجموعة.
فتح الحزمة
k this deck
17
What does "out-of-control" mean? Is it the same as a "bad hair day"?
فتح الحزمة
افتح القفل للوصول البطاقات البالغ عددها 36 في هذه المجموعة.
فتح الحزمة
k this deck
18
Tolerances for a bicycle derailleur are 6 cm +/?.001 cm. The current process produces derailleurs with a mean of 6.0001 with a population standard deviation of.0004. The process population is normally distributed.
a. Is the process capable?
b. If not, what proportion will meet specs?
c. Within what values will 75% of sample means of this process fall if the sample size is 6 and the process is stable?
a. Is the process capable?
b. If not, what proportion will meet specs?
c. Within what values will 75% of sample means of this process fall if the sample size is 6 and the process is stable?
فتح الحزمة
افتح القفل للوصول البطاقات البالغ عددها 36 في هذه المجموعة.
فتح الحزمة
k this deck
19
Design a control chart to monitor the amounts of the most recently charged 50 debits from your debit card. What did you find?
فتح الحزمة
افتح القفل للوصول البطاقات البالغ عددها 36 في هذه المجموعة.
فتح الحزمة
k this deck
20
A services process is monitored using
and R charts. Eight samples of n = 10 observations have been gathered with the following results:
a. Using the data in the table, compute the center line, the upper control limit, and the lower control limit for the
and R charts.
b. Is the process in control? Interpret the charts.
c. If the next sample results in the following values (2.5, 5.5, 4.6, 3.2, 4.6, 3.2, 4.0, 4.0, 3.6, 4.2), will the process be in control?
and R charts. Eight samples of n = 10 observations have been gathered with the following results: a. Using the data in the table, compute the center line, the upper control limit, and the lower control limit for the and R charts.b. Is the process in control? Interpret the charts.
c. If the next sample results in the following values (2.5, 5.5, 4.6, 3.2, 4.6, 3.2, 4.0, 4.0, 3.6, 4.2), will the process be in control?
فتح الحزمة
افتح القفل للوصول البطاقات البالغ عددها 36 في هذه المجموعة.
فتح الحزمة
k this deck
21
A production process for the JMF Semicon is monitored using
and R charts. Ten samples of n = 15 observations have been gathered with the following results:
a. Develop a control chart and plot the means.
b. Is the process in control? Explain.
and R charts. Ten samples of n = 15 observations have been gathered with the following results: a. Develop a control chart and plot the means.b. Is the process in control? Explain.
فتح الحزمة
افتح القفل للوصول البطاقات البالغ عددها 36 في هذه المجموعة.
فتح الحزمة
k this deck
22
Experiment : Randomly select the heights of at least 15 of the students in your class.
a. Develop a control chart and plot the heights on the chart.
b. Which chart should you use?
c. Is this process in control?
a. Develop a control chart and plot the heights on the chart.
b. Which chart should you use?
c. Is this process in control?
فتح الحزمة
افتح القفل للوصول البطاقات البالغ عددها 36 في هذه المجموعة.
فتح الحزمة
k this deck
23
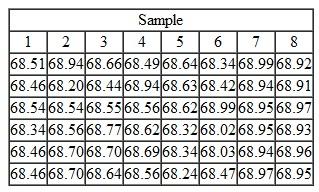
A finishing process packages assemblies into boxes. You have noticed variability in the boxes and desire to improve the process to fix the problem because some products fit too tightly into the boxes and others fit too loosely. Following are width measurements for the boxes.
Using
and R charts, plot and interpret the process.
Using and R charts, plot and interpret the process. فتح الحزمة
افتح القفل للوصول البطاقات البالغ عددها 36 في هذه المجموعة.
فتح الحزمة
k this deck
24
For the data in Problem, if the mean specification is 68.5 ±.25 and the estimated process standard deviation is.10, is the process capable? Compute Cpu, Cpl, and Cpk.
Problem
A finishing process packages assemblies into boxes. You have noticed variability in the boxes and desire to improve the process to fix the problem because some products fit too tightly into the boxes and others fit too loosely. Following are width measurements for the boxes.
Using
and R charts, plot and interpret the process.
Problem
A finishing process packages assemblies into boxes. You have noticed variability in the boxes and desire to improve the process to fix the problem because some products fit too tightly into the boxes and others fit too loosely. Following are width measurements for the boxes.
Using and R charts, plot and interpret the process. فتح الحزمة
افتح القفل للوصول البطاقات البالغ عددها 36 في هذه المجموعة.
فتح الحزمة
k this deck
25
For the data in Problem 1, treat the data as if they were population data, and find the limits for an X chart. Is the process in control? Compare your answer with the answers to Problem 2. Hint : Use the formula CL x =
± (3/ d 2 )
(Figure).
Problem 1
A finishing process packages assemblies into boxes. You have noticed variability in the boxes and desire to improve the process to fix the problem because some products fit too tightly into the boxes and others fit too loosely. Following are width measurements for the boxes.
Using
and R charts, plot and interpret the process.
Problem 2
For the data in Problem 1, if the mean specification is 68.5 ±.25 and the estimated process standard deviation is.10, is the process capable? Compute Cpu, Cpl, and Cpk.
Figure
± (3/ d 2 ) (Figure).Problem 1
A finishing process packages assemblies into boxes. You have noticed variability in the boxes and desire to improve the process to fix the problem because some products fit too tightly into the boxes and others fit too loosely. Following are width measurements for the boxes.
Using and R charts, plot and interpret the process.Problem 2
For the data in Problem 1, if the mean specification is 68.5 ±.25 and the estimated process standard deviation is.10, is the process capable? Compute Cpu, Cpl, and Cpk.
Figure
فتح الحزمة
افتح القفل للوصول البطاقات البالغ عددها 36 في هذه المجموعة.
فتح الحزمة
k this deck
26
A Rochester, New York, firm produces grommets that have to fit into a slot in an assembly. Following are dimensions of grommets (in millimeters):
a. Use
and R charts to determine if the process is in control.
a. Use and R charts to determine if the process is in control. فتح الحزمة
افتح القفل للوصول البطاقات البالغ عددها 36 في هذه المجموعة.
فتح الحزمة
k this deck
27
Using the data from Problem, compute the limits for
and s charts. Is the process still in control?
Problem
A finishing process packages assemblies into boxes. You have noticed variability in the boxes and desire to improve the process to fix the problem because some products fit too tightly into the boxes and others fit too loosely. Following are width measurements for the boxes.
Using
and R charts, plot and interpret the process.
and s charts. Is the process still in control?Problem
A finishing process packages assemblies into boxes. You have noticed variability in the boxes and desire to improve the process to fix the problem because some products fit too tightly into the boxes and others fit too loosely. Following are width measurements for the boxes.
Using and R charts, plot and interpret the process. فتح الحزمة
افتح القفل للوصول البطاقات البالغ عددها 36 في هذه المجموعة.
فتح الحزمة
k this deck
28
Using the data from Problem, compute the limits for
and s charts. Is the process still in control?
Problem
A Rochester, New York, firm produces grommets that have to fit into a slot in an assembly. Following are dimensions of grommets (in millimeters):
a. Use
and R charts to determine if the process is in control.
and s charts. Is the process still in control?Problem
A Rochester, New York, firm produces grommets that have to fit into a slot in an assembly. Following are dimensions of grommets (in millimeters):
a. Use and R charts to determine if the process is in control. فتح الحزمة
افتح القفل للوصول البطاقات البالغ عددها 36 في هذه المجموعة.
فتح الحزمة
k this deck
29
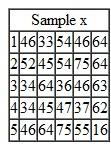
Use a median chart to determine if the process for the following data is centered.
فتح الحزمة
افتح القفل للوصول البطاقات البالغ عددها 36 في هذه المجموعة.
فتح الحزمة
k this deck
30
Use an
chart to determine if the data in Problem are in control. Do you get the same answer?
Problem
Use a median chart to determine if the process for the following data is centered.
chart to determine if the data in Problem are in control. Do you get the same answer?Problem
Use a median chart to determine if the process for the following data is centered.
فتح الحزمة
افتح القفل للوصول البطاقات البالغ عددها 36 في هذه المجموعة.
فتح الحزمة
k this deck
31
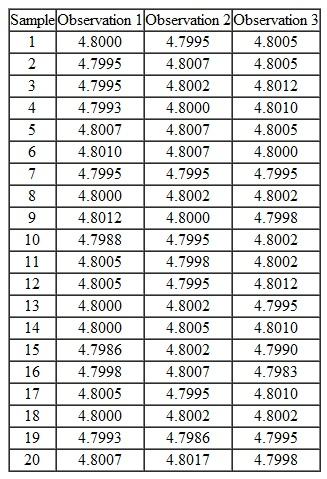
The following data are for a component used in the space shuttle. Because the process dispersion is
closely monitored, use an
and s chart to see if the process is in control.
closely monitored, use an
and s chart to see if the process is in control. فتح الحزمة
افتح القفل للوصول البطاقات البالغ عددها 36 في هذه المجموعة.
فتح الحزمة
k this deck
32
Develop an R chart for the data in Problem. Do you get the same answer?
Problem
The following data are for a component used in the space shuttle. Because the process dispersion is closely monitored, use an
and s chart to see if the process is in control.
Problem
The following data are for a component used in the space shuttle. Because the process dispersion is closely monitored, use an
and s chart to see if the process is in control. فتح الحزمة
افتح القفل للوصول البطاقات البالغ عددها 36 في هذه المجموعة.
فتح الحزمة
k this deck
33
Using the data from Problem, compute limits for a median chart. Is the process in control?
Problem
The following data are for a component used in the space shuttle. Because the process dispersion is closely monitored, use an
and s chart to see if the process is in control.
Problem
The following data are for a component used in the space shuttle. Because the process dispersion is closely monitored, use an
and s chart to see if the process is in control. فتح الحزمة
افتح القفل للوصول البطاقات البالغ عددها 36 في هذه المجموعة.
فتح الحزمة
k this deck
34
Design a control plan for exam scores for your quality management class. Describe how you would gather data, what type of chart is needed, how to gather data, how to interpret the data, how to identify causes, and remedial action to be taken when out-of-control situations occur.
فتح الحزمة
افتح القفل للوصول البطاقات البالغ عددها 36 في هذه المجموعة.
فتح الحزمة
k this deck
35
For the sampling plan from Problem, how would you measure process capability?
Problem
Design a control plan for exam scores for your quality management class. Describe how you would gather data, what type of chart is needed, how to gather data, how to interpret the data, how to identify causes, and remedial action to be taken when out-of-control situations occur.
Problem
Design a control plan for exam scores for your quality management class. Describe how you would gather data, what type of chart is needed, how to gather data, how to interpret the data, how to identify causes, and remedial action to be taken when out-of-control situations occur.
فتح الحزمة
افتح القفل للوصول البطاقات البالغ عددها 36 في هذه المجموعة.
فتح الحزمة
k this deck
36
For the data in Problem, if the process target is 50.25 with spec limits +/?5, describe statistically the
problems that would occur if you used your spec limits on a control chart where n = 5. Discuss type I
and type II error.
Problem
A Rochester, New York, firm produces grommets that have to fit into a slot in an assembly. Following are dimensions of grommets (in millimeters):
a. Use
and R charts to determine if the process is in control.
problems that would occur if you used your spec limits on a control chart where n = 5. Discuss type I
and type II error.
Problem
A Rochester, New York, firm produces grommets that have to fit into a slot in an assembly. Following are dimensions of grommets (in millimeters):
a. Use and R charts to determine if the process is in control. فتح الحزمة
افتح القفل للوصول البطاقات البالغ عددها 36 في هذه المجموعة.
فتح الحزمة
k this deck
فتح الحزمة
افتح القفل للوصول البطاقات البالغ عددها 36 في هذه المجموعة.


