Deck 12: Aggregate Expenditure Multiplier
ملء الشاشة (f)
سؤال
سؤال
سؤال
سؤال
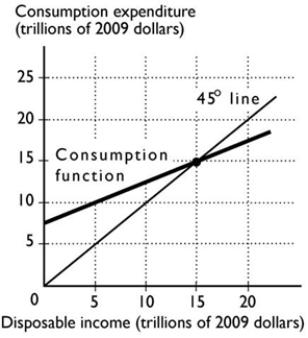
In the figure above, when disposable income equals $20 trillion,
A) consumption expenditure is less than disposable income, so consumers are dissaving.
B) consumption expenditure is greater than disposable income, so consumers are dissaving.
C) consumption expenditure is greater than disposable income, so consumers are saving.
D) consumption expenditure is less than disposable income, so consumers are saving.
E) consumption expenditure is less than disposable income but it is not possible to determine whether consumers are saving or dissaving.
سؤال
سؤال
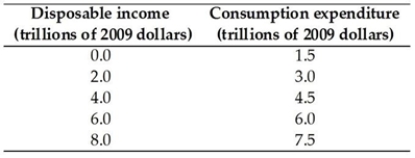
The above table has data from the nation of Atlantica. Based on these data, when disposable income equals 8.0 there is
A) savings of $0.5 trillion.
B) dissavings of $15.5 trillion.
C) dissavings of $7.5 trillion.
D) dissavings of $0.5 trillion.
E) savings of $15.5 trillion.
سؤال
سؤال
سؤال
The above table has data from the nation of Atlantica. Based on these data, the amount of autonomous consumption is
A) $7.5 trillion.
B) $1.0 trillion.
C) $0.5 trillion.
D) $6.0 trillion.
E) $1.5 trillion.
سؤال
In the figure above, what is the MPC?
A) 0.50
B) 1.00
C) 0.75
D) 0.90
E) 0.80
سؤال
سؤال
سؤال
The above table has data from the nation of Atlantic. Based on these data, at what point does saving equal zero?
A) None, dissavings occurs at all of the above points.
B) None, savings occurs at all of the above points.
C) Between disposable income of $8.0 trillion and $7.5 trillion.
D) Between disposable income of $0.0 and $1.5 trillion.
E) At disposable income of $6.0 trillion.
سؤال
In the figure above, when disposable income equals $10 trillion,
A) consumption expenditure is less than disposable income, so consumers are saving.
B) consumption expenditure is greater than disposable income, so consumers are dissaving.
C) consumption expenditure is greater than disposable income but it is not possible to determine if consumers are saving or dissaving.
D) consumption expenditure is greater than disposable income, so consumers are saving.
E) consumption expenditure is less than disposable income, so consumers are dissaving.
سؤال
سؤال
سؤال
سؤال
The above table has data from the nation of Atlantica. Based on these data, what is the marginal propensity to consume?
A) 1.00
B) 1.50
C) 0.50
D) 1.33
E) 0.75
سؤال
The above table has data from the nation of Atlantica. Based on these data, when disposable income equals $2.0 trillion there is
A) savings of $1.0 trillion.
B) dissavings of $1.0 trillion.
C) savings of $3.0 trillion.
D) dissavings of $3.0 trillion.
E) dissavings of $5.0 trillion.
سؤال
سؤال
سؤال
سؤال
سؤال
سؤال
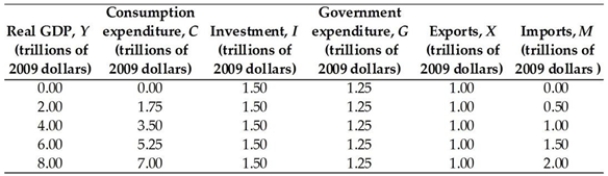
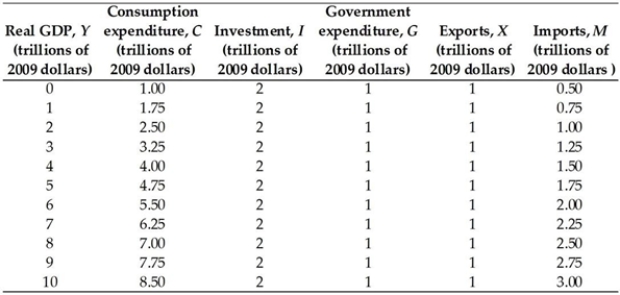
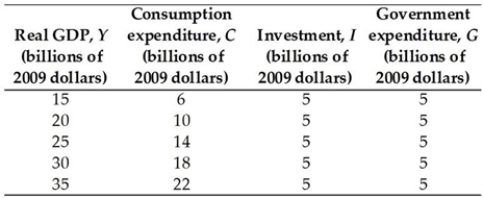
The above table presents data from the nation of Pacifica. Aggregate planned expenditure equals $7.5 trillion when real GDP equals
A) $8.5 trillion.
B) $7.5 trillion.
C) $4.0 trillion.
D) $8.0 trillion.
E) $6.0 trillion.
سؤال
سؤال
سؤال
سؤال
سؤال
سؤال
سؤال
The above table presents data from the nation of Pacifica. When real GDP equals $2.0 trillion, aggregate planned expenditure equals
A) $5.00 trillion.
B) $3.75 trillion.
C) $4.00 trillion.
D) $5.50 trillion.
E) $6.00 trillion.
سؤال
سؤال
سؤال
سؤال
سؤال
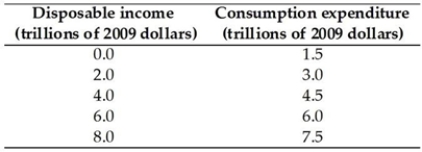
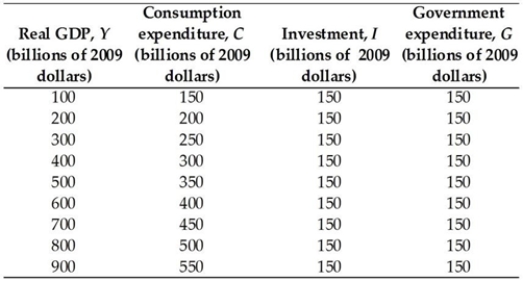
The above table has data from the nation of Media. Based on these data, the marginal propensity to consume is
A) 0.67.
B) 1.33.
C) 0.25.
D) 0.75.
E) 1.50.
سؤال
سؤال
The above table has data from the nation of Media. Based on these data, when disposable income is $8.0 trillion, saving is
A) $1.5 trillion.
B) $0.5 trillion.
C) -$0.5 trillion.
D) $7.5 trillion.
E) -$1.5 trillion.
سؤال
سؤال
سؤال
The table above gives data for the nation of Mosh. If real GDP is $10 trillion, then
A) firms decrease production because inventories exceed their target levels.
B) firms increase production because inventories are less than their target levels.
C) firms decrease production because inventories are less than their target levels.
D) the economy has reached equilibrium and no change in production will occur.
E) We need more information to determine whether firms increase, decrease or do not change their production.
سؤال
The above table gives data for the nation of Mouseville. There are no imports into or exports from Mouseville. Unplanned inventory changes equal $50 billion when real GDP equals
A) $900 billion.
B) $300 billion.
C) $700 billion.
D) $500 billion.
E) $800 billion.
سؤال
سؤال
The table above gives data for the nation of Mosh. In Mosh, equilibrium expenditure equals
A) $4 trillion.
B) $9 trillion.
C) $6 trillion.
D) $10 trillion.
E) $7 trillion.
سؤال
The above table gives data for the nation of Mouseville. There are no imports into or exports from Mouseville. Unplanned inventory changes are zero when real GDP equals
A) $500 billion.
B) $900 billion.
C) $300 billion.
D) $700 billion.
E) $800 billion.
سؤال
سؤال
سؤال
سؤال
The table above gives data for the nation of Mosh. If real GDP is $6 trillion, then
A) firms decrease production because inventories exceed their target levels.
B) firms increase production because inventories exceed their target levels.
C) firms increase production because inventories are less than their target levels.
D) the economy has reached equilibrium and no change in production will occur.
E) We need more information to determine whether firms increase, decrease or do not change their production.
سؤال
سؤال
The table above gives data for the nation of Mosh. If we graphed these data, we would see that when GDP equals
A) $4 trillion, the AE curve intersects the 45° line.
B) $6 trillion, the AE curve is below the 45° line.
C) $9 trillion, the AE curve intersects the 45° line.
D) $10 trillion, the 45° line is above the AE curve.
E) $10 trillion, the AE curve intersects the 45° line.
سؤال
The above table gives data for the nation of Mouseville. There are no imports into or exports from Mouseville. The equilibrium level of real GDP is
A) $700 billion.
B) $900 billion.
C) $800 billion.
D) $500 billion.
E) $100 billion.
سؤال
سؤال
The above table gives data for the nation of Mouseville. There are no imports into or exports from Mouseville. Aggregate planned expenditure is less than actual expenditure if real GDP is
A) less than $800 billion.
B) more than $800 billion.
C) less than $700 billion.
D) $800 billion.
E) more than $700 billion.
سؤال
سؤال
The above table gives data for the nation of Mouseville. There are no imports into or exports from Mouseville. If real GDP is equal to $400 billion then,
A) aggregate expenditure is $450 billion.
B) unplanned inventory is -$200 billion.
C) aggregate expenditure is equal to consumption expenditure.
D) unplanned inventory is $200 billion.
E) unplanned inventory is -$300 billion.
سؤال
سؤال
سؤال
سؤال
سؤال
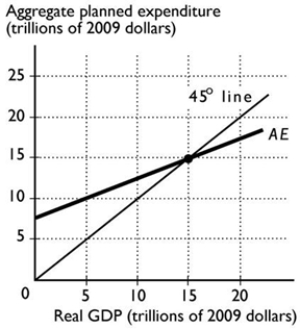
In the above figure, equilibrium expenditure is equal to
A) $5 trillion.
B) $15 trillion.
C) $20 trillion.
D) $10 trillion.
E) None of the above answers is correct
سؤال
سؤال
سؤال
سؤال
سؤال
سؤال
سؤال
In an economy in with no income taxes or imports, the multiplier equals
A) .
B) .
C) .
D) .
E) .
A) .
B) .
C) .
D) .
E) .
سؤال
The table above gives data for the nation of Mosh. If real GDP is $9 trillion, then unplanned inventory change equals
A) $5.5 trillion.
B) 0.
C) $5 trillion.
D) $9 trillion.
E) $1.25 trillion.
سؤال
The above table contains information about the nation of Syldavia. There are no income taxes or imports in this nation. The equilibrium expenditure is
A) $15 billion.
B) $30 billion.
C) $10 billion.
D) $20 billion.
E) $25 billion.
سؤال
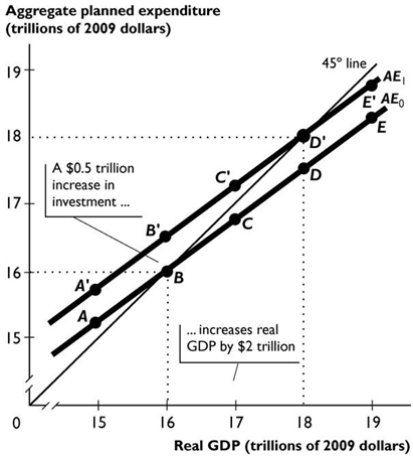 The figure above shows two aggregate expenditure lines.
In the figure above, what is the size of the multiplier?
A) 4.0
B) 0.25
C) $2 trillion
D) $0.5 trillion
E) More information is needed to determine the size of the multiplier.
سؤال
سؤال
سؤال
The above table contains information about the nation of Syldavia. There are no income taxes or imports in this nation. The expenditure multiplier is equal to
A) 10.
B) 2.
C) 1.25.
D) 5.
E) 0.8.
سؤال
سؤال
In the figure above, if real GDP is $20 trillion, aggregate planned expenditure is ________ $20 trillion and unplanned inventory changes are ________.
A) less than; positive
B) less than; negative
C) equal to; negative
D) equal to; positive
E) equal to; equals to zero
سؤال
In the figure above, if real GDP is $10 trillion, aggregate planned expenditure is
A) equal to $10 trillion and there are no unplanned inventory changes.
B) less than $10 trillion and unplanned inventory changes are positive.
C) more than $10 trillion and unplanned inventory changes are negative.
D) equal to $10 trillion and unplanned inventory changes are negative.
E) equal to $10 trillion and unplanned inventory changes are positive.
سؤال
سؤال
The figure above shows two aggregate expenditure lines.In the figure above, what would happen to the size of the multiplier if marginal income tax rates were increased?
A) The multiplier would fall in value and might become negative.
B) The multiplier would fall in value but would not become negative.
C) The multiplier would rise in value.
D) The multiplier would not change in value.
E) More information is needed to determine the effect on the size of the multiplier.

فتح الحزمة
قم بالتسجيل لفتح البطاقات في هذه المجموعة!
Unlock Deck
Unlock Deck
1/97
العب
ملء الشاشة (f)
Deck 12: Aggregate Expenditure Multiplier
1
Aggregate expenditure is equal to
A) C + I + G - NX.
B) C - I - G - NX.
C) C + I + G.
D) Y + C + I + G + NX.
E) C + I + G + NX.
A) C + I + G - NX.
B) C - I - G - NX.
C) C + I + G.
D) Y + C + I + G + NX.
E) C + I + G + NX.
C + I + G + NX.
2
As a household's disposable income increases, its autonomous expenditures ________ and its induced expenditures ________.
A) decrease; do not change
B) do not change; increase by a smaller amount than the increase in income
C) do not change; increase by an amount equal to the increase in income
D) increase; do not change
E) increase; increase by a smaller amount than the increase in income
A) decrease; do not change
B) do not change; increase by a smaller amount than the increase in income
C) do not change; increase by an amount equal to the increase in income
D) increase; do not change
E) increase; increase by a smaller amount than the increase in income
do not change; increase by a smaller amount than the increase in income
3
If your planned consumption expenditure is $600 per month and your disposable income is $500 per month, your
A) dissaving is $100 per month.
B) saving is $100 per month.
C) autonomous consumption is -$100 per month.
D) autonomous consumption must be zero per month.
E) induced consumption is $600.
A) dissaving is $100 per month.
B) saving is $100 per month.
C) autonomous consumption is -$100 per month.
D) autonomous consumption must be zero per month.
E) induced consumption is $600.
dissaving is $100 per month.
4
In the figure above, when disposable income equals $20 trillion,
A) consumption expenditure is less than disposable income, so consumers are dissaving.
B) consumption expenditure is greater than disposable income, so consumers are dissaving.
C) consumption expenditure is greater than disposable income, so consumers are saving.
D) consumption expenditure is less than disposable income, so consumers are saving.
E) consumption expenditure is less than disposable income but it is not possible to determine whether consumers are saving or dissaving.
فتح الحزمة
افتح القفل للوصول البطاقات البالغ عددها 97 في هذه المجموعة.
فتح الحزمة
k this deck
5
If disposable income decreases during a recession, there is
A) an upward shift in the consumption function.
B) a downward shift in the consumption function.
C) no change in consumption expenditures.
D) movement upward along the consumption function.
E) movement downward along the consumption function.
A) an upward shift in the consumption function.
B) a downward shift in the consumption function.
C) no change in consumption expenditures.
D) movement upward along the consumption function.
E) movement downward along the consumption function.
فتح الحزمة
افتح القفل للوصول البطاقات البالغ عددها 97 في هذه المجموعة.
فتح الحزمة
k this deck
6
The above table has data from the nation of Atlantica. Based on these data, when disposable income equals 8.0 there is
A) savings of $0.5 trillion.
B) dissavings of $15.5 trillion.
C) dissavings of $7.5 trillion.
D) dissavings of $0.5 trillion.
E) savings of $15.5 trillion.
فتح الحزمة
افتح القفل للوصول البطاقات البالغ عددها 97 في هذه المجموعة.
فتح الحزمة
k this deck
7
The slope of the consumption function is
A) equal to the MPC and is equal to 1.
B) equal to the MPC and is greater than 1.
C) equal to the MPC and is less than 1.
D) not equal to the MPC and is less than 1.
E) not equal to the MPC and is equal to 1.
A) equal to the MPC and is equal to 1.
B) equal to the MPC and is greater than 1.
C) equal to the MPC and is less than 1.
D) not equal to the MPC and is less than 1.
E) not equal to the MPC and is equal to 1.
فتح الحزمة
افتح القفل للوصول البطاقات البالغ عددها 97 في هذه المجموعة.
فتح الحزمة
k this deck
8
Jane supports herself at university by working in a bookstore earning $300 a month, which she spends entirely every month. If she gets a salary increase of $100 a month, she spends $90 more dollars on consumption expenditure. Jane's MPC is equal to
A) 0.10.
B) $90.
C) 1.00.
D) 0.50.
E) 0.90.
A) 0.10.
B) $90.
C) 1.00.
D) 0.50.
E) 0.90.
فتح الحزمة
افتح القفل للوصول البطاقات البالغ عددها 97 في هذه المجموعة.
فتح الحزمة
k this deck
9
The above table has data from the nation of Atlantica. Based on these data, the amount of autonomous consumption is
A) $7.5 trillion.
B) $1.0 trillion.
C) $0.5 trillion.
D) $6.0 trillion.
E) $1.5 trillion.
فتح الحزمة
افتح القفل للوصول البطاقات البالغ عددها 97 في هذه المجموعة.
فتح الحزمة
k this deck
10
In the figure above, what is the MPC?
A) 0.50
B) 1.00
C) 0.75
D) 0.90
E) 0.80
فتح الحزمة
افتح القفل للوصول البطاقات البالغ عددها 97 في هذه المجموعة.
فتح الحزمة
k this deck
11
The marginal propensity to consume equals
A) consumption expenditure divided by the change in disposable income.
B) the change in autonomous consumption divided by the change in induced consumption.
C) consumption expenditure divided by disposable income.
D) the change in consumption expenditure divided by the change in disposable income.
E) the change in consumption expenditure divided by disposable income.
فتح الحزمة
افتح القفل للوصول البطاقات البالغ عددها 97 في هذه المجموعة.
فتح الحزمة
k this deck
12
Consumption expenditure exceeds disposable income
A) only when the economy is in equilibrium.
B) when there is dissaving.
C) never.
D) when there is positive saving.
E) always.
A) only when the economy is in equilibrium.
B) when there is dissaving.
C) never.
D) when there is positive saving.
E) always.
فتح الحزمة
افتح القفل للوصول البطاقات البالغ عددها 97 في هذه المجموعة.
فتح الحزمة
k this deck
13
The above table has data from the nation of Atlantic. Based on these data, at what point does saving equal zero?
A) None, dissavings occurs at all of the above points.
B) None, savings occurs at all of the above points.
C) Between disposable income of $8.0 trillion and $7.5 trillion.
D) Between disposable income of $0.0 and $1.5 trillion.
E) At disposable income of $6.0 trillion.
فتح الحزمة
افتح القفل للوصول البطاقات البالغ عددها 97 في هذه المجموعة.
فتح الحزمة
k this deck
14
In the figure above, when disposable income equals $10 trillion,
A) consumption expenditure is less than disposable income, so consumers are saving.
B) consumption expenditure is greater than disposable income, so consumers are dissaving.
C) consumption expenditure is greater than disposable income but it is not possible to determine if consumers are saving or dissaving.
D) consumption expenditure is greater than disposable income, so consumers are saving.
E) consumption expenditure is less than disposable income, so consumers are dissaving.
فتح الحزمة
افتح القفل للوصول البطاقات البالغ عددها 97 في هذه المجموعة.
فتح الحزمة
k this deck
15
When disposable income increases, consumption expenditure
A) does not change.
B) also increases, and by an equal amount.
C) also increases, and by more.
D) decreases by the same amount.
E) also increases, but by less.
A) does not change.
B) also increases, and by an equal amount.
C) also increases, and by more.
D) decreases by the same amount.
E) also increases, but by less.
فتح الحزمة
افتح القفل للوصول البطاقات البالغ عددها 97 في هذه المجموعة.
فتح الحزمة
k this deck
16
During 2018, a country has consumption expenditures of $3.0 trillion, investment expenditures of $1.5 trillion, government expenditure of $1.5 trillion, exports of $1.0 trillion, and imports of $1.5 trillion. Aggregate expenditure for the country is
A) $7.0 trillion.
B) $5.5 trillion.
C) $8.5 trillion.
D) $6.0 trillion.
E) $6.5 trillion.
A) $7.0 trillion.
B) $5.5 trillion.
C) $8.5 trillion.
D) $6.0 trillion.
E) $6.5 trillion.
فتح الحزمة
افتح القفل للوصول البطاقات البالغ عددها 97 في هذه المجموعة.
فتح الحزمة
k this deck
17
The consumption function shows the relationship between
A) consumption expenditure and the price level.
B) consumption expenditure and planned income.
C) consumption expenditure and disposable income.
D) inventory levels and real GDP.
E) consumption expenditure and planned inventory investment.
A) consumption expenditure and the price level.
B) consumption expenditure and planned income.
C) consumption expenditure and disposable income.
D) inventory levels and real GDP.
E) consumption expenditure and planned inventory investment.
فتح الحزمة
افتح القفل للوصول البطاقات البالغ عددها 97 في هذه المجموعة.
فتح الحزمة
k this deck
18
The above table has data from the nation of Atlantica. Based on these data, what is the marginal propensity to consume?
A) 1.00
B) 1.50
C) 0.50
D) 1.33
E) 0.75
فتح الحزمة
افتح القفل للوصول البطاقات البالغ عددها 97 في هذه المجموعة.
فتح الحزمة
k this deck
19
The above table has data from the nation of Atlantica. Based on these data, when disposable income equals $2.0 trillion there is
A) savings of $1.0 trillion.
B) dissavings of $1.0 trillion.
C) savings of $3.0 trillion.
D) dissavings of $3.0 trillion.
E) dissavings of $5.0 trillion.
فتح الحزمة
افتح القفل للوصول البطاقات البالغ عددها 97 في هذه المجموعة.
فتح الحزمة
k this deck
20
What is the key difference between the aggregate expenditure model and the aggregate demand/aggregate supply model?
A) The aggregate demand/aggregate supply model assumes that the price level is fixed.
B) The aggregate expenditure model assumes that real GDP is fixed.
C) The aggregate expenditure model examines monetary policy, whereas the aggregate demand/aggregate supply model does not.
D) The aggregate expenditure model assumes that the price level is fixed.
E) Monetary and real factors interact in the aggregate demand/aggregate supply model.
فتح الحزمة
افتح القفل للوصول البطاقات البالغ عددها 97 في هذه المجموعة.
فتح الحزمة
k this deck
21
What is the value of the MPC if $66 out of every $100 increase in disposable income is consumed?
A) 0.34
B) $166
C) $34
D) 0.66
E) More information is needed to determine the MPC.
A) 0.34
B) $166
C) $34
D) 0.66
E) More information is needed to determine the MPC.
فتح الحزمة
افتح القفل للوصول البطاقات البالغ عددها 97 في هذه المجموعة.
فتح الحزمة
k this deck
22
When the real interest rate rises, there is
A) an upward movement along the consumption function.
B) a downward movement along the consumption function.
C) neither a shift of the consumption function nor a movement along the consumption function.
D) an upward shift of the consumption function.
E) a downward shift of the consumption function.
A) an upward movement along the consumption function.
B) a downward movement along the consumption function.
C) neither a shift of the consumption function nor a movement along the consumption function.
D) an upward shift of the consumption function.
E) a downward shift of the consumption function.
فتح الحزمة
افتح القفل للوصول البطاقات البالغ عددها 97 في هذه المجموعة.
فتح الحزمة
k this deck
23
Which components of aggregate expenditure change as a result of real GDP changing?
A) Consumption expenditure and imports
B) Consumption expenditure, investment and exports
C) Consumption expenditure and investment
D) Consumption expenditure, investment, and government expenditure on goods and services
E) Consumption expenditure and government expenditure on goods and services
A) Consumption expenditure and imports
B) Consumption expenditure, investment and exports
C) Consumption expenditure and investment
D) Consumption expenditure, investment, and government expenditure on goods and services
E) Consumption expenditure and government expenditure on goods and services
فتح الحزمة
افتح القفل للوصول البطاقات البالغ عددها 97 في هذه المجموعة.
فتح الحزمة
k this deck
24
Autonomous expenditure is expenditure that is
A) not influenced by the interest rate.
B) not influenced by the price level.
C) influenced by real GDP.
D) not influenced by real GDP.
E) influenced by the interest rate.
A) not influenced by the interest rate.
B) not influenced by the price level.
C) influenced by real GDP.
D) not influenced by real GDP.
E) influenced by the interest rate.
فتح الحزمة
افتح القفل للوصول البطاقات البالغ عددها 97 في هذه المجموعة.
فتح الحزمة
k this deck
25
The above table presents data from the nation of Pacifica. Aggregate planned expenditure equals $7.5 trillion when real GDP equals
A) $8.5 trillion.
B) $7.5 trillion.
C) $4.0 trillion.
D) $8.0 trillion.
E) $6.0 trillion.
فتح الحزمة
افتح القفل للوصول البطاقات البالغ عددها 97 في هذه المجموعة.
فتح الحزمة
k this deck
26
The AE curve illustrates the relationship between
A) the quantity of real GDP demanded and the price level.
B) the interest rate and aggregate planned expenditure.
C) real GDP and the interest rate.
D) aggregate planned expenditure and real GDP.
E) real GDP and actual expenditure.
A) the quantity of real GDP demanded and the price level.
B) the interest rate and aggregate planned expenditure.
C) real GDP and the interest rate.
D) aggregate planned expenditure and real GDP.
E) real GDP and actual expenditure.
فتح الحزمة
افتح القفل للوصول البطاقات البالغ عددها 97 في هذه المجموعة.
فتح الحزمة
k this deck
27
Which of the following is NOT included in aggregate expenditure?
A) Government expenditure
B) Net exports
C) Consumption expenditure
D) Taxes
E) Investment
A) Government expenditure
B) Net exports
C) Consumption expenditure
D) Taxes
E) Investment
فتح الحزمة
افتح القفل للوصول البطاقات البالغ عددها 97 في هذه المجموعة.
فتح الحزمة
k this deck
28
When disposable income is $8 trillion, consumption expenditure is $5 trillion; when disposable income is $5 trillion, consumption expenditure is $3 trillion. The MPC is
A) (5 + 3) ÷ (8 + 5) = 0.615.
B) (5 - 3) ÷ (8 - 5) = 0.667.
C) (5 + 3) ÷ (8 - 5) = 2.667.
D) (5/8 + 3/5) = 1.225.
E) (8 - 5) ÷ (5 - 3) = 1.333.
A) (5 + 3) ÷ (8 + 5) = 0.615.
B) (5 - 3) ÷ (8 - 5) = 0.667.
C) (5 + 3) ÷ (8 - 5) = 2.667.
D) (5/8 + 3/5) = 1.225.
E) (8 - 5) ÷ (5 - 3) = 1.333.
فتح الحزمة
افتح القفل للوصول البطاقات البالغ عددها 97 في هذه المجموعة.
فتح الحزمة
k this deck
29
Induced expenditures are defined as that part of
A) autonomous expenditure that responds to changes in real GDP.
B) aggregate expenditure that responds to changes in real GDP.
C) autonomous expenditure that does not respond to changes in real GDP.
D) real GDP that does not respond to changes in aggregate expenditure.
E) aggregate expenditure that does not respond to changes in real GDP.
فتح الحزمة
افتح القفل للوصول البطاقات البالغ عددها 97 في هذه المجموعة.
فتح الحزمة
k this deck
30
A rise in the real interest rate ________ consumption expenditure and ________.
A) decreases; shifts the consumption function upward
B) decreases; results in a movement downward along the consumption function
C) increases; shifts the consumption function upward
D) increases; shifts the consumption function downward
E) decreases; shifts the consumption function downward
A) decreases; shifts the consumption function upward
B) decreases; results in a movement downward along the consumption function
C) increases; shifts the consumption function upward
D) increases; shifts the consumption function downward
E) decreases; shifts the consumption function downward
فتح الحزمة
افتح القفل للوصول البطاقات البالغ عددها 97 في هذه المجموعة.
فتح الحزمة
k this deck
31
When disposable income increases from $400 billion to $500 billion, consumption expenditure increases from $320 billion to $400 trillion. The MPC is
A) $6.8 trillion.
B) 0.60.
C) 1.00.
D) 0.68.
E) 0.80.
A) $6.8 trillion.
B) 0.60.
C) 1.00.
D) 0.68.
E) 0.80.
فتح الحزمة
افتح القفل للوصول البطاقات البالغ عددها 97 في هذه المجموعة.
فتح الحزمة
k this deck
32
The above table presents data from the nation of Pacifica. When real GDP equals $2.0 trillion, aggregate planned expenditure equals
A) $5.00 trillion.
B) $3.75 trillion.
C) $4.00 trillion.
D) $5.50 trillion.
E) $6.00 trillion.
فتح الحزمة
افتح القفل للوصول البطاقات البالغ عددها 97 في هذه المجموعة.
فتح الحزمة
k this deck
33
For each one dollar increase in real GDP, aggregate planned expenditure
A) increases by more than a dollar.
B) increases by less than a dollar.
C) is unaffected.
D) increases only if autonomous expenditure increases.
E) increases by one dollar.
A) increases by more than a dollar.
B) increases by less than a dollar.
C) is unaffected.
D) increases only if autonomous expenditure increases.
E) increases by one dollar.
فتح الحزمة
افتح القفل للوصول البطاقات البالغ عددها 97 في هذه المجموعة.
فتح الحزمة
k this deck
34
Other things remaining the same, ________ in Australian real GDP results in ________ in Australian imports.
A) an increase; a decrease
B) a decrease; an increase
C) an increase; an increase
D) an increase; a decrease followed by no change
E) a decrease; no change
A) an increase; a decrease
B) a decrease; an increase
C) an increase; an increase
D) an increase; a decrease followed by no change
E) a decrease; no change
فتح الحزمة
افتح القفل للوصول البطاقات البالغ عددها 97 في هذه المجموعة.
فتح الحزمة
k this deck
35
In Germany, expected future income increased during 2014. This increase led to
A) a downward shift of the consumption function.
B) no movement along the consumption function and no shift of the consumption function.
C) a movement upward along the consumption function.
D) a movement downward along the consumption function.
E) an upward shift of the consumption function.
A) a downward shift of the consumption function.
B) no movement along the consumption function and no shift of the consumption function.
C) a movement upward along the consumption function.
D) a movement downward along the consumption function.
E) an upward shift of the consumption function.
فتح الحزمة
افتح القفل للوصول البطاقات البالغ عددها 97 في هذه المجموعة.
فتح الحزمة
k this deck
36
Autonomous expenditure includes
A) investment, government expenditure on goods and services, and exports.
B) consumption expenditure, investment and net taxes.
C) consumption expenditures, investment and exports.
D) investment, government expenditure for goods and services, and imports.
E) consumption expenditure, investment and imports.
فتح الحزمة
افتح القفل للوصول البطاقات البالغ عددها 97 في هذه المجموعة.
فتح الحزمة
k this deck
37
The above table has data from the nation of Media. Based on these data, the marginal propensity to consume is
A) 0.67.
B) 1.33.
C) 0.25.
D) 0.75.
E) 1.50.
فتح الحزمة
افتح القفل للوصول البطاقات البالغ عددها 97 في هذه المجموعة.
فتح الحزمة
k this deck
38
When the economy enters an expansion of a business cycle, households become more optimistic about expected future disposable income. The increase in optimism leads to
A) a shift upward of the consumption function.
B) a movement downward along the consumption function.
C) a movement upward along the consumption function.
D) an increase in consumption expenditures.
E) no change in the level of consumption expenditures.
A) a shift upward of the consumption function.
B) a movement downward along the consumption function.
C) a movement upward along the consumption function.
D) an increase in consumption expenditures.
E) no change in the level of consumption expenditures.
فتح الحزمة
افتح القفل للوصول البطاقات البالغ عددها 97 في هذه المجموعة.
فتح الحزمة
k this deck
39
The above table has data from the nation of Media. Based on these data, when disposable income is $8.0 trillion, saving is
A) $1.5 trillion.
B) $0.5 trillion.
C) -$0.5 trillion.
D) $7.5 trillion.
E) -$1.5 trillion.
فتح الحزمة
افتح القفل للوصول البطاقات البالغ عددها 97 في هذه المجموعة.
فتح الحزمة
k this deck
40
If the marginal propensity to import is ________, then a $2 trillion increase in disposable income would increase import expenditure by $0.2 trillion. If the marginal propensity to import is ________, then a $2 trillion increase in disposable income would increase import expenditure by $0.6 trillion.
A) 1.0; 3.0
B) 0.6; 2.0
C) 0.2; 0.6
D) 0.1; 0.3
E) 0.3; 0.1
A) 1.0; 3.0
B) 0.6; 2.0
C) 0.2; 0.6
D) 0.1; 0.3
E) 0.3; 0.1
فتح الحزمة
افتح القفل للوصول البطاقات البالغ عددها 97 في هذه المجموعة.
فتح الحزمة
k this deck
41
When GDP = $2.5 trillion, C = $1.0 trillion, I = $0.6 trillion, G = $0.4 trillion, and NX = $0, then
A) equilibrium expenditure = $2.0 trillion.
B) aggregate planned expenditure = $1.6 trillion.
C) aggregate planned expenditure = $2.5 trillion.
D) unplanned inventory change = -$0.5 trillion.
E) unplanned inventory change = $0.5 trillion.
A) equilibrium expenditure = $2.0 trillion.
B) aggregate planned expenditure = $1.6 trillion.
C) aggregate planned expenditure = $2.5 trillion.
D) unplanned inventory change = -$0.5 trillion.
E) unplanned inventory change = $0.5 trillion.
فتح الحزمة
افتح القفل للوصول البطاقات البالغ عددها 97 في هذه المجموعة.
فتح الحزمة
k this deck
42
The table above gives data for the nation of Mosh. If real GDP is $10 trillion, then
A) firms decrease production because inventories exceed their target levels.
B) firms increase production because inventories are less than their target levels.
C) firms decrease production because inventories are less than their target levels.
D) the economy has reached equilibrium and no change in production will occur.
E) We need more information to determine whether firms increase, decrease or do not change their production.
فتح الحزمة
افتح القفل للوصول البطاقات البالغ عددها 97 في هذه المجموعة.
فتح الحزمة
k this deck
43
The above table gives data for the nation of Mouseville. There are no imports into or exports from Mouseville. Unplanned inventory changes equal $50 billion when real GDP equals
A) $900 billion.
B) $300 billion.
C) $700 billion.
D) $500 billion.
E) $800 billion.
فتح الحزمة
افتح القفل للوصول البطاقات البالغ عددها 97 في هذه المجموعة.
فتح الحزمة
k this deck
44
The equilibrium level of aggregate planned expenditure is found where
A) there is no saving and no dissaving.
B) the price level is rising at a constant rate.
C) autonomous expenditure equals equilibrium expenditure.
D) aggregate planned expenditure equals real GDP.
E) net exports is zero.
A) there is no saving and no dissaving.
B) the price level is rising at a constant rate.
C) autonomous expenditure equals equilibrium expenditure.
D) aggregate planned expenditure equals real GDP.
E) net exports is zero.
فتح الحزمة
افتح القفل للوصول البطاقات البالغ عددها 97 في هذه المجموعة.
فتح الحزمة
k this deck
45
The table above gives data for the nation of Mosh. In Mosh, equilibrium expenditure equals
A) $4 trillion.
B) $9 trillion.
C) $6 trillion.
D) $10 trillion.
E) $7 trillion.
فتح الحزمة
افتح القفل للوصول البطاقات البالغ عددها 97 في هذه المجموعة.
فتح الحزمة
k this deck
46
The above table gives data for the nation of Mouseville. There are no imports into or exports from Mouseville. Unplanned inventory changes are zero when real GDP equals
A) $500 billion.
B) $900 billion.
C) $300 billion.
D) $700 billion.
E) $800 billion.
فتح الحزمة
افتح القفل للوصول البطاقات البالغ عددها 97 في هذه المجموعة.
فتح الحزمة
k this deck
47
If aggregate planned expenditure equals GDP, then
A) the change in firms' inventories must be negative.
B) the change in firms' inventories must be positive.
C) actual aggregate expenditure might be greater than, equal to or less than real GDP.
D) there must be no change in firms' inventories.
E) the change in firms' inventories must be equal to the planned change.
فتح الحزمة
افتح القفل للوصول البطاقات البالغ عددها 97 في هذه المجموعة.
فتح الحزمة
k this deck
48
In the aggregate expenditure (AE) model, when real GDP exceeds aggregate planned expenditure, actual inventories ________ planned inventories and real GDP ________.
A) exceed; increases
B) exceed; does not change
C) exceed; decreases
D) are less than; increases
E) are less than; decreases
A) exceed; increases
B) exceed; does not change
C) exceed; decreases
D) are less than; increases
E) are less than; decreases
فتح الحزمة
افتح القفل للوصول البطاقات البالغ عددها 97 في هذه المجموعة.
فتح الحزمة
k this deck
49
When aggregate planned expenditure exceeds real GDP, there are unplanned ________ in inventories, and firms ________ production, so that real GDP ________.
A) decreases; increase; increases
B) decreases; decrease; increases
C) decreases; decrease; decreases
D) increases; increase; increases
E) increases; decrease; decreases
A) decreases; increase; increases
B) decreases; decrease; increases
C) decreases; decrease; decreases
D) increases; increase; increases
E) increases; decrease; decreases
فتح الحزمة
افتح القفل للوصول البطاقات البالغ عددها 97 في هذه المجموعة.
فتح الحزمة
k this deck
50
The table above gives data for the nation of Mosh. If real GDP is $6 trillion, then
A) firms decrease production because inventories exceed their target levels.
B) firms increase production because inventories exceed their target levels.
C) firms increase production because inventories are less than their target levels.
D) the economy has reached equilibrium and no change in production will occur.
E) We need more information to determine whether firms increase, decrease or do not change their production.
فتح الحزمة
افتح القفل للوصول البطاقات البالغ عددها 97 في هذه المجموعة.
فتح الحزمة
k this deck
51
If the level of real GDP is $14 trillion while aggregate planned expenditure is $15 trillion, then
A) real GDP increases and planned expenditure decreases reaching equilibrium in the middle.
B) inventories fall more than planned, leading firms to increase production.
C) inventories rise more than planned, leading firms to increase production.
D) inventories rise more than planned, leading firms to cut production.
E) aggregate planned expenditure decreases to reach the equilibrium of $14 trillion.
فتح الحزمة
افتح القفل للوصول البطاقات البالغ عددها 97 في هذه المجموعة.
فتح الحزمة
k this deck
52
The table above gives data for the nation of Mosh. If we graphed these data, we would see that when GDP equals
A) $4 trillion, the AE curve intersects the 45° line.
B) $6 trillion, the AE curve is below the 45° line.
C) $9 trillion, the AE curve intersects the 45° line.
D) $10 trillion, the 45° line is above the AE curve.
E) $10 trillion, the AE curve intersects the 45° line.
فتح الحزمة
افتح القفل للوصول البطاقات البالغ عددها 97 في هذه المجموعة.
فتح الحزمة
k this deck
53
The above table gives data for the nation of Mouseville. There are no imports into or exports from Mouseville. The equilibrium level of real GDP is
A) $700 billion.
B) $900 billion.
C) $800 billion.
D) $500 billion.
E) $100 billion.
فتح الحزمة
افتح القفل للوصول البطاقات البالغ عددها 97 في هذه المجموعة.
فتح الحزمة
k this deck
54
When the change in unplanned inventories is positive, then
A) real GDP is larger than aggregate planned expenditure.
B) real GDP equals aggregate planned expenditure.
C) planned inventories will increase in order to return to equilibrium.
D) real GDP is less than aggregate planned expenditure.
E) economic growth will occur as the economy returns to equilibrium.
فتح الحزمة
افتح القفل للوصول البطاقات البالغ عددها 97 في هذه المجموعة.
فتح الحزمة
k this deck
55
The above table gives data for the nation of Mouseville. There are no imports into or exports from Mouseville. Aggregate planned expenditure is less than actual expenditure if real GDP is
A) less than $800 billion.
B) more than $800 billion.
C) less than $700 billion.
D) $800 billion.
E) more than $700 billion.
فتح الحزمة
افتح القفل للوصول البطاقات البالغ عددها 97 في هذه المجموعة.
فتح الحزمة
k this deck
56
When aggregate planned expenditure is less than GDP,
A) the economy definitely is at its equilibrium expenditure and firms do not change production.
B) the economy definitely is at its equilibrium expenditure but, even so, firms decrease production.
C) the economy might be at its equilibrium expenditure and, if it is, firms do not change their production.
D) firms increase production until the economy reaches equilibrium expenditure.
E) firms decrease production until the economy reaches equilibrium expenditure.
فتح الحزمة
افتح القفل للوصول البطاقات البالغ عددها 97 في هذه المجموعة.
فتح الحزمة
k this deck
57
The above table gives data for the nation of Mouseville. There are no imports into or exports from Mouseville. If real GDP is equal to $400 billion then,
A) aggregate expenditure is $450 billion.
B) unplanned inventory is -$200 billion.
C) aggregate expenditure is equal to consumption expenditure.
D) unplanned inventory is $200 billion.
E) unplanned inventory is -$300 billion.
فتح الحزمة
افتح القفل للوصول البطاقات البالغ عددها 97 في هذه المجموعة.
فتح الحزمة
k this deck
58
When aggregate planned expenditure exceeds real GDP,
A) real GDP decreases.
B) an unplanned increase in inventories occurs.
C) firms decrease production.
D) an unplanned decrease in inventories occurs.
E) real GDP remains at its equilibrium level.
A) real GDP decreases.
B) an unplanned increase in inventories occurs.
C) firms decrease production.
D) an unplanned decrease in inventories occurs.
E) real GDP remains at its equilibrium level.
فتح الحزمة
افتح القفل للوصول البطاقات البالغ عددها 97 في هذه المجموعة.
فتح الحزمة
k this deck
59
In the aggregate expenditure (AE) model, the economy is driven to its equilibrium by changes in
A) government expenditures on goods and services that are the result of changes in real GDP.
B) investment that are the result of changes in real GDP.
C) autonomous expenditures that are the result of changes in real GDP.
D) induced expenditures that are the result of changes in real GDP.
E) net taxes that are the result of changes in real GDP.
فتح الحزمة
افتح القفل للوصول البطاقات البالغ عددها 97 في هذه المجموعة.
فتح الحزمة
k this deck
60
A country reports that unplanned inventories increased during 2014. The increase in unplanned inventories leads to
A) consumers increasing their consumption expenditure, which increases GDP.
B) firms decreasing production, which decreases GDP.
C) firms increasing production, which increases GDP.
D) actual aggregate expenditure being different than real GDP.
E) the government decreasing production, which decreases GDP.
فتح الحزمة
افتح القفل للوصول البطاقات البالغ عددها 97 في هذه المجموعة.
فتح الحزمة
k this deck
61
Increases in autonomous expenditure induce ________ in aggregate expenditure thereby making the multiplier ________.
A) a decrease; less than one
B) further increases; less than one
C) further increases; greater than one
D) further increases; unnecessary
E) a decrease; greater than one
A) a decrease; less than one
B) further increases; less than one
C) further increases; greater than one
D) further increases; unnecessary
E) a decrease; greater than one
فتح الحزمة
افتح القفل للوصول البطاقات البالغ عددها 97 في هذه المجموعة.
فتح الحزمة
k this deck
62
In the above figure, equilibrium expenditure is equal to
A) $5 trillion.
B) $15 trillion.
C) $20 trillion.
D) $10 trillion.
E) None of the above answers is correct
فتح الحزمة
افتح القفل للوصول البطاقات البالغ عددها 97 في هذه المجموعة.
فتح الحزمة
k this deck
63
When the multiplier is ________, an autonomous decrease in investment of $200 billion decreases equilibrium real GDP by $400 billion. When the multiplier is ________, an autonomous decrease in investment of $200 billion decreases equilibrium real GDP by $800 billion.
A) 2.0; 4.0
B) 0.4; 0.2
C) $400 billion; $800 billion
D) 4.0; 8.0
E) 0.2; 0.4
A) 2.0; 4.0
B) 0.4; 0.2
C) $400 billion; $800 billion
D) 4.0; 8.0
E) 0.2; 0.4
فتح الحزمة
افتح القفل للوصول البطاقات البالغ عددها 97 في هذه المجموعة.
فتح الحزمة
k this deck
64
If autonomous spending decreases, then
A) the expenditure multiplier means that equilibrium expenditure decreases by a larger amount.
B) equilibrium expenditure does not change.
C) equilibrium expenditure decreases by the same amount.
D) the expenditure multiplier means that equilibrium expenditure increases by a larger amount.
E) the expenditure multiplier means that equilibrium expenditure increases by a smaller amount.
فتح الحزمة
افتح القفل للوصول البطاقات البالغ عددها 97 في هذه المجموعة.
فتح الحزمة
k this deck
65
An economy has no imports or income taxes. The MPC is 0.75 and real GDP is $120 billion. Businesses increase investment by $4 billion. The new level of real GDP is
A) $140 billion.
B) $132 billion.
C) $136 billion.
D) $124 billion.
E) $128 billion.
A) $140 billion.
B) $132 billion.
C) $136 billion.
D) $124 billion.
E) $128 billion.
فتح الحزمة
افتح القفل للوصول البطاقات البالغ عددها 97 في هذه المجموعة.
فتح الحزمة
k this deck
66
If an increase of $10 billion in investment results in an increase in equilibrium expenditure of $40 billion, the multiplier equals
A) $10 billion × $40 billion = $400 billion.
B) $10 billion - $40 billion = -$30 billion.
C) $10 billion ÷ $40 billion = 0.25.
D) $40 billion ÷ $10 billion = 4.
E) $40 billion - $10 billion = $30 billion.
A) $10 billion × $40 billion = $400 billion.
B) $10 billion - $40 billion = -$30 billion.
C) $10 billion ÷ $40 billion = 0.25.
D) $40 billion ÷ $10 billion = 4.
E) $40 billion - $10 billion = $30 billion.
فتح الحزمة
افتح القفل للوصول البطاقات البالغ عددها 97 في هذه المجموعة.
فتح الحزمة
k this deck
67
If the MPC is 0.6 and there are no imports or income taxes, the multiplier is
A) 1.7.
B) 6.
C) 0.4.
D) 0.6.
E) 2.5.
A) 1.7.
B) 6.
C) 0.4.
D) 0.6.
E) 2.5.
فتح الحزمة
افتح القفل للوصول البطاقات البالغ عددها 97 في هذه المجموعة.
فتح الحزمة
k this deck
68
In an economy with no income taxes or imports, if the multiplier is 5, what does the MPC equal?
A) 0.9
B) 0.4
C) 0.8
D) 0.5
E) 0.2
A) 0.9
B) 0.4
C) 0.8
D) 0.5
E) 0.2
فتح الحزمة
افتح القفل للوصول البطاقات البالغ عددها 97 في هذه المجموعة.
فتح الحزمة
k this deck
69
In an economy in with no income taxes or imports, the multiplier equals
A) .
B) .
C) .
D) .
E) .
A) .
B) .
C) .
D) .
E) .
فتح الحزمة
افتح القفل للوصول البطاقات البالغ عددها 97 في هذه المجموعة.
فتح الحزمة
k this deck
70
The table above gives data for the nation of Mosh. If real GDP is $9 trillion, then unplanned inventory change equals
A) $5.5 trillion.
B) 0.
C) $5 trillion.
D) $9 trillion.
E) $1.25 trillion.
فتح الحزمة
افتح القفل للوصول البطاقات البالغ عددها 97 في هذه المجموعة.
فتح الحزمة
k this deck
71
The above table contains information about the nation of Syldavia. There are no income taxes or imports in this nation. The equilibrium expenditure is
A) $15 billion.
B) $30 billion.
C) $10 billion.
D) $20 billion.
E) $25 billion.
فتح الحزمة
افتح القفل للوصول البطاقات البالغ عددها 97 في هذه المجموعة.
فتح الحزمة
k this deck
72
The figure above shows two aggregate expenditure lines.In the figure above, what is the size of the multiplier?
A) 4.0
B) 0.25
C) $2 trillion
D) $0.5 trillion
E) More information is needed to determine the size of the multiplier.
فتح الحزمة
افتح القفل للوصول البطاقات البالغ عددها 97 في هذه المجموعة.
فتح الحزمة
k this deck
73
The expenditure multiplier is typically
A) negative.
B) greater than 1.
C) equal to 1.
D) less than 1 but greater than 0.
E) greater than 10.
A) negative.
B) greater than 1.
C) equal to 1.
D) less than 1 but greater than 0.
E) greater than 10.
فتح الحزمة
افتح القفل للوصول البطاقات البالغ عددها 97 في هذه المجموعة.
فتح الحزمة
k this deck
74
As a result of an initial increase in investment of $200 billion, real GDP increased by $800 billion. Given this information, the expenditure multiplier equals
A) 2.
B) 6.
C) 4.
D) 1/4.
E) $800 billion.
A) 2.
B) 6.
C) 4.
D) 1/4.
E) $800 billion.
فتح الحزمة
افتح القفل للوصول البطاقات البالغ عددها 97 في هذه المجموعة.
فتح الحزمة
k this deck
75
The above table contains information about the nation of Syldavia. There are no income taxes or imports in this nation. The expenditure multiplier is equal to
A) 10.
B) 2.
C) 1.25.
D) 5.
E) 0.8.
فتح الحزمة
افتح القفل للوصول البطاقات البالغ عددها 97 في هذه المجموعة.
فتح الحزمة
k this deck
76
A $1.5 trillion increase in investment leads equilibrium expenditure to increase from $7.0 trillion to $10.5 trillion. In this case, the expenditure multiplier is
A) 7.00.
B) 10.5.
C) 2.33.
D) 4.67.
E) 1.50.
A) 7.00.
B) 10.5.
C) 2.33.
D) 4.67.
E) 1.50.
فتح الحزمة
افتح القفل للوصول البطاقات البالغ عددها 97 في هذه المجموعة.
فتح الحزمة
k this deck
77
In the figure above, if real GDP is $20 trillion, aggregate planned expenditure is ________ $20 trillion and unplanned inventory changes are ________.
A) less than; positive
B) less than; negative
C) equal to; negative
D) equal to; positive
E) equal to; equals to zero
فتح الحزمة
افتح القفل للوصول البطاقات البالغ عددها 97 في هذه المجموعة.
فتح الحزمة
k this deck
78
In the figure above, if real GDP is $10 trillion, aggregate planned expenditure is
A) equal to $10 trillion and there are no unplanned inventory changes.
B) less than $10 trillion and unplanned inventory changes are positive.
C) more than $10 trillion and unplanned inventory changes are negative.
D) equal to $10 trillion and unplanned inventory changes are negative.
E) equal to $10 trillion and unplanned inventory changes are positive.
فتح الحزمة
افتح القفل للوصول البطاقات البالغ عددها 97 في هذه المجموعة.
فتح الحزمة
k this deck
79
The expenditure multiplier measures the change in
A) autonomous spending that results from a change in equilibrium expenditure.
B) equilibrium expenditure that results from a change in autonomous expenditure.
C) the price level that results from a change in real GDP.
D) consumption expenditure for a given change in disposable income.
E) equilibrium expenditure from a change in induced consumption.
فتح الحزمة
افتح القفل للوصول البطاقات البالغ عددها 97 في هذه المجموعة.
فتح الحزمة
k this deck
80
The figure above shows two aggregate expenditure lines.In the figure above, what would happen to the size of the multiplier if marginal income tax rates were increased?
A) The multiplier would fall in value and might become negative.
B) The multiplier would fall in value but would not become negative.
C) The multiplier would rise in value.
D) The multiplier would not change in value.
E) More information is needed to determine the effect on the size of the multiplier.
فتح الحزمة
افتح القفل للوصول البطاقات البالغ عددها 97 في هذه المجموعة.
فتح الحزمة
k this deck
فتح الحزمة
افتح القفل للوصول البطاقات البالغ عددها 97 في هذه المجموعة.


