Deck 53: Introduction to Ecology: Population Ecology
ملء الشاشة (f)
سؤال
سؤال
سؤال
سؤال
سؤال
سؤال
سؤال
سؤال
Figure 53-1
Use the figure to answer the corresponding question(s).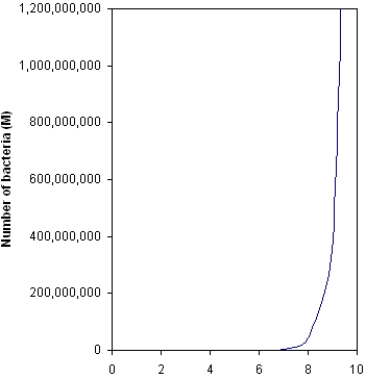
The graph in Figure 53-1 would best be described as:
A) being characteristic of exponential growth.
B) being characteristic of arithmetic growth.
C) an S-shaped curve.
D) a J-shaped curve.
E) being a J-shaped curve characteristic of exponential growth.
سؤال
سؤال
سؤال
سؤال
سؤال
سؤال
سؤال
سؤال
سؤال
سؤال
سؤال
سؤال
سؤال
Figure 53-2
Use the figure to answer the corresponding question(s).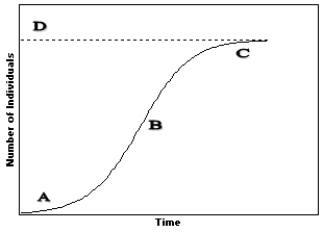
Using Figure 53-2, identify the point that indicates the carrying capacity for this population.
A) A
B) B
C) C
D) D
E) Cannot be determined from this graph.
Use the figure to answer the corresponding question(s).
Using Figure 53-2, identify the point that indicates the carrying capacity for this population.
A) A
B) B
C) C
D) D
E) Cannot be determined from this graph.
سؤال
سؤال
Figure 53-3
Use the figure to answer the corresponding question(s).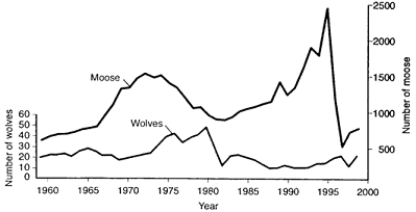
Based on Figure 53-3, the decline in the moose population in 1996 was most likely due to:
A) a predictable increase in the wolf population.
B) an unpredictable increase in the wolf population.
C) a decrease in the intrinsic rate of increase for the moose population.
D) a decline in the food supply.
E) an unknown disease organism.
سؤال
سؤال
Figure 53-4
Use the figure to answer the corresponding question(s).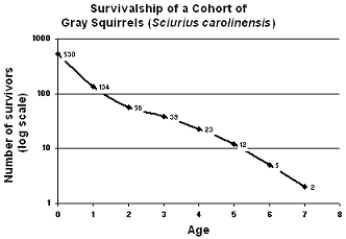
-Based on Figure 53-4, which of the following age intervals has the highest death rate?
A) 0-1
B) 1-2
C) 2-3
D) 3-4
E) 4-5
Use the figure to answer the corresponding question(s).
-Based on Figure 53-4, which of the following age intervals has the highest death rate?
A) 0-1
B) 1-2
C) 2-3
D) 3-4
E) 4-5
سؤال
Figure 53-2
Use the figure to answer the corresponding question(s).
Figure 53-2 models a __________-shaped growth curve.
A) J
B) S
C) r
D) K
E) b
Use the figure to answer the corresponding question(s).
Figure 53-2 models a __________-shaped growth curve.
A) J
B) S
C) r
D) K
E) b
سؤال
سؤال
سؤال
سؤال
سؤال
سؤال
Figure 53-4
Use the figure to answer the corresponding question(s).
Figure 53-4 is representative of:
A) exponential growth.
B) iteroparity.
C) Type I survivorship.
D) Type III survivorship.
E) Type II survivorship.
Use the figure to answer the corresponding question(s).
Figure 53-4 is representative of:
A) exponential growth.
B) iteroparity.
C) Type I survivorship.
D) Type III survivorship.
E) Type II survivorship.
سؤال
Figure 53-3
Use the figure to answer the corresponding question(s).
Using the data in Figure 53-3, the cause of the decline of the wolf population in 1982 was:
A) a sharp decrease in food supply.
B) a decrease in the intrinsic rate of increase for the wolf population.
C) competition with a newly introduced predator.
D) introduction of a disease organism.
E) cannot be determined from the data provided.
سؤال
Figure 53-2
Use the figure to answer the corresponding question(s).
Refer to Figure 53-2.At which point on the graph is the population increasing exponentially?
A) A
B) B
C) C
D) D
E) There is no exponential increase on this graph.
Use the figure to answer the corresponding question(s).
Refer to Figure 53-2.At which point on the graph is the population increasing exponentially?
A) A
B) B
C) C
D) D
E) There is no exponential increase on this graph.
سؤال
سؤال
سؤال
سؤال
سؤال
سؤال
سؤال
سؤال
سؤال
سؤال
سؤال
سؤال
سؤال
سؤال
Figure 53-6
Use the figure to answer the corresponding question(s).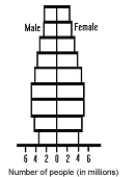
Figure 53-6 represents the age structure diagram of:
A) the transition stage.
B) the preindustrial state.
C) a moderately developed country.
D) a developing country.
E) a highly developed country.
Use the figure to answer the corresponding question(s).
Figure 53-6 represents the age structure diagram of:
A) the transition stage.
B) the preindustrial state.
C) a moderately developed country.
D) a developing country.
E) a highly developed country.
سؤال
سؤال
Figure 53-5
Use the figure to answer the corresponding question(s).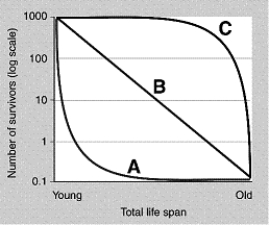
Refer to Figure 53-5.The survivorship curve for elephants would be represented by the curve labeled:
A) A
B) B
C) C
D) Either A or C.It would depend upon the species.
E) Elephant populations would be better represented by a curve falling between A and B.
سؤال
Figure 53-6
Use the figure to answer the corresponding question(s).
If the pattern remains the same, in 50 years the population in Figure 53-6 would:
A) be experiencing slow growth.
B) be experiencing rapid growth.
C) be experiencing steady state growth.
D) be experiencing negative growth.
E) No prediction could be made using these data.
سؤال
سؤال
سؤال
Figure 53-5
Use the figure to answer the corresponding question(s).
Refer to Figure 53-5.A population that produces a large number of offspring, but the offspring must survive independently, would be represented by the curve labeled:
A) A
B) B
C) C
D) Either A or B.
E) Either A, B, or C.
Use the figure to answer the corresponding question(s).
Refer to Figure 53-5.A population that produces a large number of offspring, but the offspring must survive independently, would be represented by the curve labeled:
A) A
B) B
C) C
D) Either A or B.
E) Either A, B, or C.
سؤال
سؤال
سؤال
سؤال
سؤال
سؤال
سؤال
سؤال
سؤال
سؤال
سؤال
سؤال
سؤال
سؤال
سؤال
سؤال
سؤال
سؤال
سؤال
سؤال
سؤال
سؤال
سؤال
سؤال
سؤال
سؤال

فتح الحزمة
قم بالتسجيل لفتح البطاقات في هذه المجموعة!
Unlock Deck
Unlock Deck
1/97
العب
ملء الشاشة (f)
Deck 53: Introduction to Ecology: Population Ecology
1
Which of the following series correctly represents the hierarchical organization within ecology?
A) ecosystem population community biosphere
B) biosphere community population ecosystem
C) community population ecosystem biosphere
D) population community ecosystem biosphere
E) population ecosystem community biosphere
A) ecosystem population community biosphere
B) biosphere community population ecosystem
C) community population ecosystem biosphere
D) population community ecosystem biosphere
E) population ecosystem community biosphere
population community ecosystem biosphere
2
Communities are composed of:
A) all of the communities of all the different populations that live together within an area.
B) all of the ecosystems within the biosphere.
C) all of the populations of all the different species that live together within an area.
D) all of the various dispersal patterns of the different species within a given area.
E) all of the population's females' combined reproductive capabilities within the same given unit of time.
C
3
Clumped dispersion is often influenced by all of the following except:
A) the presence of family groups.
B) asexual reproduction in plants or invertebrates.
C) limited seed dispersal in plants.
D) a patchy distribution of resources.
E) nesting territoriality.
A) the presence of family groups.
B) asexual reproduction in plants or invertebrates.
C) limited seed dispersal in plants.
D) a patchy distribution of resources.
E) nesting territoriality.
E
4
Which of the following consists of organisms all of which share a common gene pool?
A) a community
B) a population
C) a biosphere
D) an ecosystem
E) a landscape
A) a community
B) a population
C) a biosphere
D) an ecosystem
E) a landscape
فتح الحزمة
افتح القفل للوصول البطاقات البالغ عددها 97 في هذه المجموعة.
فتح الحزمة
k this deck
5
When r = 0.00001, the population size:
A) will increase.
B) will decrease.
C) is stable.
D) may increase or decrease, depending on K.
E) may increase or decrease, depending on i.
A) will increase.
B) will decrease.
C) is stable.
D) may increase or decrease, depending on K.
E) may increase or decrease, depending on i.
فتح الحزمة
افتح القفل للوصول البطاقات البالغ عددها 97 في هذه المجموعة.
فتح الحزمة
k this deck
6
What would be the growth rate (r) of an island population of 1000 that has 30 births per 100 population, 20 death per 100 population, 5 immigrants per 100 population, and 10 emigrants per 100 population?
A) +5
B) -50
C) +50
D) -150
E) +150
A) +5
B) -50
C) +50
D) -150
E) +150
فتح الحزمة
افتح القفل للوصول البطاقات البالغ عددها 97 في هذه المجموعة.
فتح الحزمة
k this deck
7
Which of the following organisms would have the highest intrinsic rate of increase?
A) bacteria
B) blue whales
C) red grouse
D) elephants
E) humans
A) bacteria
B) blue whales
C) red grouse
D) elephants
E) humans
فتح الحزمة
افتح القفل للوصول البطاقات البالغ عددها 97 في هذه المجموعة.
فتح الحزمة
k this deck
8
Figure 53-1
Use the figure to answer the corresponding question(s).
The graph in Figure 53-1 would best be described as:
A) being characteristic of exponential growth.
B) being characteristic of arithmetic growth.
C) an S-shaped curve.
D) a J-shaped curve.
E) being a J-shaped curve characteristic of exponential growth.
Use the figure to answer the corresponding question(s).
The graph in Figure 53-1 would best be described as:
A) being characteristic of exponential growth.
B) being characteristic of arithmetic growth.
C) an S-shaped curve.
D) a J-shaped curve.
E) being a J-shaped curve characteristic of exponential growth.
فتح الحزمة
افتح القفل للوصول البطاقات البالغ عددها 97 في هذه المجموعة.
فتح الحزمة
k this deck
9
Biologists in which of the following applied disciplines must understand population ecology?
A) forestry
B) agronomy
C) wildlife management
D) forestry and agronomy
E) forestry, agronomy, and wildlife management
A) forestry
B) agronomy
C) wildlife management
D) forestry and agronomy
E) forestry, agronomy, and wildlife management
فتح الحزمة
افتح القفل للوصول البطاقات البالغ عددها 97 في هذه المجموعة.
فتح الحزمة
k this deck
10
__________ is the least frequent of the dispersal patterns seen in nature.
A) Random dispersion
B) Aggregated distribution
C) Uniform dispersion
D) Density-dependent distribution
E) Clumped dispersion
A) Random dispersion
B) Aggregated distribution
C) Uniform dispersion
D) Density-dependent distribution
E) Clumped dispersion
فتح الحزمة
افتح القفل للوصول البطاقات البالغ عددها 97 في هذه المجموعة.
فتح الحزمة
k this deck
11
Which of the following would not increase population size?
A) natality
B) mortality
C) immigration
D) r greater than 1
E) r greater than 2
A) natality
B) mortality
C) immigration
D) r greater than 1
E) r greater than 2
فتح الحزمة
افتح القفل للوصول البطاقات البالغ عددها 97 في هذه المجموعة.
فتح الحزمة
k this deck
12
Which of the following sets of values would result in a population with a growth rate of zero?
A) b = 1000, d = 500, i = 750, e = 1000
B) b = 1000, d = 500, i = 1000, e = 1000
C) b = 1000, d = 500, i = 1500, e = 1000
D) b = 1000, d = 500, i = 0, e = 1000
E) b = 1000, d = 500, i = 500, e = 1000
A) b = 1000, d = 500, i = 750, e = 1000
B) b = 1000, d = 500, i = 1000, e = 1000
C) b = 1000, d = 500, i = 1500, e = 1000
D) b = 1000, d = 500, i = 0, e = 1000
E) b = 1000, d = 500, i = 500, e = 1000
فتح الحزمة
افتح القفل للوصول البطاقات البالغ عددها 97 في هذه المجموعة.
فتح الحزمة
k this deck
13
When the size of a population greatly exceeds K, it would be expected the population will:
A) rapidly increase.
B) slowly increase.
C) slowly decrease.
D) rapidly decrease.
E) stabilize.
A) rapidly increase.
B) slowly increase.
C) slowly decrease.
D) rapidly decrease.
E) stabilize.
فتح الحزمة
افتح القفل للوصول البطاقات البالغ عددها 97 في هذه المجموعة.
فتح الحزمة
k this deck
14
The logistic equation:
A) models a J-shaped growth curve.
B) takes into account the carrying capacity of the environment.
C) predicts continued exponential growth.
D) would characterize the uncontrolled growth of a population.
E) models a K-shaped growth curve.
A) models a J-shaped growth curve.
B) takes into account the carrying capacity of the environment.
C) predicts continued exponential growth.
D) would characterize the uncontrolled growth of a population.
E) models a K-shaped growth curve.
فتح الحزمة
افتح القفل للوصول البطاقات البالغ عددها 97 في هذه المجموعة.
فتح الحزمة
k this deck
15
Natural selection acts most directly on:
A) populations.
B) communities.
C) ecosystems.
D) the biosphere.
E) K-selected organisms.
A) populations.
B) communities.
C) ecosystems.
D) the biosphere.
E) K-selected organisms.
فتح الحزمة
افتح القفل للوصول البطاقات البالغ عددها 97 في هذه المجموعة.
فتح الحزمة
k this deck
16
Which of the following examples is incorrectly paired?
A) schooling fish-aggregated distribution
B) nesting seabirds-random dispersion
C) grove of aspen-clumped dispersion
D) flour beetle larvae-random dispersion
E) adult sand pine-uniform dispersion
A) schooling fish-aggregated distribution
B) nesting seabirds-random dispersion
C) grove of aspen-clumped dispersion
D) flour beetle larvae-random dispersion
E) adult sand pine-uniform dispersion
فتح الحزمة
افتح القفل للوصول البطاقات البالغ عددها 97 في هذه المجموعة.
فتح الحزمة
k this deck
17
The best definition of population density is:
A) the number of individuals of all species in a given area.
B) the number of individuals of one species in a given area.
C) the number of individuals in a given area at a given time.
D) the number of individuals of all species in a given area at a given time.
E) the number of individuals of one species in a given area at a given time.
فتح الحزمة
افتح القفل للوصول البطاقات البالغ عددها 97 في هذه المجموعة.
فتح الحزمة
k this deck
18
The term referring to the rate at which organisms produce offspring is:
A) doubling time.
B) natality.
C) emigration.
D) stasis.
E) survivorship.
A) doubling time.
B) natality.
C) emigration.
D) stasis.
E) survivorship.
فتح الحزمة
افتح القفل للوصول البطاقات البالغ عددها 97 في هذه المجموعة.
فتح الحزمة
k this deck
19
The organisms associated with patches of floating ocean vegetation would be an example of:
A) random dispersion
B) aggregated distribution
C) uniform dispersion
D) density-dependent distribution
E) clumped dispersion
A) random dispersion
B) aggregated distribution
C) uniform dispersion
D) density-dependent distribution
E) clumped dispersion
فتح الحزمة
افتح القفل للوصول البطاقات البالغ عددها 97 في هذه المجموعة.
فتح الحزمة
k this deck
20
When r = -0.00057, the population size:
A) will increase.
B) will decrease.
C) is stable.
D) may increase or decrease, depending on K.
E) may increase or decrease, depending on i.
A) will increase.
B) will decrease.
C) is stable.
D) may increase or decrease, depending on K.
E) may increase or decrease, depending on i.
فتح الحزمة
افتح القفل للوصول البطاقات البالغ عددها 97 في هذه المجموعة.
فتح الحزمة
k this deck
21
Figure 53-2
Use the figure to answer the corresponding question(s).
Using Figure 53-2, identify the point that indicates the carrying capacity for this population.
A) A
B) B
C) C
D) D
E) Cannot be determined from this graph.
Use the figure to answer the corresponding question(s).
Using Figure 53-2, identify the point that indicates the carrying capacity for this population.
A) A
B) B
C) C
D) D
E) Cannot be determined from this graph.
فتح الحزمة
افتح القفل للوصول البطاقات البالغ عددها 97 في هذه المجموعة.
فتح الحزمة
k this deck
22
Tawny owls (Strix aluco) pair-bond for life, with both members of a pair living and hunting in adjacent, well-defined territories.Their reproduction is regulated in accordance with the resources, especially the food supply, present in their territories.Tawny owls can best described as:
A) r strategists.
B) K strategists.
C) fecundists.
D) life historists.
E) scramblers.
A) r strategists.
B) K strategists.
C) fecundists.
D) life historists.
E) scramblers.
فتح الحزمة
افتح القفل للوصول البطاقات البالغ عددها 97 في هذه المجموعة.
فتح الحزمة
k this deck
23
Figure 53-3
Use the figure to answer the corresponding question(s).
Based on Figure 53-3, the decline in the moose population in 1996 was most likely due to:
A) a predictable increase in the wolf population.
B) an unpredictable increase in the wolf population.
C) a decrease in the intrinsic rate of increase for the moose population.
D) a decline in the food supply.
E) an unknown disease organism.
فتح الحزمة
افتح القفل للوصول البطاقات البالغ عددها 97 في هذه المجموعة.
فتح الحزمة
k this deck
24
Which factors would have a greater influence than natural selection?
A) density dependent
B) density independent
C) intraspecific competition
D) interspecific competition
E) carrying capacity
A) density dependent
B) density independent
C) intraspecific competition
D) interspecific competition
E) carrying capacity
فتح الحزمة
افتح القفل للوصول البطاقات البالغ عددها 97 في هذه المجموعة.
فتح الحزمة
k this deck
25
Figure 53-4
Use the figure to answer the corresponding question(s).
-Based on Figure 53-4, which of the following age intervals has the highest death rate?
A) 0-1
B) 1-2
C) 2-3
D) 3-4
E) 4-5
Use the figure to answer the corresponding question(s).
-Based on Figure 53-4, which of the following age intervals has the highest death rate?
A) 0-1
B) 1-2
C) 2-3
D) 3-4
E) 4-5
فتح الحزمة
افتح القفل للوصول البطاقات البالغ عددها 97 في هذه المجموعة.
فتح الحزمة
k this deck
26
Figure 53-2
Use the figure to answer the corresponding question(s).
Figure 53-2 models a __________-shaped growth curve.
A) J
B) S
C) r
D) K
E) b
Use the figure to answer the corresponding question(s).
Figure 53-2 models a __________-shaped growth curve.
A) J
B) S
C) r
D) K
E) b
فتح الحزمة
افتح القفل للوصول البطاقات البالغ عددها 97 في هذه المجموعة.
فتح الحزمة
k this deck
27
Pest or weedy species are typically __________ and exhibit type __________ survivorship curves.
A) r-selected; I
B) r-selected; II
C) r-selected; III
D) K-selected; I
E) K-selected; III
A) r-selected; I
B) r-selected; II
C) r-selected; III
D) K-selected; I
E) K-selected; III
فتح الحزمة
افتح القفل للوصول البطاقات البالغ عددها 97 في هذه المجموعة.
فتح الحزمة
k this deck
28
An example of a density-dependent factor that influences the size of a population is:
A) rainfall.
B) temperature.
C) a fire.
D) parasites.
E) an earthquake.
A) rainfall.
B) temperature.
C) a fire.
D) parasites.
E) an earthquake.
فتح الحزمة
افتح القفل للوصول البطاقات البالغ عددها 97 في هذه المجموعة.
فتح الحزمة
k this deck
29
Organisms such as oysters or fish that produce millions of eggs per year may be characterized as:
A) r-selected and having a type I survivorship curve.
B) K-selected and having a type I survivorship curve.
C) r-selected and having a type II survivorship curve.
D) K-selected and having a type II survivorship curve.
E) r-selected and having a type III survivorship curve.
A) r-selected and having a type I survivorship curve.
B) K-selected and having a type I survivorship curve.
C) r-selected and having a type II survivorship curve.
D) K-selected and having a type II survivorship curve.
E) r-selected and having a type III survivorship curve.
فتح الحزمة
افتح القفل للوصول البطاقات البالغ عددها 97 في هذه المجموعة.
فتح الحزمة
k this deck
30
Iteroparity is common in which of the following organisms?
A) perennial herbaceous plants
B) most insects
C) agaves
D) most invertebrates
E) Pacific salmon
A) perennial herbaceous plants
B) most insects
C) agaves
D) most invertebrates
E) Pacific salmon
فتح الحزمة
افتح القفل للوصول البطاقات البالغ عددها 97 في هذه المجموعة.
فتح الحزمة
k this deck
31
The potential capacity to produce offspring is called:
A) life history traits.
B) fitness.
C) age structure.
D) density.
E) fecundity.
A) life history traits.
B) fitness.
C) age structure.
D) density.
E) fecundity.
فتح الحزمة
افتح القفل للوصول البطاقات البالغ عددها 97 في هذه المجموعة.
فتح الحزمة
k this deck
32
Figure 53-4
Use the figure to answer the corresponding question(s).
Figure 53-4 is representative of:
A) exponential growth.
B) iteroparity.
C) Type I survivorship.
D) Type III survivorship.
E) Type II survivorship.
Use the figure to answer the corresponding question(s).
Figure 53-4 is representative of:
A) exponential growth.
B) iteroparity.
C) Type I survivorship.
D) Type III survivorship.
E) Type II survivorship.
فتح الحزمة
افتح القفل للوصول البطاقات البالغ عددها 97 في هذه المجموعة.
فتح الحزمة
k this deck
33
Figure 53-3
Use the figure to answer the corresponding question(s).
Using the data in Figure 53-3, the cause of the decline of the wolf population in 1982 was:
A) a sharp decrease in food supply.
B) a decrease in the intrinsic rate of increase for the wolf population.
C) competition with a newly introduced predator.
D) introduction of a disease organism.
E) cannot be determined from the data provided.
فتح الحزمة
افتح القفل للوصول البطاقات البالغ عددها 97 في هذه المجموعة.
فتح الحزمة
k this deck
34
Figure 53-2
Use the figure to answer the corresponding question(s).
Refer to Figure 53-2.At which point on the graph is the population increasing exponentially?
A) A
B) B
C) C
D) D
E) There is no exponential increase on this graph.
Use the figure to answer the corresponding question(s).
Refer to Figure 53-2.At which point on the graph is the population increasing exponentially?
A) A
B) B
C) C
D) D
E) There is no exponential increase on this graph.
فتح الحزمة
افتح القفل للوصول البطاقات البالغ عددها 97 في هذه المجموعة.
فتح الحزمة
k this deck
35
Populations that experience significant contest competition:
A) show small changes in population size over time.
B) show great changes in population size over time.
C) are particularly susceptible to extinction.
D) show little intraspecific competition.
E) are characteristic of environments with abundant resources.
A) show small changes in population size over time.
B) show great changes in population size over time.
C) are particularly susceptible to extinction.
D) show little intraspecific competition.
E) are characteristic of environments with abundant resources.
فتح الحزمة
افتح القفل للوصول البطاقات البالغ عددها 97 في هذه المجموعة.
فتح الحزمة
k this deck
36
Generally, r-selected organisms exhibit:
A) short life spans and early maturity.
B) long life spans and extended parental care of offspring.
C) long development time to maturity, but small body size.
D) large body size and extended parental care of offspring.
E) large body size, but short life spans.
A) short life spans and early maturity.
B) long life spans and extended parental care of offspring.
C) long development time to maturity, but small body size.
D) large body size and extended parental care of offspring.
E) large body size, but short life spans.
فتح الحزمة
افتح القفل للوصول البطاقات البالغ عددها 97 في هذه المجموعة.
فتح الحزمة
k this deck
37
When two members of the same species compete for a limited resource, resulting in equal sharing of the limited resource, it is termed:
A) interspecific scramble competition.
B) intraspecific scramble competition.
C) interspecific contest competition.
D) intraspecific contest competition.
E) density-independent competition.
A) interspecific scramble competition.
B) intraspecific scramble competition.
C) interspecific contest competition.
D) intraspecific contest competition.
E) density-independent competition.
فتح الحزمة
افتح القفل للوصول البطاقات البالغ عددها 97 في هذه المجموعة.
فتح الحزمة
k this deck
38
Features that are typical of K-selected organisms include all of the following except:
A) late reproduction.
B) slow development.
C) a low reproductive rate.
D) large body size.
E) little parental care of offspring.
A) late reproduction.
B) slow development.
C) a low reproductive rate.
D) large body size.
E) little parental care of offspring.
فتح الحزمة
افتح القفل للوصول البطاقات البالغ عددها 97 في هذه المجموعة.
فتح الحزمة
k this deck
39
Density-independent factors:
A) influence population size and are in turn influenced by changes in population density.
B) may be the result of intense interspecific competition.
C) are typically abiotic.
D) may include parasites.
E) may include diseases.
A) influence population size and are in turn influenced by changes in population density.
B) may be the result of intense interspecific competition.
C) are typically abiotic.
D) may include parasites.
E) may include diseases.
فتح الحزمة
افتح القفل للوصول البطاقات البالغ عددها 97 في هذه المجموعة.
فتح الحزمة
k this deck
40
The moose population on Isle Royale is an example of:
A) interspecific scramble competition.
B) intraspecific scramble competition.
C) interspecific contest competition.
D) intraspecific contest competition.
E) both intraspecific contest competition and scramble competition.
A) interspecific scramble competition.
B) intraspecific scramble competition.
C) interspecific contest competition.
D) intraspecific contest competition.
E) both intraspecific contest competition and scramble competition.
فتح الحزمة
افتح القفل للوصول البطاقات البالغ عددها 97 في هذه المجموعة.
فتح الحزمة
k this deck
41
The Earth's carrying capacity is:
A) 1 billion.
B) 1 million.
C) 4 billion.
D) 16 billion.
E) unknown.
A) 1 billion.
B) 1 million.
C) 4 billion.
D) 16 billion.
E) unknown.
فتح الحزمة
افتح القفل للوصول البطاقات البالغ عددها 97 في هذه المجموعة.
فتح الحزمة
k this deck
42
Less-developed countries may be characterized by:
A) low fertility rates.
B) high GNI PPPs.
C) low doubling times.
D) high use of contraception.
E) high infant mortality rates.
A) low fertility rates.
B) high GNI PPPs.
C) low doubling times.
D) high use of contraception.
E) high infant mortality rates.
فتح الحزمة
افتح القفل للوصول البطاقات البالغ عددها 97 في هذه المجموعة.
فتح الحزمة
k this deck
43
The world human population has increased dramatically during the past few centuries due to:
A) increased immigration.
B) increased emigration.
C) decreased death rates.
D) increased birth rates.
E) decreased birth rates.
A) increased immigration.
B) increased emigration.
C) decreased death rates.
D) increased birth rates.
E) decreased birth rates.
فتح الحزمة
افتح القفل للوصول البطاقات البالغ عددها 97 في هذه المجموعة.
فتح الحزمة
k this deck
44
A human population that is shrinking would be characterized by:
A) a large proportion of prereproductive individuals.
B) a small proportion of prereproductive individuals.
C) a large proportion of reproductive individuals.
D) an equal number of individuals of all age groups.
E) a small proportion of postreproductive individuals.
A) a large proportion of prereproductive individuals.
B) a small proportion of prereproductive individuals.
C) a large proportion of reproductive individuals.
D) an equal number of individuals of all age groups.
E) a small proportion of postreproductive individuals.
فتح الحزمة
افتح القفل للوصول البطاقات البالغ عددها 97 في هذه المجموعة.
فتح الحزمة
k this deck
45
These are good habitats where local reproductive success is greater than local mortality:
A) metahabitats.
B) sink habitats.
C) source populations.
D) source habitats.
E) r-selected habitats.
A) metahabitats.
B) sink habitats.
C) source populations.
D) source habitats.
E) r-selected habitats.
فتح الحزمة
افتح القفل للوصول البطاقات البالغ عددها 97 في هذه المجموعة.
فتح الحزمة
k this deck
46
Write out the growth equation including the following factors: natality, mortality, immigration, and emigration.Provide a one-sentence explanation for the impact of each of these factors on the population growth rate.
فتح الحزمة
افتح القفل للوصول البطاقات البالغ عددها 97 في هذه المجموعة.
فتح الحزمة
k this deck
47
By the end of the 21st century, it is expected that the human population will:
A) increase at the fastest rate in the highly developed countries.
B) increase at the fastest rate in the less developed countries.
C) increase at similar rates in all countries.
D) decrease at similar rates in all countries.
E) achieve zero population growth.
A) increase at the fastest rate in the highly developed countries.
B) increase at the fastest rate in the less developed countries.
C) increase at similar rates in all countries.
D) decrease at similar rates in all countries.
E) achieve zero population growth.
فتح الحزمة
افتح القفل للوصول البطاقات البالغ عددها 97 في هذه المجموعة.
فتح الحزمة
k this deck
48
Figure 53-6
Use the figure to answer the corresponding question(s).
Figure 53-6 represents the age structure diagram of:
A) the transition stage.
B) the preindustrial state.
C) a moderately developed country.
D) a developing country.
E) a highly developed country.
Use the figure to answer the corresponding question(s).
Figure 53-6 represents the age structure diagram of:
A) the transition stage.
B) the preindustrial state.
C) a moderately developed country.
D) a developing country.
E) a highly developed country.
فتح الحزمة
افتح القفل للوصول البطاقات البالغ عددها 97 في هذه المجموعة.
فتح الحزمة
k this deck
49
These generally have greater population densities than less suitable sites:
A) metahabitats.
B) sink habitats.
C) source populations.
D) source habitats.
E) K-selected habitats.
A) metahabitats.
B) sink habitats.
C) source populations.
D) source habitats.
E) K-selected habitats.
فتح الحزمة
افتح القفل للوصول البطاقات البالغ عددها 97 في هذه المجموعة.
فتح الحزمة
k this deck
50
Figure 53-5
Use the figure to answer the corresponding question(s).
Refer to Figure 53-5.The survivorship curve for elephants would be represented by the curve labeled:
A) A
B) B
C) C
D) Either A or C.It would depend upon the species.
E) Elephant populations would be better represented by a curve falling between A and B.
فتح الحزمة
افتح القفل للوصول البطاقات البالغ عددها 97 في هذه المجموعة.
فتح الحزمة
k this deck
51
Figure 53-6
Use the figure to answer the corresponding question(s).
If the pattern remains the same, in 50 years the population in Figure 53-6 would:
A) be experiencing slow growth.
B) be experiencing rapid growth.
C) be experiencing steady state growth.
D) be experiencing negative growth.
E) No prediction could be made using these data.
فتح الحزمة
افتح القفل للوصول البطاقات البالغ عددها 97 في هذه المجموعة.
فتح الحزمة
k this deck
52
Which of the following pairs is incorrect?
A) highly developed countries-infant mortality rate close to 7 per 1000
B) moderately developed countries-fertility rate near 2
C) less developed countries-fertility rate near 5
D) Worldwide-27% of the population is less than 15 years old
E) United States-doubling time 100 years
A) highly developed countries-infant mortality rate close to 7 per 1000
B) moderately developed countries-fertility rate near 2
C) less developed countries-fertility rate near 5
D) Worldwide-27% of the population is less than 15 years old
E) United States-doubling time 100 years
فتح الحزمة
افتح القفل للوصول البطاقات البالغ عددها 97 في هذه المجموعة.
فتح الحزمة
k this deck
53
A population that is divided into several local populations among which individuals occasionally disperse (emigrate and immigrate) is known as a:
A) metapopulation.
B) life table.
C) survivorship curve.
D) source population.
E) sink population.
A) metapopulation.
B) life table.
C) survivorship curve.
D) source population.
E) sink population.
فتح الحزمة
افتح القفل للوصول البطاقات البالغ عددها 97 في هذه المجموعة.
فتح الحزمة
k this deck
54
Figure 53-5
Use the figure to answer the corresponding question(s).
Refer to Figure 53-5.A population that produces a large number of offspring, but the offspring must survive independently, would be represented by the curve labeled:
A) A
B) B
C) C
D) Either A or B.
E) Either A, B, or C.
Use the figure to answer the corresponding question(s).
Refer to Figure 53-5.A population that produces a large number of offspring, but the offspring must survive independently, would be represented by the curve labeled:
A) A
B) B
C) C
D) Either A or B.
E) Either A, B, or C.
فتح الحزمة
افتح القفل للوصول البطاقات البالغ عددها 97 في هذه المجموعة.
فتح الحزمة
k this deck
55
The percentages of a population at different ages are known as the:
A) growth rate.
B) age structure.
C) biotic potential.
D) density.
E) fecundity.
A) growth rate.
B) age structure.
C) biotic potential.
D) density.
E) fecundity.
فتح الحزمة
افتح القفل للوصول البطاقات البالغ عددها 97 في هذه المجموعة.
فتح الحزمة
k this deck
56
In a human population with a high proportion of prereproductive individuals, the population will:
A) continue to increase even if the fertility rate is at replacement levels.
B) decline even if the fertility rate is at replacement levels.
C) increase only if the fertility rate is above replacement levels.
D) decline only if the replacement level fertility rate changes.
E) reach ZPG sooner than with a low proportion of prereproductive individuals.
فتح الحزمة
افتح القفل للوصول البطاقات البالغ عددها 97 في هذه المجموعة.
فتح الحزمة
k this deck
57
The average number of children born to a woman during her lifetime is known as:
A) age structure.
B) replacement-level fertility.
C) natality.
D) total fertility rate.
E) infant mortality rate.
A) age structure.
B) replacement-level fertility.
C) natality.
D) total fertility rate.
E) infant mortality rate.
فتح الحزمة
افتح القفل للوصول البطاقات البالغ عددها 97 في هذه المجموعة.
فتح الحزمة
k this deck
58
Surplus individuals in the __________ disperse and find another habitat in which to settle and reproduce.
A) metahabitats
B) sink habitats
C) source populations
D) source habitats
E) K-selected populations.
A) metahabitats
B) sink habitats
C) source populations
D) source habitats
E) K-selected populations.
فتح الحزمة
افتح القفل للوصول البطاقات البالغ عددها 97 في هذه المجموعة.
فتح الحزمة
k this deck
59
In a population characterized by type III survivorship, the probability of survival __________ with age.
A) increases
B) decreases
C) does not change
D) first decreases then increases
E) first increases then decreases
A) increases
B) decreases
C) does not change
D) first decreases then increases
E) first increases then decreases
فتح الحزمة
افتح القفل للوصول البطاقات البالغ عددها 97 في هذه المجموعة.
فتح الحزمة
k this deck
60
This British clergyman and economist was one of the first to recognize that the human population cannot continue to increase indefinitely:
A) Malthus
B) Gause
C) Schoener
D) Peterson
E) Hastings
A) Malthus
B) Gause
C) Schoener
D) Peterson
E) Hastings
فتح الحزمة
افتح القفل للوصول البطاقات البالغ عددها 97 في هذه المجموعة.
فتح الحزمة
k this deck
61
Members of a(n) r-selected species typically have a short lifespan.
____________________
____________________
فتح الحزمة
افتح القفل للوصول البطاقات البالغ عددها 97 في هذه المجموعة.
فتح الحزمة
k this deck
62
Compare and contrast Type I and Type III survivorship curves.Sketch a correctly labeled graph to support your comparison.BONUS: Identify two organisms that represent each of the two types of survivorship strategies discussed here.
فتح الحزمة
افتح القفل للوصول البطاقات البالغ عددها 97 في هذه المجموعة.
فتح الحزمة
k this deck
63
Interference competition is also called contest competition.
____________________
____________________
فتح الحزمة
افتح القفل للوصول البطاقات البالغ عددها 97 في هذه المجموعة.
فتح الحزمة
k this deck
64
Sketch an exponential growth curve with correctly labeled axes.Identify two organisms and the conditions under which they might demonstrate such growth.
فتح الحزمة
افتح القفل للوصول البطاقات البالغ عددها 97 في هذه المجموعة.
فتح الحزمة
k this deck
65
In Type-I survivorship, the young have a high probability of surviving.
____________________
____________________
فتح الحزمة
افتح القفل للوصول البطاقات البالغ عددها 97 في هذه المجموعة.
فتح الحزمة
k this deck
66
Consumption overpopulation occurs when each individual in a population consumes too large a share of resources.
____________________
____________________
فتح الحزمة
افتح القفل للوصول البطاقات البالغ عددها 97 في هذه المجموعة.
فتح الحزمة
k this deck
67
Oysters have a Type-II survivorship curve.
____________________
____________________
فتح الحزمة
افتح القفل للوصول البطاقات البالغ عددها 97 في هذه المجموعة.
فتح الحزمة
k this deck
68
Territoriality often results in clumped dispersion.
____________________
____________________
فتح الحزمة
افتح القفل للوصول البطاقات البالغ عددها 97 في هذه المجموعة.
فتح الحزمة
k this deck
69
Scramble competition results when all individuals in a population share the limited resources.
____________________
____________________
فتح الحزمة
افتح القفل للوصول البطاقات البالغ عددها 97 في هذه المجموعة.
فتح الحزمة
k this deck
70
A(n) exponential growth curve levels off at the carrying capacity.
____________________
____________________
فتح الحزمة
افتح القفل للوصول البطاقات البالغ عددها 97 في هذه المجموعة.
فتح الحزمة
k this deck
71
K strategists typically produce large numbers of offspring.
____________________
____________________
فتح الحزمة
افتح القفل للوصول البطاقات البالغ عددها 97 في هذه المجموعة.
فتح الحزمة
k this deck
72
An example of a density-independent factor is predation.
____________________
____________________
فتح الحزمة
افتح القفل للوصول البطاقات البالغ عددها 97 في هذه المجموعة.
فتح الحزمة
k this deck
73
An exponential growth curve has a J shape.
____________________
____________________
فتح الحزمة
افتح القفل للوصول البطاقات البالغ عددها 97 في هذه المجموعة.
فتح الحزمة
k this deck
74
The largest population that can be maintained in an environment for an indefinite period of time is called the carrying capacity.
____________________
____________________
فتح الحزمة
افتح القفل للوصول البطاقات البالغ عددها 97 في هذه المجموعة.
فتح الحزمة
k this deck
75
Species that exhibit repeated reproductive cycles are said to be semelparous.
____________________
____________________
فتح الحزمة
افتح القفل للوصول البطاقات البالغ عددها 97 في هذه المجموعة.
فتح الحزمة
k this deck
76
Source habitats are areas where reproductive success is less than local mortality.
____________________
____________________
فتح الحزمة
افتح القفل للوصول البطاقات البالغ عددها 97 في هذه المجموعة.
فتح الحزمة
k this deck
77
Most insects and invertebrates are said to be iteroparous.
____________________
____________________
فتح الحزمة
افتح القفل للوصول البطاقات البالغ عددها 97 في هذه المجموعة.
فتح الحزمة
k this deck
78
A density-dependent factor is an example of a negative feedback system.
____________________
____________________
فتح الحزمة
افتح القفل للوصول البطاقات البالغ عددها 97 في هذه المجموعة.
فتح الحزمة
k this deck
79
A killing frost is an example of a density-independent factor.
____________________
____________________
فتح الحزمة
افتح القفل للوصول البطاقات البالغ عددها 97 في هذه المجموعة.
فتح الحزمة
k this deck
80
The most common spacing is random dispersion.
____________________
____________________
فتح الحزمة
افتح القفل للوصول البطاقات البالغ عددها 97 في هذه المجموعة.
فتح الحزمة
k this deck
فتح الحزمة
افتح القفل للوصول البطاقات البالغ عددها 97 في هذه المجموعة.


