Deck 13: Measuring and Evaluating Financial Performance
ملء الشاشة (f)
سؤال
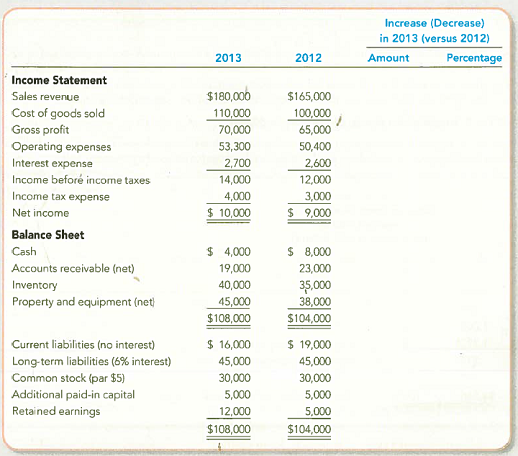
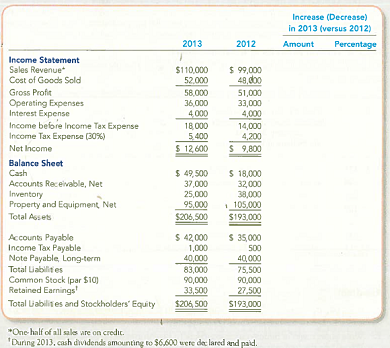
Analyzing Comparative Financial Statements Using Horizontal Analyses
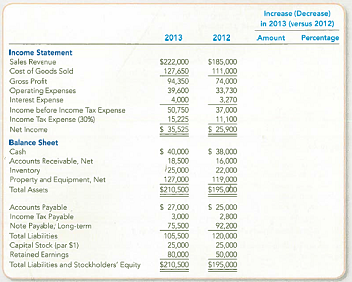
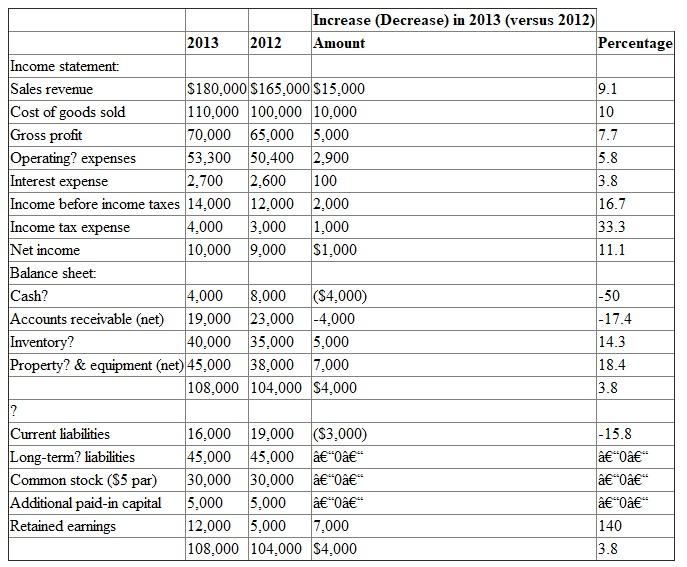
The comparative financial statements prepared at December 31, 2013, for Golden Corporation showed the following summarized data:
Required:
1. Complete the two final columns shown beside each item in Golden Corporation's comparative financial statements. Round the percentages to one decimal place.
TIP: Calculate the Increase (decrease) by subtracting 2012 from 2013. Calculate the percentage by dividing the amount of increase (decrease) by the 2012 balance.
2. Use the horizontal (trend) analyses to identify (a) a large percentage change in one account that is accompanied by a small dollar change, and (b) a directional change in one account balance that is inconsistent with the direction of change in a related account balance.
سؤال
Vertical Analysis of a Balance Sheet
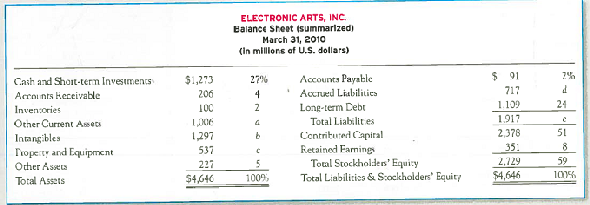
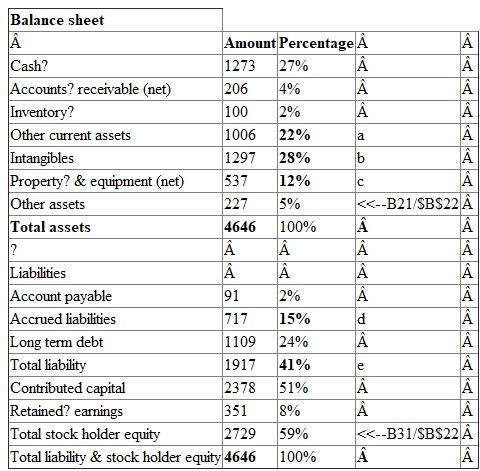
Electronic Arts is a video game company that competes with Activision. A condensed balance sheet for Electronic Arts and a partially completed vertical analysis are presented below.
Required:
1. Complete the vertical analysis by computing each line item ( a )-( e ) as a percentage of total assets. Round to the nearest whole percentage.
TIP: Inventories were 2 percent of total assets, computed as ($100 ÷ $4,646) × 100.
2. What percentages of Electronic Arts' assets relate to intangibles versus property and equipment What business reasons would explain this relative emphasis
سؤال
Interpreting Profitability, Liquidity, Solvency, and P/E Ratios
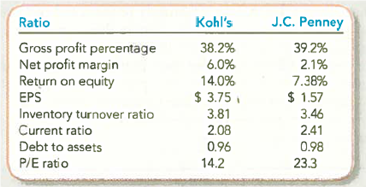
Kohl's Corporation is a national retail department store. The company's total revenues for the year ended January 29, 2010, were $18 billion. J.C. Penney is a similar size department store company with $18 billion of revenues. The following ratios for the two companies were obtained for that fiscal year from reuters.com/finance:
Required:
1. Which company appears more profitable Describe the ratio(s) that you used to reach this decision.
2. Which company appears more liquid Describe the ratio(s) that you used to reach this decision.
3. Which company appears more solvent Describe the ratio(s) that you used to reach this decision.
4. Are the conclusions from your analyses in requirements 1-3 consistent with the value of the two companies, as suggested by their P/E ratios If not, offer one explanation for any apparent inconsistency.
TIP: Remember that the stock price in the top of the P/E ratio represents investors' expectations about future financial performance whereas the bottom number reports past financial performance.
سؤال
Analyzing an Investment by Comparing Selected Ratios
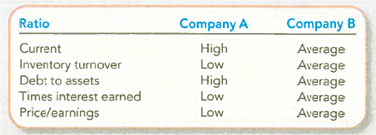
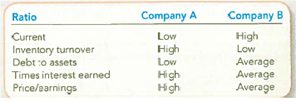
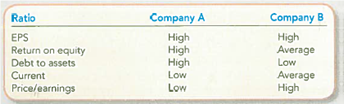
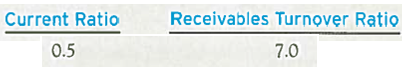
You have the opportunity to invest $10,000 in one of two companies from a single industry. The only information you have follows. The word high refers to the top third of the industry; average is the middle third; low is the bottom third.
Required:
Which company would you select Write a brief explanation for your recommendation.
TIP: When interpreting ratios, think about how they are related to one another. For example, the current ratio and the inventory turnover ratio both include the Inventory balance. This means that the low inventory turnover ratio can help you to interpret the high current ratio.
سؤال
سؤال
سؤال
Preparing and Interpreting a Schedule for Horizontal and Vertical Analyses
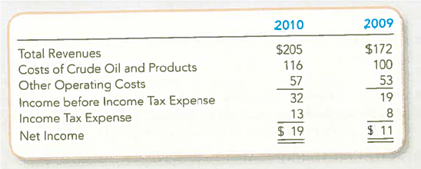
The average price of a gallon of gas in 2010 jumped $0.43 (18 percent) from $2.36 in 2009 (to $2.79 in 2010). Let's see whether these changes are reflected in the income statement of Chevron Corporation for the year ended December 31, 2010 (amounts in billions).
Required:
1. Conduct a horizontal analysis by calculating the year-over-year changes in each line item, expressed in dollars and in percentages (rounded to one decimal place). How did the change in gas prices compare to the changes in Chevron's total revenues and costs of crude oil and products
2. Conduct a vertical analysis by expressing each line as a percentage of total revenues (round to one decimal place). Excluding income tax and other operating costs, did Chevron earn more profit per dollar of revenue in 2010 compared to 2009
سؤال
Preparing and Interpreting a Schedule for Horizontal and Vertical Analyses
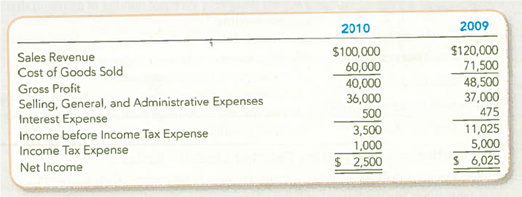
According to the producer price index database maintained by the Bureau of Labor Statistics, the average cost of computer equipment fell 4.8 percent between 2009 and 2010. Let's see whether these changes are reflected in the income statement of Computer Tycoon Inc. for the year ended December 31, 2010.
Required:
1. Conduct a horizontal analysis by calculating the year-over-year changes in each line item, expressed in dollars and in percentages (rounded to one decimal place). How did the change in computer prices compare to the changes in Computer Tycoon's sales revenues
2. Conduct a vertical analysis by expressing each line as a percentage of total revenues (round to one decimal place). Excluding income tax, interest, and operating expenses, did Computer Tycoon earn more profit per dollar of sales in 2010 compared to 2009
سؤال
سؤال
Computing and Interpreting Selected Liquidity Ratios
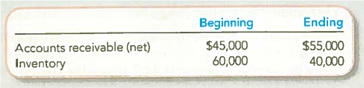
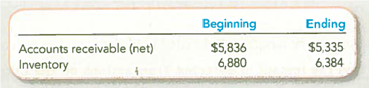
Double West Suppliers (DWS) reported sales for the year of $300,000, all on credit. The average gross profit percentage was 40 percent on sales. Account balances follow:
Required:
1. Compute the turnover ratios for accounts receivable and inventory (round to one decimal place).
2. By dividing 365 by your ratios from requirement 1, calculate the average days to collect receivables and the average days to sell inventory (round to one decimal place).
3. Explain what each of these ratios and measures mean for DWS.
سؤال
سؤال
سؤال
سؤال
سؤال
سؤال
سؤال
سؤال
سؤال
Calculations for Horizontal Analyses
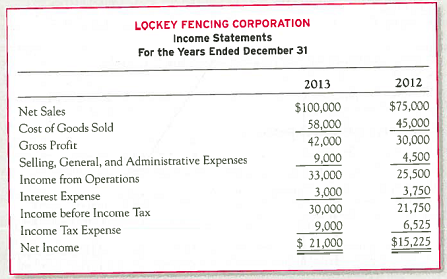
Using the following income statements, perform the calculations needed for horizontal analyses. Round percentages to one decimal place.
Using the following income statements, perform the calculations needed for horizontal analyses. Round percentages to one decimal place.
سؤال
سؤال
سؤال
Computing the Return on Equity Ratio
Given the following data, compute the 2013 return on equity ratio (expressed as a percentage with one decimal place).
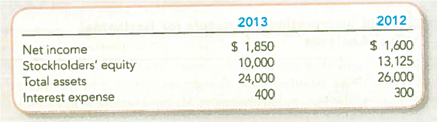
Given the following data, compute the 2013 return on equity ratio (expressed as a percentage with one decimal place).
سؤال
سؤال
Analyzing Financial Statements Using Horizontal Analyses
The comparative financial statements prepared at December 31, 2013, for Pinnacle Plus showed the following summarized data:
Required:
1. Complete the two final columns shown beside each item in Pinnacle Plus's comparative financial statements. Round the percentages to one decimal place.
2. Which account increased by the largest dollar amount Which account increased by the largest percentage
سؤال
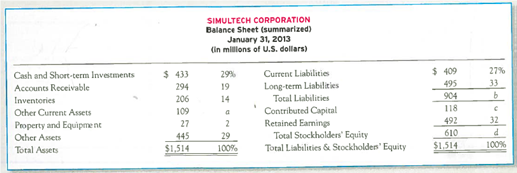
Verbal Analysis of a Balance Sheet
A condensed balance sheet for Simultech Corporation and a partially completed vertical analysis are presented below.
Required:
1. Complete the vertical analysis by computing each line item ( a )-( d ) as a percentage of total assets. Round to the nearest whole percentage.
2. What percentages of Simultech's assets relate to inventories versus property and equipment What does this tell you about the relative significance of these two assets to Simultech's business
3. What percentage of Simultech's assets is financed by total stockholder's equity By total liabilities
سؤال
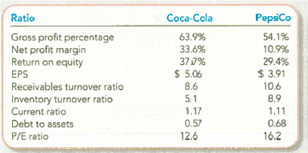
Interpreting Profitability, Liquidity, Solvency, and P/E Ratios
Coke and Pepsi are well-known international brands. Coca-Cola sells more than $35 billion worth of beverages each year while annual sales of Pepsi products exceed $43 billion. Compare the two companies as a potential investment based on the following ratios:
Required:
1. Which company appears more profitable Describe the ratio(s) that you used to reach this decision.
2. Which company appears more liquid Describe the ratio(s) that you used to reach this
3. Which company appears more solvent Describe the ratio(s) that you used to reach this decision.
4. Are the conclusions from your analyses in requirements 1-3 consistent with the value of the two companies, as suggested by their P/E ratios If not, offer one explanation for any apparent inconsistency.
سؤال
Analyzing an Investment by Comparing Selected Ratios
You have the opportunity to invest $10,000 in one of two companies from a single industry. The only information you have is shown here. The word high refers to the top third of the industry; average is the middle third; low is the bottom third.
Required:
Which company would you select Write a brief explanation for your recommendation.
سؤال
سؤال
Analyzing Financial Statements Using Horizontal and Ratio Analyses
The comparative financial statements prepared at December 31, 2013, for Tiger Audio showed the following summarized data:
Required:
1. Complete the two final columns shown beside each item in Tiger Audio's comparative financial statements. Round the percentages to one decimal place.
2. Which account increased by the largest dollar amount! Which account increased by the largest percentage
سؤال
Vertical Analysis of a Balance Sheet
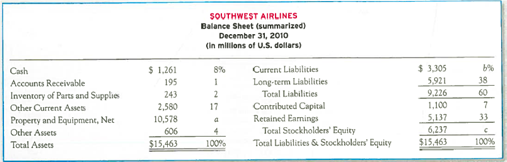
A condensed balance sheet for Southwest Airlines and a partially completed vertical analysis are presented below.
Required:
1. Complete the vertical analysis by computing each line item ( a )-( c ) as a percentage of total assets. Round to the nearest whole percentage.
2. What percentages of Southwest's assets relate to inventory of parts and supplies versus property and equipment What does this tell you about the relative significance of these two assets to Southwest's business
3. What percentage of Southwest s assets is financed by total stockholders' equity By total liabilities
سؤال
Interpreting Profitability, Liquidity, Solvency, and P/E Ratios
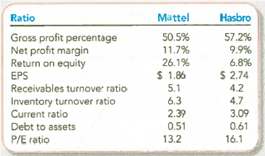
Mattel and Hasbro are the two biggest makers of games and toys in the world. Martel sells nearly $6 billion of products each year while annual sales of Hasbro products exceed $4 billion. Compare the two companies as a potential investment based on the following ratios:
Required:
1. Which company appears more profitable Describe the ratio(s) that you used to reach this decision.
2. Which company appears more liquid Describe the ratio(s) that you used to reach this decision.
3. Which company appears more solvent Describe the ratio(s) that you used to reach this decision.
4. Are the conclusions from your analyses in requirements 1-3 consistent with the value of the two companies, as suggested by their P/E ratios If not, offer one explanation for any apparent inconsistency.
سؤال
Analyzing an Investment by Comparing Selected Ratios
You have the opportunity to invest $10,000 in one of two companies from a single industry. The only information you have is shown here. The word high refers to the top third of the industry; average is the middle third; low is the bottom third.
Required:
Which company would you select Write a brief explanation for your recommendation.
You have the opportunity to invest $10,000 in one of two companies from a single industry. The only information you have is shown here. The word high refers to the top third of the industry; average is the middle third; low is the bottom third.
Required:
Which company would you select Write a brief explanation for your recommendation.
سؤال
سؤال
سؤال
سؤال
سؤال
سؤال
سؤال
سؤال
سؤال
سؤال
سؤال
سؤال
سؤال
Vertical Analysis of an Income Statement
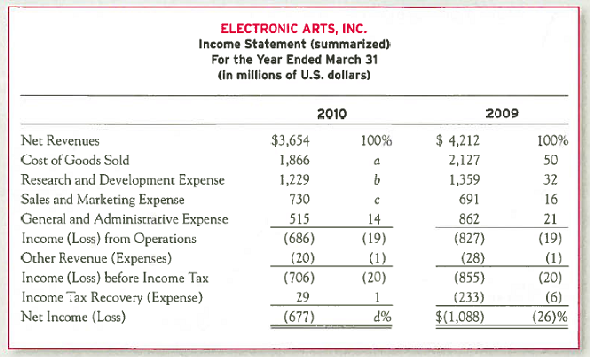
A condensed income statement for Electronic Arts and a partially completed vertical analysis follow.
Required:
1. Complete the vertical analysis by computing each line item ( a )-( d ) as a percentage of net revenues. Round to the nearest whole percentage.
TIP: Research and Development was 32 percent of net revenues in 2009, which was computed as (1,359 ÷ 4,212) × 100.
2. Does Electronic Arts' 2010 Cost of Goods Sold, as a percentage of Net Revenues, represent better or worse performance as compared to 2009
سؤال
Using Ratios to Compare Alternative Investment Opportunities
The 2013 financial statements for Armstrong and Blair companies are summarized here:
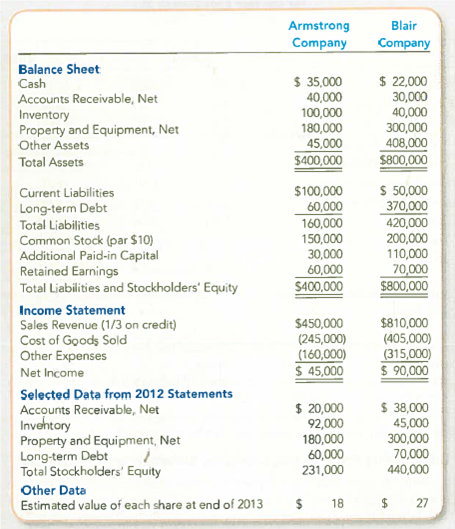
The companies are in the same line of business and are direct competitors in a large metropolitan area. Both have been in business approximately 10 years, and each has had steady growth. One-third of both companies' sales are on credit. Despite these similarities, the management of each has a different viewpoint in many respects. Blair is more conservative, and as its president said, "We avoid what we consider to be undue risk." Both companies use straight-line depreciation, but Blair estimates slightly shorter useful lives than Armstrong. No shares were issued in 2013, and neither company is publicly held. Blair Company has an annual audit by a CPA but Armstrong Company does not. Assume the end-of-year total assets and net property and equipment balances approximate the year's average.
Required:
1. Calculate the ratios in Exhibit 13.5 for which sufficient information is available. Round all calculations to two decimal places.
TIP: To calculate EPS, use the balance in Common Stock to determine the number of shares outstanding. Common Stock equals the par value per share times the number of shares.
2. A venture capitalist is considering buying shares in one of the two companies. Based on the data given, prepare a comparative written evaluation of the ratio analyses (and any other available information) and conclude with your recommended choice.
TIP: Comment on how accounting differences affect your evaluations, if at all.
The 2013 financial statements for Armstrong and Blair companies are summarized here:
The companies are in the same line of business and are direct competitors in a large metropolitan area. Both have been in business approximately 10 years, and each has had steady growth. One-third of both companies' sales are on credit. Despite these similarities, the management of each has a different viewpoint in many respects. Blair is more conservative, and as its president said, "We avoid what we consider to be undue risk." Both companies use straight-line depreciation, but Blair estimates slightly shorter useful lives than Armstrong. No shares were issued in 2013, and neither company is publicly held. Blair Company has an annual audit by a CPA but Armstrong Company does not. Assume the end-of-year total assets and net property and equipment balances approximate the year's average.
Required:
1. Calculate the ratios in Exhibit 13.5 for which sufficient information is available. Round all calculations to two decimal places.
TIP: To calculate EPS, use the balance in Common Stock to determine the number of shares outstanding. Common Stock equals the par value per share times the number of shares.
2. A venture capitalist is considering buying shares in one of the two companies. Based on the data given, prepare a comparative written evaluation of the ratio analyses (and any other available information) and conclude with your recommended choice.
TIP: Comment on how accounting differences affect your evaluations, if at all.
سؤال
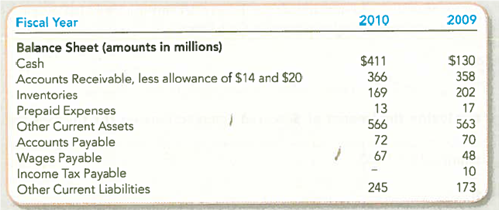
Computing and Interpreting Liquidity Ratios
Cintas Corporation is the largest uniform supplier in North America, providing products and services to approximately 800,000 businesses of all types. Selected information from its 2010 annual report follows. For the 2010 fiscal year, the company reported sales revenue of $2.6 billion and Cost of Goods Sold of $1.5 billion.
Required:
Assuming that all sales are on credit, compute the current ratio (two decimal places), inventory turnover ratio (one decimal place), and accounts receivable turnover ratio (one decimal place) for 2010. Explain what each ratio means for Cintas.
سؤال
سؤال
سؤال
سؤال
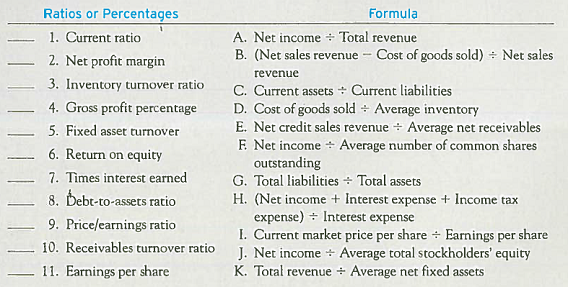
Matching Each Ratio with Its Computational Formula
Match each ratio or percentage with its formula by entering the appropriate letter for each numbered item.
Match each ratio or percentage with its formula by entering the appropriate letter for each numbered item.
سؤال
سؤال
سؤال
سؤال
سؤال
Given the following ratios for four companies, which company is least likely to experience problems paying its current liabilities promptly
A)
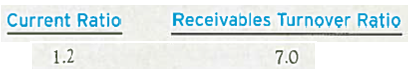
B)
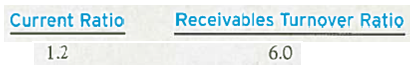
C)
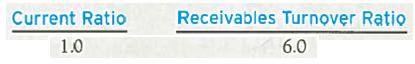
D)
A)
B)
C)
D)
سؤال
سؤال
سؤال
سؤال
سؤال
سؤال
سؤال
سؤال
سؤال
Vertical Analysis of an Income Statement
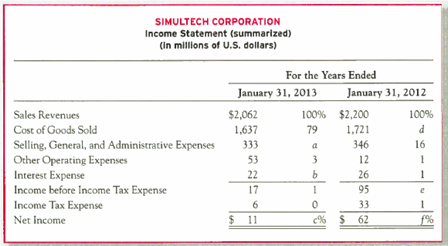
A condensed income statement for Simultech Corporation and a partially completed vertical analysis are presented below.
Required:
1. Complete the vertical analysis by computing each line Item ( a )-( f ) as a percentage of sales revenues. Round to the nearest whole percentage.
2. Does Simultech's Cost of Goods Sold for the year ended January 31, 2013, as a percentage of revenues, represent better or worse performance as compared to that for the year ended January 31, 2012
3. Do the percentages for ( c ) and ( f ) that y6u calculated in 1 indicate whether Simultech's net profit margin has changed over the two years
سؤال
Using Ratios to Compare Loan Requests from Two Companies
The 2013 financial statements for Royale and Cavalier companies are summarized here:
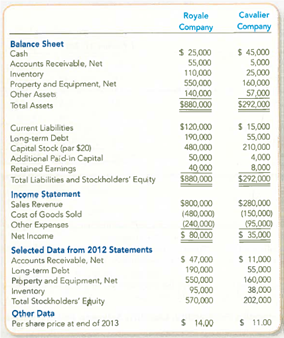
These two companies are in the same business and state but different cities. One-half of Royale s sales and one-quarter of Cavalier's sales are on credit. Each company has been in operation for about 10 years. Both companies received an unqualified audit opinion on the financial statements. Royale Company wants to borrow $75,000 cash, and Cavalier Company is asking for $30,000. The loans will be for a two-year period. Both companies estimate bad debts based on an aging analysis, but Cavalier has estimated slightly higher uncollectible rates than Royale. Neither company issued stock in 2013. Assume the end-of-year total assets and net property and equipment balances approximate, the year's average.
Required:
1. Calculate the ratios in Exhibit 13.5 for which sufficient information is available. Round all calculations to two decimal places.
2. Assume that you work in the loan department of a local bank. You have been asked to analyze the situation and recommend which loan is preferable. Based on the data given, your analysis prepared in requirement 1, and any other information (e.g., accounting policies and decisions), give your choice and the supporting explanation.
The 2013 financial statements for Royale and Cavalier companies are summarized here:
These two companies are in the same business and state but different cities. One-half of Royale s sales and one-quarter of Cavalier's sales are on credit. Each company has been in operation for about 10 years. Both companies received an unqualified audit opinion on the financial statements. Royale Company wants to borrow $75,000 cash, and Cavalier Company is asking for $30,000. The loans will be for a two-year period. Both companies estimate bad debts based on an aging analysis, but Cavalier has estimated slightly higher uncollectible rates than Royale. Neither company issued stock in 2013. Assume the end-of-year total assets and net property and equipment balances approximate, the year's average.
Required:
1. Calculate the ratios in Exhibit 13.5 for which sufficient information is available. Round all calculations to two decimal places.
2. Assume that you work in the loan department of a local bank. You have been asked to analyze the situation and recommend which loan is preferable. Based on the data given, your analysis prepared in requirement 1, and any other information (e.g., accounting policies and decisions), give your choice and the supporting explanation.
سؤال
Computing the Accounts Receivable and Inventory Turnover Ratios
Procter Gamble is a multinational corporation that manufactures and markets many products that you use every day. In 2010, sales for the company were $78,938 (all amounts in millions). The annual report did not report the amount of credit sales, so we will assume that all sales were on credit. The average gross profit percentage was 52.0 percent. Account balances follow:
Required:
1. Rounded to one decimal place, compute the turnover ratios for accounts receivable and inventory.
2. By dividing 365 by your ratios from requirement 1, calculate the average days to collect receivables and the average days to sell inventory.
3. Interpret what these ratios and measures mean for P G.
سؤال
سؤال
سؤال
Vertical Analysis of an Income Statement
A condensed income statement for Southwest Airlines and a partially completed vertical analysts are presented below.
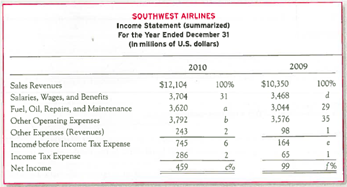
Required:
1. Complete the vertical analysis by computing each line item ( a )-( f ) as a percentage of sales revenues. Round to the nearest whole percentage.
2. Does the percentage that you calculated in 1( a ) suggest that Southwest tried to increase its profit by cutting repairs and maintenance costs in 2010 compared to 2009
3. Refer to the percentages that you calculated in 1( c ) and ( f ). Is Southwest's net profit margin
A condensed income statement for Southwest Airlines and a partially completed vertical analysts are presented below.
Required:
1. Complete the vertical analysis by computing each line item ( a )-( f ) as a percentage of sales revenues. Round to the nearest whole percentage.
2. Does the percentage that you calculated in 1( a ) suggest that Southwest tried to increase its profit by cutting repairs and maintenance costs in 2010 compared to 2009
3. Refer to the percentages that you calculated in 1( c ) and ( f ). Is Southwest's net profit margin
سؤال
Using Ratios to Compare Loan Requests from Two Companies
The 2013 financial statements for Thor and Gunnar Companies are summarized here:
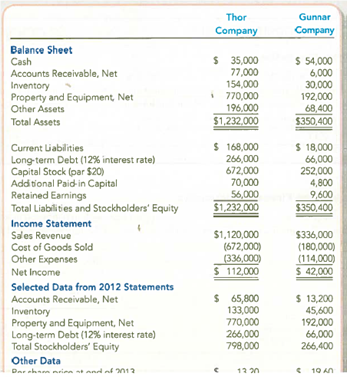
These two companies are in the same business and state but different cities. One-half of Thorns sales and one-quarter of Gunnar's sales are on credit. Each company has been in operation for about 10 years. Both companies received an unqualified audit opinion on the financial statements. Thor Company wants to borrow $105,000, and Gunnar Company is asking for $36,000. The loans will be for a two-year period. Neither company issued stock in 2013. Assume the end-of-year total assets and net property and equipment balances approximate the year's average.
Required:
1. Calculate the ratios in Exhibit 13.5 for which sufficient information is available. Round all calculations to two decimal places.
2. Assume that you work in the loan department of a local bank. You have been asked to analyze the situation and recommend which loan is preferable. Based on the data given, your analysis prepared in requirement 1, and any other information, give your choice and the supporting explanation.
The 2013 financial statements for Thor and Gunnar Companies are summarized here:
These two companies are in the same business and state but different cities. One-half of Thorns sales and one-quarter of Gunnar's sales are on credit. Each company has been in operation for about 10 years. Both companies received an unqualified audit opinion on the financial statements. Thor Company wants to borrow $105,000, and Gunnar Company is asking for $36,000. The loans will be for a two-year period. Neither company issued stock in 2013. Assume the end-of-year total assets and net property and equipment balances approximate the year's average.
Required:
1. Calculate the ratios in Exhibit 13.5 for which sufficient information is available. Round all calculations to two decimal places.
2. Assume that you work in the loan department of a local bank. You have been asked to analyze the situation and recommend which loan is preferable. Based on the data given, your analysis prepared in requirement 1, and any other information, give your choice and the supporting explanation.
سؤال
سؤال
سؤال
سؤال
سؤال
سؤال
سؤال
سؤال
Evaluating Profitability, Liquidity, and Solvency
Looking back over the last few years it is clear that Nicole Mackisey has accomplished a lot running her business Nicole's Getaway Spa (NGS). Nicole is curious about her company's performance as she compares its financial statements.
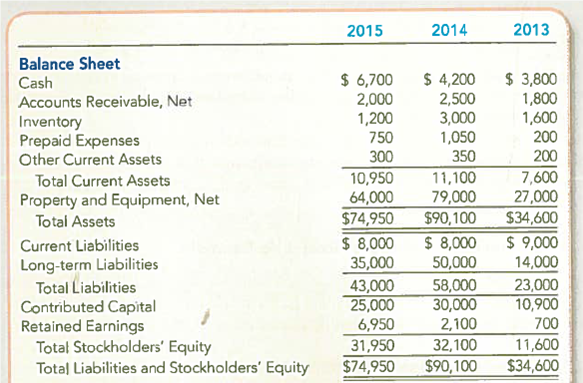
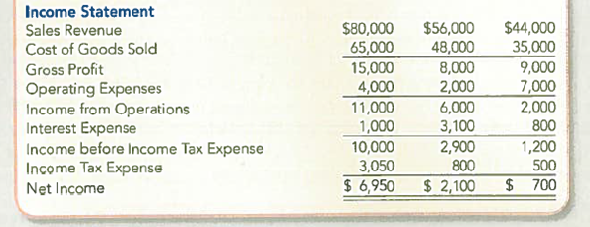
Required:
1. Was NGS more profitable in 2014 or 2015 Use the gross profit percentage, return on equity, and asset turnover ratio to help in making a decision (round each ratio to two decimal places).
2. Was NGS more liquid in 2014 or 2015 Use the current ratio and quick ratio to help in making a decision (round each ratio to two decimal places).
3. Was NGS more solvent in 2014 or 2015 Use the debt-to-assets ratio and times interest earned ratio to help in making a decision (round each ratio to two decimal places).
Looking back over the last few years it is clear that Nicole Mackisey has accomplished a lot running her business Nicole's Getaway Spa (NGS). Nicole is curious about her company's performance as she compares its financial statements.
Required:
1. Was NGS more profitable in 2014 or 2015 Use the gross profit percentage, return on equity, and asset turnover ratio to help in making a decision (round each ratio to two decimal places).
2. Was NGS more liquid in 2014 or 2015 Use the current ratio and quick ratio to help in making a decision (round each ratio to two decimal places).
3. Was NGS more solvent in 2014 or 2015 Use the debt-to-assets ratio and times interest earned ratio to help in making a decision (round each ratio to two decimal places).
سؤال
Evaluating Financial Information
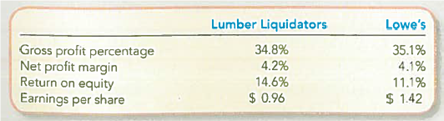
Lumber Liquidators, Inc., competes with Lowe's in product lines such as hardwood flooring, moldings, and noise-reducing underlay. The two companies reported the following financial results in fiscal 2010:
Required:
1. Explain how Lowe's could have a higher gross profit percentage than Lumber Liquidators but a nearly identical net profit margin. What does this suggest about the relative ability of the two companies to control operating expenses
2. Explain how Lumber Liquidators could have a higher return on equity but lower earnings per share. What does this suggest about the companies' relative number of outstanding shares What other explanations could account for this seemingly contradictory pattern

فتح الحزمة
قم بالتسجيل لفتح البطاقات في هذه المجموعة!
Unlock Deck
Unlock Deck
1/84
العب
ملء الشاشة (f)
Deck 13: Measuring and Evaluating Financial Performance
1
Analyzing Comparative Financial Statements Using Horizontal Analyses
The comparative financial statements prepared at December 31, 2013, for Golden Corporation showed the following summarized data:
Required:
1. Complete the two final columns shown beside each item in Golden Corporation's comparative financial statements. Round the percentages to one decimal place.
TIP: Calculate the Increase (decrease) by subtracting 2012 from 2013. Calculate the percentage by dividing the amount of increase (decrease) by the 2012 balance.
2. Use the horizontal (trend) analyses to identify (a) a large percentage change in one account that is accompanied by a small dollar change, and (b) a directional change in one account balance that is inconsistent with the direction of change in a related account balance.
1.
Horizontal analysis:
Horizontal analysis is a comparison between two years financial statements. This is done by taking one year as base year. All the items in a year will be compared with same item of the base year, and result will be shown in percentage. Financial statement users can easily understand performance of the company by using this horizontal analysis.
Prepare horizontal analysis income statement for the year ended December 31:
Calculations required doing horizontal analysis for both the year will be as follows:
 Working Note:
Take 2012 as base year and calculate the percentages. Below shown how to calculate percentage.
Sales revenue percentage:
 Sales revenue percentage is 9.1%.
Therefore, calculate all percentages like that.
2.
(a)
The total percent change taken place in Cash is high but it is due to small dollar balance. The total percent change in Retained Earnings is also big; it is also due to small dollar balance.
(b)
One unusual change is that although sales increased by 9.1%, accounts receivable decreased by 17.4%. Typically, an increase in sales would be accompanied by an increase in accounts receivable.
Horizontal analysis:
Horizontal analysis is a comparison between two years financial statements. This is done by taking one year as base year. All the items in a year will be compared with same item of the base year, and result will be shown in percentage. Financial statement users can easily understand performance of the company by using this horizontal analysis.
Prepare horizontal analysis income statement for the year ended December 31:
Calculations required doing horizontal analysis for both the year will be as follows:
Working Note: Take 2012 as base year and calculate the percentages. Below shown how to calculate percentage.
Sales revenue percentage:
Sales revenue percentage is 9.1%.Therefore, calculate all percentages like that.
2.
(a)
The total percent change taken place in Cash is high but it is due to small dollar balance. The total percent change in Retained Earnings is also big; it is also due to small dollar balance.
(b)
One unusual change is that although sales increased by 9.1%, accounts receivable decreased by 17.4%. Typically, an increase in sales would be accompanied by an increase in accounts receivable.
2
Vertical Analysis of a Balance Sheet
Electronic Arts is a video game company that competes with Activision. A condensed balance sheet for Electronic Arts and a partially completed vertical analysis are presented below.
Required:
1. Complete the vertical analysis by computing each line item ( a )-( e ) as a percentage of total assets. Round to the nearest whole percentage.
TIP: Inventories were 2 percent of total assets, computed as ($100 ÷ $4,646) × 100.
2. What percentages of Electronic Arts' assets relate to intangibles versus property and equipment What business reasons would explain this relative emphasis
1.
Prepare vertical analysis of balance sheet:
 Calculate percentage of missing assets and liabilities percentages. Working note is below.
Calculate Other current assets percentage:
 Calculate Intangibles percentage:
 Calculate property and equipment percentage:
 Calculate Accrued liabilities percentage:
 Calculate Total liability percentage:
 2.
2.
Calculate total intangible assets percent in response to property and equipment:
Substitute $1,297 for Total intangible assets and $537 for Total plant and equipment.
 Therefore, Percent intangible assets is 241.52%
Prepare vertical analysis of balance sheet:
Calculate percentage of missing assets and liabilities percentages. Working note is below.Calculate Other current assets percentage:
Calculate Intangibles percentage: Calculate property and equipment percentage: Calculate Accrued liabilities percentage: Calculate Total liability percentage: 2. Calculate total intangible assets percent in response to property and equipment:
Substitute $1,297 for Total intangible assets and $537 for Total plant and equipment.
Therefore, Percent intangible assets is 241.52% 3
Interpreting Profitability, Liquidity, Solvency, and P/E Ratios
Kohl's Corporation is a national retail department store. The company's total revenues for the year ended January 29, 2010, were $18 billion. J.C. Penney is a similar size department store company with $18 billion of revenues. The following ratios for the two companies were obtained for that fiscal year from reuters.com/finance:
Required:
1. Which company appears more profitable Describe the ratio(s) that you used to reach this decision.
2. Which company appears more liquid Describe the ratio(s) that you used to reach this decision.
3. Which company appears more solvent Describe the ratio(s) that you used to reach this decision.
4. Are the conclusions from your analyses in requirements 1-3 consistent with the value of the two companies, as suggested by their P/E ratios If not, offer one explanation for any apparent inconsistency.
TIP: Remember that the stock price in the top of the P/E ratio represents investors' expectations about future financial performance whereas the bottom number reports past financial performance.
1.
Explanation:
• Although J. C. has a higher gross profit percentage, K's Corporation is more profitable on net profit margin and return on equity. Thus, it appears on an overall basis that K's is more profitable.
• Earnings per share is excluded from between-company comparisons because it could be affected by differences in stock structure that do not reflect differences in profitability.
2.
Explanation:
K's and J appear to be similarly liquid. The ratios considered are (1) inventory turnover ratio, and (2) current ratio. K's turns over its inventory more frequently than J. C. Penney, and J. C. Penney's current ratio exceeds K's. Therefore, it suggests that both K's and J are able to generate cash to be used in paying current liabilities.
3.
Explanation:
Only the debt-to-assets ratio is available to evaluate solvency. Based on this ratio alone, K's appears more solvent, with debt providing financing for 96% of its assets (as compared to 98% for J). However, both of these ratios are extremely high and both companies are significantly leveraged.
4.
Explanation:
• J has a larger P/E ratio (23.3) than K's (14.2), suggesting that investors believe that J will outperform K's in the future. This is inconsistent with the conclusions above regarding profitability, liquidity, and solvency.
• One explanation for this inconsistency is that J. C. Penny may have realized an extraordinary or unusual item during fiscal 2010 that is not representative of usual operations.
Explanation:
• Although J. C. has a higher gross profit percentage, K's Corporation is more profitable on net profit margin and return on equity. Thus, it appears on an overall basis that K's is more profitable.
• Earnings per share is excluded from between-company comparisons because it could be affected by differences in stock structure that do not reflect differences in profitability.
2.
Explanation:
K's and J appear to be similarly liquid. The ratios considered are (1) inventory turnover ratio, and (2) current ratio. K's turns over its inventory more frequently than J. C. Penney, and J. C. Penney's current ratio exceeds K's. Therefore, it suggests that both K's and J are able to generate cash to be used in paying current liabilities.
3.
Explanation:
Only the debt-to-assets ratio is available to evaluate solvency. Based on this ratio alone, K's appears more solvent, with debt providing financing for 96% of its assets (as compared to 98% for J). However, both of these ratios are extremely high and both companies are significantly leveraged.
4.
Explanation:
• J has a larger P/E ratio (23.3) than K's (14.2), suggesting that investors believe that J will outperform K's in the future. This is inconsistent with the conclusions above regarding profitability, liquidity, and solvency.
• One explanation for this inconsistency is that J. C. Penny may have realized an extraordinary or unusual item during fiscal 2010 that is not representative of usual operations.
4
Analyzing an Investment by Comparing Selected Ratios
You have the opportunity to invest $10,000 in one of two companies from a single industry. The only information you have follows. The word high refers to the top third of the industry; average is the middle third; low is the bottom third.
Required:
Which company would you select Write a brief explanation for your recommendation.
TIP: When interpreting ratios, think about how they are related to one another. For example, the current ratio and the inventory turnover ratio both include the Inventory balance. This means that the low inventory turnover ratio can help you to interpret the high current ratio.
فتح الحزمة
افتح القفل للوصول البطاقات البالغ عددها 84 في هذه المجموعة.
فتح الحزمة
k this deck
5
Inferring Financial Information from Profitability and Liquidity Ratios
Dollar General Corporation operates approximately 9,400 general merchandise stores that feature quality merchandise at low prices to meet the needs of middle-, low-, and fixed-income families in southern, eastern, and midwestern states. For the year ended January 28, 2011, the company reported average inventories of $1,643 (in millions) and an inventory turnover of 5.39. Average total fixed assets were $1,427 (million), and the fixed asset turnover ratio was 9.13.
Required:
1. Calculate Dollar General's gross profit percentage (expressed as a percentage with one decimal place). What does this imply about the amount of gross profit made from each dollar of sales
TIP: Work backward from the fixed asset turnover and inventory turnover ratios to compute the amounts needed for the gross profit percentage.
2. Is this an improvement from the gross profit percentage of 31.3 percent earned during the previous year
فتح الحزمة
افتح القفل للوصول البطاقات البالغ عددها 84 في هذه المجموعة.
فتح الحزمة
k this deck
6
Analyzing the Impact of Alternative Inventory Methods on Selected Ratios
Company A uses the FIFO method to cost inventory, and Company B uses the LIFO method. The two companies are exactly alike except for the difference in inventory costing methods. Costs of inventory items for both companies have been falling steadily in recent years, and each company has increased its inventory each year. Ignore income tax effects.
Required:
Identify which company will report the higher amount for each of the following ratios. If it is not possible to identify which will report the higher amount, explain why.
1. Current ratio.
2. Debt-to-assets ratio.
3. Earnings per share.
فتح الحزمة
افتح القفل للوصول البطاقات البالغ عددها 84 في هذه المجموعة.
فتح الحزمة
k this deck
7
Preparing and Interpreting a Schedule for Horizontal and Vertical Analyses
The average price of a gallon of gas in 2010 jumped $0.43 (18 percent) from $2.36 in 2009 (to $2.79 in 2010). Let's see whether these changes are reflected in the income statement of Chevron Corporation for the year ended December 31, 2010 (amounts in billions).
Required:
1. Conduct a horizontal analysis by calculating the year-over-year changes in each line item, expressed in dollars and in percentages (rounded to one decimal place). How did the change in gas prices compare to the changes in Chevron's total revenues and costs of crude oil and products
2. Conduct a vertical analysis by expressing each line as a percentage of total revenues (round to one decimal place). Excluding income tax and other operating costs, did Chevron earn more profit per dollar of revenue in 2010 compared to 2009
فتح الحزمة
افتح القفل للوصول البطاقات البالغ عددها 84 في هذه المجموعة.
فتح الحزمة
k this deck
8
Preparing and Interpreting a Schedule for Horizontal and Vertical Analyses
According to the producer price index database maintained by the Bureau of Labor Statistics, the average cost of computer equipment fell 4.8 percent between 2009 and 2010. Let's see whether these changes are reflected in the income statement of Computer Tycoon Inc. for the year ended December 31, 2010.
Required:
1. Conduct a horizontal analysis by calculating the year-over-year changes in each line item, expressed in dollars and in percentages (rounded to one decimal place). How did the change in computer prices compare to the changes in Computer Tycoon's sales revenues
2. Conduct a vertical analysis by expressing each line as a percentage of total revenues (round to one decimal place). Excluding income tax, interest, and operating expenses, did Computer Tycoon earn more profit per dollar of sales in 2010 compared to 2009
فتح الحزمة
افتح القفل للوصول البطاقات البالغ عددها 84 في هذه المجموعة.
فتح الحزمة
k this deck
9
Computing a Commonly Used Solvency Ratio
Use the information in E13-3 to complete the following requirement.
Required:
Compute the times interest earned ratios for 2010 and 2009. In your opinion, does Computer Tycoon generate sufficient net income (before taxes and interest) to cover the cost of debt financing
Use the information in E13-3 to complete the following requirement.
Required:
Compute the times interest earned ratios for 2010 and 2009. In your opinion, does Computer Tycoon generate sufficient net income (before taxes and interest) to cover the cost of debt financing
فتح الحزمة
افتح القفل للوصول البطاقات البالغ عددها 84 في هذه المجموعة.
فتح الحزمة
k this deck
10
Computing and Interpreting Selected Liquidity Ratios
Double West Suppliers (DWS) reported sales for the year of $300,000, all on credit. The average gross profit percentage was 40 percent on sales. Account balances follow:
Required:
1. Compute the turnover ratios for accounts receivable and inventory (round to one decimal place).
2. By dividing 365 by your ratios from requirement 1, calculate the average days to collect receivables and the average days to sell inventory (round to one decimal place).
3. Explain what each of these ratios and measures mean for DWS.
فتح الحزمة
افتح القفل للوصول البطاقات البالغ عددها 84 في هذه المجموعة.
فتح الحزمة
k this deck
11
(Supplement 13A) Which of the following items is reported net of related income taxes
A) Gain or loss from discontinued operations.
B) Gain or loss from disposal of property, plant, and equipment.
C) Interest on long-term debt.
D) Gain or loss from early extinguishment of debt.
A) Gain or loss from discontinued operations.
B) Gain or loss from disposal of property, plant, and equipment.
C) Interest on long-term debt.
D) Gain or loss from early extinguishment of debt.
فتح الحزمة
افتح القفل للوصول البطاقات البالغ عددها 84 في هذه المجموعة.
فتح الحزمة
k this deck
12
Techgear is an electronics company in the United States. It uses the LIFO inventory method. You plan to compare its ratios to Eurotext, but you are concerned because Eurotext uses IFRS. What accounting policy difference is certain to exist between the two-companies Of the ratios in Exhibit 13.5, name five that will be affected by this difference.
فتح الحزمة
افتح القفل للوصول البطاقات البالغ عددها 84 في هذه المجموعة.
فتح الحزمة
k this deck
13
Which of the following ratios is not used to analyze profitability
A) Net profit margin ratio.
B) Gross profit percentage.
C) Current ratio.
D) Return on equity.
A) Net profit margin ratio.
B) Gross profit percentage.
C) Current ratio.
D) Return on equity.
فتح الحزمة
افتح القفل للوصول البطاقات البالغ عددها 84 في هذه المجموعة.
فتح الحزمة
k this deck
14
Which of the following ratios is used to analyze liquidity
A) Earnings per share.
B) Debt-to-assets.
C) Current ratio.
D) Both b and c.
A) Earnings per share.
B) Debt-to-assets.
C) Current ratio.
D) Both b and c.
فتح الحزمة
افتح القفل للوصول البطاقات البالغ عددها 84 في هذه المجموعة.
فتح الحزمة
k this deck
15
Which of the following ratios incorporates stock market data
A) Inventory turnover.
B) Earnings per share.
C) Price/earnings ratio.
D) All of the above.
A) Inventory turnover.
B) Earnings per share.
C) Price/earnings ratio.
D) All of the above.
فتح الحزمة
افتح القفل للوصول البطاقات البالغ عددها 84 في هذه المجموعة.
فتح الحزمة
k this deck
16
A decrease in Selling and Administrative Expenses would directly impact what ratio
A) Fixed asset turnover ratio.
B) Times interest earned.
C) Current ratio.
D) Gross profit percentage.
A) Fixed asset turnover ratio.
B) Times interest earned.
C) Current ratio.
D) Gross profit percentage.
فتح الحزمة
افتح القفل للوصول البطاقات البالغ عددها 84 في هذه المجموعة.
فتح الحزمة
k this deck
17
Inferring Financial Information Using the P/E Ratio
In 2012, Big W Company reported earnings per share of $2.50 when its stock was selling for $50.00. If its 2013 earnings increase by 10 percent end the P/E ratio remains constant, what will be the price of its stock Explain.
In 2012, Big W Company reported earnings per share of $2.50 when its stock was selling for $50.00. If its 2013 earnings increase by 10 percent end the P/E ratio remains constant, what will be the price of its stock Explain.
فتح الحزمة
افتح القفل للوصول البطاقات البالغ عددها 84 في هذه المجموعة.
فتح الحزمة
k this deck
18
(Supplement 13A) Name the most commonly reported nonrecurring item, and explain where and how it is reported on the income statement.
فتح الحزمة
افتح القفل للوصول البطاقات البالغ عددها 84 في هذه المجموعة.
فتح الحزمة
k this deck
19
Calculations for Horizontal Analyses
Using the following income statements, perform the calculations needed for horizontal analyses. Round percentages to one decimal place.
Using the following income statements, perform the calculations needed for horizontal analyses. Round percentages to one decimal place.
فتح الحزمة
افتح القفل للوصول البطاقات البالغ عددها 84 في هذه المجموعة.
فتح الحزمة
k this deck
20
Interpreting Horizontal Analyses
Refer to the calculations from M13-1. What are the two most significant year-over-year changes in terms of dollars and in terms of percentages Give one potential cause of each of these changes.
Refer to the calculations from M13-1. What are the two most significant year-over-year changes in terms of dollars and in terms of percentages Give one potential cause of each of these changes.
فتح الحزمة
افتح القفل للوصول البطاقات البالغ عددها 84 في هذه المجموعة.
فتح الحزمة
k this deck
21
Inferring Financial Information Using Gross Profit Percentage
Your campus computer store reported Sales Revenue of $168,000. The company's gross profit percentage was 60.0 percent. What amount of Cost of Goods Sold did the company report
Your campus computer store reported Sales Revenue of $168,000. The company's gross profit percentage was 60.0 percent. What amount of Cost of Goods Sold did the company report
فتح الحزمة
افتح القفل للوصول البطاقات البالغ عددها 84 في هذه المجموعة.
فتح الحزمة
k this deck
22
Computing the Return on Equity Ratio
Given the following data, compute the 2013 return on equity ratio (expressed as a percentage with one decimal place).
Given the following data, compute the 2013 return on equity ratio (expressed as a percentage with one decimal place).
فتح الحزمة
افتح القفل للوصول البطاقات البالغ عددها 84 في هذه المجموعة.
فتح الحزمة
k this deck
23
Explain whether the following situations, taken independently, would be favorable or unfavorable: ( a ) increase in gross profit percentage, ( b ) decrease in inventory turnover ratio, ( c ) increase in earnings per share, ( d ) decrease in days to collect, ( e ) increase in net profit margin, and ( f ) decrease in quick ratio.
فتح الحزمة
افتح القفل للوصول البطاقات البالغ عددها 84 في هذه المجموعة.
فتح الحزمة
k this deck
24
Analyzing Financial Statements Using Horizontal Analyses
The comparative financial statements prepared at December 31, 2013, for Pinnacle Plus showed the following summarized data:
Required:
1. Complete the two final columns shown beside each item in Pinnacle Plus's comparative financial statements. Round the percentages to one decimal place.
2. Which account increased by the largest dollar amount Which account increased by the largest percentage
The comparative financial statements prepared at December 31, 2013, for Pinnacle Plus showed the following summarized data:
Required:
1. Complete the two final columns shown beside each item in Pinnacle Plus's comparative financial statements. Round the percentages to one decimal place.
2. Which account increased by the largest dollar amount Which account increased by the largest percentage
فتح الحزمة
افتح القفل للوصول البطاقات البالغ عددها 84 في هذه المجموعة.
فتح الحزمة
k this deck
25
Verbal Analysis of a Balance Sheet
A condensed balance sheet for Simultech Corporation and a partially completed vertical analysis are presented below.
Required:
1. Complete the vertical analysis by computing each line item ( a )-( d ) as a percentage of total assets. Round to the nearest whole percentage.
2. What percentages of Simultech's assets relate to inventories versus property and equipment What does this tell you about the relative significance of these two assets to Simultech's business
3. What percentage of Simultech's assets is financed by total stockholder's equity By total liabilities
A condensed balance sheet for Simultech Corporation and a partially completed vertical analysis are presented below.
Required:
1. Complete the vertical analysis by computing each line item ( a )-( d ) as a percentage of total assets. Round to the nearest whole percentage.
2. What percentages of Simultech's assets relate to inventories versus property and equipment What does this tell you about the relative significance of these two assets to Simultech's business
3. What percentage of Simultech's assets is financed by total stockholder's equity By total liabilities
فتح الحزمة
افتح القفل للوصول البطاقات البالغ عددها 84 في هذه المجموعة.
فتح الحزمة
k this deck
26
Interpreting Profitability, Liquidity, Solvency, and P/E Ratios
Coke and Pepsi are well-known international brands. Coca-Cola sells more than $35 billion worth of beverages each year while annual sales of Pepsi products exceed $43 billion. Compare the two companies as a potential investment based on the following ratios:
Required:
1. Which company appears more profitable Describe the ratio(s) that you used to reach this decision.
2. Which company appears more liquid Describe the ratio(s) that you used to reach this
3. Which company appears more solvent Describe the ratio(s) that you used to reach this decision.
4. Are the conclusions from your analyses in requirements 1-3 consistent with the value of the two companies, as suggested by their P/E ratios If not, offer one explanation for any apparent inconsistency.
فتح الحزمة
افتح القفل للوصول البطاقات البالغ عددها 84 في هذه المجموعة.
فتح الحزمة
k this deck
27
Analyzing an Investment by Comparing Selected Ratios
You have the opportunity to invest $10,000 in one of two companies from a single industry. The only information you have is shown here. The word high refers to the top third of the industry; average is the middle third; low is the bottom third.
Required:
Which company would you select Write a brief explanation for your recommendation.
فتح الحزمة
افتح القفل للوصول البطاقات البالغ عددها 84 في هذه المجموعة.
فتح الحزمة
k this deck
28
Analyzing the Impact of Selected Transactions on the Current Ratio
In its most recent annual report, Appalachian Beverages reported current assets of $54,000 and a current ratio of 1.80. Assume that the following transactions were completed: (1) purchased merchandise for $6,000 on account, and (2) purchased a delivery truck for $10,000, paying $1,000 cash and signing a two-year promissory note for the balance.
Required:
Compute the updated current ratio, rounded to two decimal places, after each transaction.
فتح الحزمة
افتح القفل للوصول البطاقات البالغ عددها 84 في هذه المجموعة.
فتح الحزمة
k this deck
29
Analyzing Financial Statements Using Horizontal and Ratio Analyses
The comparative financial statements prepared at December 31, 2013, for Tiger Audio showed the following summarized data:
Required:
1. Complete the two final columns shown beside each item in Tiger Audio's comparative financial statements. Round the percentages to one decimal place.
2. Which account increased by the largest dollar amount! Which account increased by the largest percentage
The comparative financial statements prepared at December 31, 2013, for Tiger Audio showed the following summarized data:
Required:
1. Complete the two final columns shown beside each item in Tiger Audio's comparative financial statements. Round the percentages to one decimal place.
2. Which account increased by the largest dollar amount! Which account increased by the largest percentage
فتح الحزمة
افتح القفل للوصول البطاقات البالغ عددها 84 في هذه المجموعة.
فتح الحزمة
k this deck
30
Vertical Analysis of a Balance Sheet
A condensed balance sheet for Southwest Airlines and a partially completed vertical analysis are presented below.
Required:
1. Complete the vertical analysis by computing each line item ( a )-( c ) as a percentage of total assets. Round to the nearest whole percentage.
2. What percentages of Southwest's assets relate to inventory of parts and supplies versus property and equipment What does this tell you about the relative significance of these two assets to Southwest's business
3. What percentage of Southwest s assets is financed by total stockholders' equity By total liabilities
فتح الحزمة
افتح القفل للوصول البطاقات البالغ عددها 84 في هذه المجموعة.
فتح الحزمة
k this deck
31
Interpreting Profitability, Liquidity, Solvency, and P/E Ratios
Mattel and Hasbro are the two biggest makers of games and toys in the world. Martel sells nearly $6 billion of products each year while annual sales of Hasbro products exceed $4 billion. Compare the two companies as a potential investment based on the following ratios:
Required:
1. Which company appears more profitable Describe the ratio(s) that you used to reach this decision.
2. Which company appears more liquid Describe the ratio(s) that you used to reach this decision.
3. Which company appears more solvent Describe the ratio(s) that you used to reach this decision.
4. Are the conclusions from your analyses in requirements 1-3 consistent with the value of the two companies, as suggested by their P/E ratios If not, offer one explanation for any apparent inconsistency.
فتح الحزمة
افتح القفل للوصول البطاقات البالغ عددها 84 في هذه المجموعة.
فتح الحزمة
k this deck
32
Analyzing an Investment by Comparing Selected Ratios
You have the opportunity to invest $10,000 in one of two companies from a single industry. The only information you have is shown here. The word high refers to the top third of the industry; average is the middle third; low is the bottom third.
Required:
Which company would you select Write a brief explanation for your recommendation.
You have the opportunity to invest $10,000 in one of two companies from a single industry. The only information you have is shown here. The word high refers to the top third of the industry; average is the middle third; low is the bottom third.
Required:
Which company would you select Write a brief explanation for your recommendation.
فتح الحزمة
افتح القفل للوصول البطاقات البالغ عددها 84 في هذه المجموعة.
فتح الحزمة
k this deck
33
Identifying Relevant Ratios
Identify the ratio that is relevant to answering each of the following questions.
a. How much net income does the company earn from each dollar of sales
b. Is the company financed primarily by debt or equity
c. How many dollars of sales were generated for each dollar invested in fixed assets
d. How many days, on average, does it take the company to collect on credit sales made to customers
e. How much net income does the company earn for each dollar owners have invested in it
f. Does the company have sufficient assets to convert into cash for paying liabilities as they come due in the upcoming year
فتح الحزمة
افتح القفل للوصول البطاقات البالغ عددها 84 في هذه المجموعة.
فتح الحزمة
k this deck
34
What is the general goal of trend analysis
فتح الحزمة
افتح القفل للوصول البطاقات البالغ عددها 84 في هذه المجموعة.
فتح الحزمة
k this deck
35
What is ratio analysis Why is it useful
فتح الحزمة
افتح القفل للوصول البطاقات البالغ عددها 84 في هذه المجموعة.
فتح الحزمة
k this deck
36
Into what three categories of performance are most financial ratios reported To what in particular do each of these categories relate
فتح الحزمة
افتح القفل للوصول البطاقات البالغ عددها 84 في هذه المجموعة.
فتح الحزمة
k this deck
37
Slow Cellar's current ratio increased from 1.2 to 1.5. What is one favorable interpretation of this change What is one unfavorable interpretation of this change
فتح الحزمة
افتح القفل للوصول البطاقات البالغ عددها 84 في هذه المجموعة.
فتح الحزمة
k this deck
38
What are the two essential characteristics of useful financial information What other characteristics enhance the usefulness of financial information
فتح الحزمة
افتح القفل للوصول البطاقات البالغ عددها 84 في هذه المجموعة.
فتح الحزمة
k this deck
39
Computing Ratios
Compute the following ratios for The Home Depot's year ended January 30, 2011: fixed asset turnover, days to sell, and debt-to-assets. To calculate the ratios, use the financial statements of The Home Depot in Appendix A at the end of this book, or download them from the Cases section of the text's Web site at www.mhhe.com/phillips4e.
a. 2.69; 85; 0.53
b. 2.71; 85; 0.53
c. 2.69; 85; 1.12
d. 2.69; 87; 1.12
فتح الحزمة
افتح القفل للوصول البطاقات البالغ عددها 84 في هذه المجموعة.
فتح الحزمة
k this deck
40
Internet-Based Team Research: Examining an Annual Report
As a team, select an industry to analyze. Using your Web browser, each team member should access the annual report or 10-K for one publicly traded company in the industry, with each member selecting a different company. (See S1-3 in Chapter 1 for a description of possible resources for these tasks.)
Required:
1. On an individual basis, each team member should write a short report that incorporates horizontal and vertical analyses and as many of the ratios from the chapter as are applicable given the nature of the selected company.
2. Then, as a team, write a short report comparing and contrasting your companies using these attributes. Discuss any patterns across the companies that you as a team observe. Provide potential explanations for any differences discovered. Consider the impact of differences in accounting policies.
فتح الحزمة
افتح القفل للوصول البطاقات البالغ عددها 84 في هذه المجموعة.
فتح الحزمة
k this deck
41
Ethical Decision Making: A Mini-Case
Capital Investments Corporation (CIC) requested a sizable loan from First Federal Bank to acquire a large piece of land for future expansion. CIC reported current assets of $1,900,000 (including $430,000 in cash) and current liabilities of $1,075,000. First Federal denied the loan request for a number of reasons, including the fact that the current ratio was below 2:1. When CIC was informed of the loan denial, the controller of the company immediately paid $420,000 that was owed to several trade creditors. The controller then asked First Federal to reconsider the loan application. Based on these abbreviated facts, would you recommend that First Federal approve the loan request Why Are the controller's actions ethical
Capital Investments Corporation (CIC) requested a sizable loan from First Federal Bank to acquire a large piece of land for future expansion. CIC reported current assets of $1,900,000 (including $430,000 in cash) and current liabilities of $1,075,000. First Federal denied the loan request for a number of reasons, including the fact that the current ratio was below 2:1. When CIC was informed of the loan denial, the controller of the company immediately paid $420,000 that was owed to several trade creditors. The controller then asked First Federal to reconsider the loan application. Based on these abbreviated facts, would you recommend that First Federal approve the loan request Why Are the controller's actions ethical
فتح الحزمة
افتح القفل للوصول البطاقات البالغ عددها 84 في هذه المجموعة.
فتح الحزمة
k this deck
42
Using a Spreadsheet to Calculate Financial Statement Ratios
Enter the account names and dollar amounts from the comparative balance sheets in Exhibit 13.1 into a worksheet in a spreadsheet file. Create a second copy of the worksheet in the same spreadsheet file.
Required:
1. To the right of the comparative numbers in the first worksheet, enter the necessary formulas to compute the amount and percent change as shown in Exhibit 13.1.
2. To the right of each column in the second worksheet, enter the necessary formulas to create common size statements similar to those shown in Exhibit 13.3.
فتح الحزمة
افتح القفل للوصول البطاقات البالغ عددها 84 في هذه المجموعة.
فتح الحزمة
k this deck
43
Analyzing the Impact of Selected Transactions on the Current Ratio
In its most recent annual report, Sunrise Enterprises reported current assets of $1,090,000 and current liabilities of $602,000.
Required:
Determine for each of the following transactions whether the current ratio, and each of its two components, for Sunrise will increase, decrease, or have no change: (1) sold long-term assets for cash, (2) accrued severance pay for terminated employees, (3) wrote down the carrying value of certain inventory items that were deemed to be obsolete, and (4) acquired new inventory by signing an 18-month promissory note (the supplier was not willing to provide normal credit terms).
فتح الحزمة
افتح القفل للوصول البطاقات البالغ عددها 84 في هذه المجموعة.
فتح الحزمة
k this deck
44
Analyzing Comparative Financial Statements Using Selected Ratios
Use the data given in CP13-1 for Golden Corporation.
Required:
1. Compute the gross profit percentage for 2013 and 2012. Round the percentages to one decimal place. Is the trend going in the right direction
2. Compute the net profit margin for 2013 and 2012. Round the percentages to one decimal place. Is the trend going in the right direction
3. Compute the earnings per share for 2013 and 2012. Does the trend look good or bad Explain.
TIP: To calculate EPS, use the balance in Common Stock to determine the number of shares outstanding. Common Stock equals the par value per share times the number of shares.
4. Stockholders' equity totaled $30,000 at the end of 2011. Compute the return on equity (ROE) ratios for 2012 and 2013. Express the ROE as percentages rounded to one decimal place. Is the trend going in the right direction
5. Net property and equipment totaled $35,000 at the end of 2011. Compute the fixed asset turnover ratios for 2013 and 2012. Round the ratios to two decimal places. Is the trend going in the right direction
6. Compute the debt-to-assets ratios for 2013 and 2012. Round the ratios to two decimal places. Is debt providing financing for a larger or smaller proportion of the company's asset growth Explain.
7. Compute the times interest earned ratios for 2013 and 2012. Round the ratios to one decimal place. Do they look good or bad Explain.
8. After Golden released its 2013 financial statements, the company's stock was trading at $30. After the release of its 2012 financial statements, the company's stock price was $21 per share. Compute the P/E ratios for both years, rounded to one decimal place. Does it appear that investors have become more (or less) optimistic about Golden's future success
فتح الحزمة
افتح القفل للوصول البطاقات البالغ عددها 84 في هذه المجموعة.
فتح الحزمة
k this deck
45
Vertical Analysis of an Income Statement
A condensed income statement for Electronic Arts and a partially completed vertical analysis follow.
Required:
1. Complete the vertical analysis by computing each line item ( a )-( d ) as a percentage of net revenues. Round to the nearest whole percentage.
TIP: Research and Development was 32 percent of net revenues in 2009, which was computed as (1,359 ÷ 4,212) × 100.
2. Does Electronic Arts' 2010 Cost of Goods Sold, as a percentage of Net Revenues, represent better or worse performance as compared to 2009
فتح الحزمة
افتح القفل للوصول البطاقات البالغ عددها 84 في هذه المجموعة.
فتح الحزمة
k this deck
46
Using Ratios to Compare Alternative Investment Opportunities
The 2013 financial statements for Armstrong and Blair companies are summarized here:
The companies are in the same line of business and are direct competitors in a large metropolitan area. Both have been in business approximately 10 years, and each has had steady growth. One-third of both companies' sales are on credit. Despite these similarities, the management of each has a different viewpoint in many respects. Blair is more conservative, and as its president said, "We avoid what we consider to be undue risk." Both companies use straight-line depreciation, but Blair estimates slightly shorter useful lives than Armstrong. No shares were issued in 2013, and neither company is publicly held. Blair Company has an annual audit by a CPA but Armstrong Company does not. Assume the end-of-year total assets and net property and equipment balances approximate the year's average.
Required:
1. Calculate the ratios in Exhibit 13.5 for which sufficient information is available. Round all calculations to two decimal places.
TIP: To calculate EPS, use the balance in Common Stock to determine the number of shares outstanding. Common Stock equals the par value per share times the number of shares.
2. A venture capitalist is considering buying shares in one of the two companies. Based on the data given, prepare a comparative written evaluation of the ratio analyses (and any other available information) and conclude with your recommended choice.
TIP: Comment on how accounting differences affect your evaluations, if at all.
فتح الحزمة
افتح القفل للوصول البطاقات البالغ عددها 84 في هذه المجموعة.
فتح الحزمة
k this deck
47
Computing and Interpreting Liquidity Ratios
Cintas Corporation is the largest uniform supplier in North America, providing products and services to approximately 800,000 businesses of all types. Selected information from its 2010 annual report follows. For the 2010 fiscal year, the company reported sales revenue of $2.6 billion and Cost of Goods Sold of $1.5 billion.
Required:
Assuming that all sales are on credit, compute the current ratio (two decimal places), inventory turnover ratio (one decimal place), and accounts receivable turnover ratio (one decimal place) for 2010. Explain what each ratio means for Cintas.
Cintas Corporation is the largest uniform supplier in North America, providing products and services to approximately 800,000 businesses of all types. Selected information from its 2010 annual report follows. For the 2010 fiscal year, the company reported sales revenue of $2.6 billion and Cost of Goods Sold of $1.5 billion.
Required:
Assuming that all sales are on credit, compute the current ratio (two decimal places), inventory turnover ratio (one decimal place), and accounts receivable turnover ratio (one decimal place) for 2010. Explain what each ratio means for Cintas.
فتح الحزمة
افتح القفل للوصول البطاقات البالغ عددها 84 في هذه المجموعة.
فتح الحزمة
k this deck
48
Interpreting Ratios
Generally speaking, do the following indicate good news, or bad news
a. Increase in times interest earned ratio.
b. Decrease in days to sell.
c. Increase in gross profit percentage.
d. Decrease in EPS.
e. Increase in asset turnover ratio.
Generally speaking, do the following indicate good news, or bad news
a. Increase in times interest earned ratio.
b. Decrease in days to sell.
c. Increase in gross profit percentage.
d. Decrease in EPS.
e. Increase in asset turnover ratio.
فتح الحزمة
افتح القفل للوصول البطاقات البالغ عددها 84 في هذه المجموعة.
فتح الحزمة
k this deck
49
Computing and Interpreting Profitability Ratios
Use the information for Chevron Corporation in E13-1 to complete the following requirements.
Required:
1. Compute the gross profit percentage for each year (rounded to one decimal place). Assuming that the change from 2009 to 2010 is the beginning of a sustained trend, is Chevron likely to earn more or less gross profit from each dollar of sales in 2011
2. Compute the net profit margin for each year (expressed as a percentage with one decimal place). Given your calculations here and in requirement 1, explain whether Chevron did a better or worse job of controlling expenses other than the costs of crude oil and products in 2010 relative to 2009.
3. Chevron reported average net fixed assets of $100 billion in 2010 and $94 billion in 2009. Compute the fixed asset turnover ratios for both years (round to two decimal places). Did the company better utilize its investment in fixed assets to generate revenues in 2010 or 2009
4. Chevron reported average stockholders' equity of $99 billion in 2010 and $89 billion in 2009. Compute the return on equity ratios for both years (expressed as a percentage with one decimal place). Did the company generate greater returns for stockholders in 2010 or 2009
فتح الحزمة
افتح القفل للوصول البطاقات البالغ عددها 84 في هذه المجموعة.
فتح الحزمة
k this deck
50
Computing Profitability Ratios
Use the information in E13-3 to complete the following requirements.
Required:
1. Compute the gross profit percentage for each year (rounded to one decimal place). Assuming that the change from 2009 to 2010 is the beginning of a sustained trend, is Computer Tycoon likely to earn more or less gross profit from each dollar of sales in 2011
2. Compute the net profit margin for each year (expressed as a percentage with one decimal place). Given your calculations here and in requirement 1, explain whether Computer Tycoon did a better or worse job of controlling operating expenses in 2010 relative to 2009.
3. Computer Tycoon reported average net fixed assets of $54,200 in 2010 and $45,100 in 2009. Compute the fixed asset turnover ratios for both years (round to two decimal places). Did the company better utilize its investment in fixed assets to generate revenues in 2010 or 2009
4. Computer Tycoon reported average stockholders' equity of $54,000 in 2010 and $40,800 in 2009. Compute the return on equity ratios for both years (expressed as a percentage with one decimal place). Did the company generate greater returns for stockholders in 2010 than in 2009
فتح الحزمة
افتح القفل للوصول البطاقات البالغ عددها 84 في هذه المجموعة.
فتح الحزمة
k this deck
51
Matching Each Ratio with Its Computational Formula
Match each ratio or percentage with its formula by entering the appropriate letter for each numbered item.
Match each ratio or percentage with its formula by entering the appropriate letter for each numbered item.
فتح الحزمة
افتح القفل للوصول البطاقات البالغ عددها 84 في هذه المجموعة.
فتح الحزمة
k this deck
52
A bank is least likely to use which of the following ratios when analyzing the likelihood that a borrower will pay interest and principal on its loans
A) Current ratio.
B) Debt-to-assets ratio.
C) Times interest earned ratio.
D) Price/earnings ratio.
A) Current ratio.
B) Debt-to-assets ratio.
C) Times interest earned ratio.
D) Price/earnings ratio.
فتح الحزمة
افتح القفل للوصول البطاقات البالغ عددها 84 في هذه المجموعة.
فتح الحزمة
k this deck
53
What is the primary objective of financial reporting
فتح الحزمة
افتح القفل للوصول البطاقات البالغ عددها 84 في هذه المجموعة.
فتح الحزمة
k this deck
54
Which of the following would not directly change the receivables turnover ratio for a company
A) Increases in the selling prices of your inventory.
B) A change in your credit policy.
C) Increases in the cost you incur to purchase inventory.
D) All of the above would directly change the receivables turnover ratio.
A) Increases in the selling prices of your inventory.
B) A change in your credit policy.
C) Increases in the cost you incur to purchase inventory.
D) All of the above would directly change the receivables turnover ratio.
فتح الحزمة
افتح القفل للوصول البطاقات البالغ عددها 84 في هذه المجموعة.
فتح الحزمة
k this deck
55
Analysts use ratios to
A) Compare different companies in the same industry.
B) Track a company's performance over time.
C) Compare a company's performance to industry averages.
D) All of the above describe ways that analysts use ratios.
A) Compare different companies in the same industry.
B) Track a company's performance over time.
C) Compare a company's performance to industry averages.
D) All of the above describe ways that analysts use ratios.
فتح الحزمة
افتح القفل للوصول البطاقات البالغ عددها 84 في هذه المجموعة.
فتح الحزمة
k this deck
56
Given the following ratios for four companies, which company is least likely to experience problems paying its current liabilities promptly
A)
B)
C)
D)
A)
B)
C)
D)
فتح الحزمة
افتح القفل للوصول البطاقات البالغ عددها 84 في هذه المجموعة.
فتح الحزمة
k this deck
57
Analyzing the Inventory Turnover Ratio
A manufacturer reported an inventory turnover ratio of 8.6 during 2012. During 2013, management introduced a new inventory control system that was expected to reduce average inventory levels by 25 percent without affecting sales volume. Given these circumstances, would you expect the inventory turnover ratio to increase or decrease during 2013 Explain.
A manufacturer reported an inventory turnover ratio of 8.6 during 2012. During 2013, management introduced a new inventory control system that was expected to reduce average inventory levels by 25 percent without affecting sales volume. Given these circumstances, would you expect the inventory turnover ratio to increase or decrease during 2013 Explain.
فتح الحزمة
افتح القفل للوصول البطاقات البالغ عددها 84 في هذه المجموعة.
فتح الحزمة
k this deck
58
Analyzing the, Impact of Selected Transactions on the Current Ratio
The Sports Authority, Inc. , is a private full-line sporting goods retailer. Assume one of the Sports Authority stores reported current assets of $88,000 and its current ratio was 1.75, and then completed the following transactions: (1) paid $6,000 on accounts payable, (2) purchased a delivery truck for $10,000 cash, (3) wrote off a bad account receivable for $2,000, and (4) paid previously declared dividends in the amount of$25,000.
Required:
Compute the updated current ratio, rounded to two decimal places, after each transaction.
فتح الحزمة
افتح القفل للوصول البطاقات البالغ عددها 84 في هذه المجموعة.
فتح الحزمة
k this deck
59
Calculations for Vertical Analyses
Refer to M13-1. Perform the calculations needed for vertical analyses. Round percentages to one decimal place.
Refer to M13-1. Perform the calculations needed for vertical analyses. Round percentages to one decimal place.
فتح الحزمة
افتح القفل للوصول البطاقات البالغ عددها 84 في هذه المجموعة.
فتح الحزمة
k this deck
60
Interpreting Vertical Analyses
Refer to the calculations from M13-2. Which of the ratios from Exhibit 13.5 have been included in these calculations Have these two ratios improved or deteriorated in 2013 compared to 2012
Refer to the calculations from M13-2. Which of the ratios from Exhibit 13.5 have been included in these calculations Have these two ratios improved or deteriorated in 2013 compared to 2012
فتح الحزمة
افتح القفل للوصول البطاقات البالغ عددها 84 في هذه المجموعة.
فتح الحزمة
k this deck
61
Inferring Financial Information Using Gross Profit Percentage and Year-over-Year Comparisons
A consumer products company reported a 25 percent increase in sales from 2012 to 2013. Sales in 2012 were $200,000. In 2013, the company reported Cost of Goods Sold in the amount of $150,000. What was the gross profit percentage in 2013 Round to one decimal place.
A consumer products company reported a 25 percent increase in sales from 2012 to 2013. Sales in 2012 were $200,000. In 2013, the company reported Cost of Goods Sold in the amount of $150,000. What was the gross profit percentage in 2013 Round to one decimal place.
فتح الحزمة
افتح القفل للوصول البطاقات البالغ عددها 84 في هذه المجموعة.
فتح الحزمة
k this deck
62
From 2012 to 2013, Colossal Company's current ratio increased and its quick ratio decreased. What does this imply about the level of inventory and prepaids
فتح الحزمة
افتح القفل للوصول البطاقات البالغ عددها 84 في هذه المجموعة.
فتح الحزمة
k this deck
63
Analyzing the Impact of Accounting Alternatives
Nevis Corporation operates in an industry where costs are falling. The company is considering changing its inventory method from FIFO to LIFO and wants to determine the impact that the change would have on selected accounting ratios in future years. In general, what impact would you expect on the following ratios: net profit margin, fixed asset turnover, and current ratio
Nevis Corporation operates in an industry where costs are falling. The company is considering changing its inventory method from FIFO to LIFO and wants to determine the impact that the change would have on selected accounting ratios in future years. In general, what impact would you expect on the following ratios: net profit margin, fixed asset turnover, and current ratio
فتح الحزمة
افتح القفل للوصول البطاقات البالغ عددها 84 في هذه المجموعة.
فتح الحزمة
k this deck
64
Analyzing Comparative Financial Statements Using Selected Ratios
Use the data given in PA 13-1 for Pinnacle Plus.
Required:
1. Compute the gross profit percentage in 2013 and 2012. Round the percentages to one decimal place. Is the trend going in the right direction
2. Compute the net profit margin for 2013 and 2012. Round the percentages to one decimal place. Is the trend going in the right direction
3. Compute the earnings per share for 2013 and 2012. Does the trend look good or bad Explain.
4. Stockholders' equity totaled $100,000 at the end of 2011. Compute the return on equity
(ROE) ratios for 2013 and 2012. Express the ROE as percentages rounded to one decimal place. Is the trend going in the right direction
5. Net property and equipment totaled $110,000 at the end of 2011. Compute the fixed asset turnover ratios for 2013 and 2012. Round the ratios to two decimal places. Is the trend going in the right direction
6. Compute the debt-to-assets ratios for 2013 and 2012. Round the ratios to two decimal places. Is debt providing financing for a larger or smaller proportion of the company's asset growth Explain.
7. Compute the times interest earned ratios for 2013 and 2012. Round the ratios to one decimal place. Do they look good or bad Explain.
8. After Pinnacle Plus released its 2013 financial statements, the company's stock was trading at $18. After the release of its 2012 financial statements, the company's stock price was $15 per share. Compute the P/E ratios for both years, rounded to one decimal place. Does it appear that investors have become more (or less) optimistic about Pinnacle s future success
فتح الحزمة
افتح القفل للوصول البطاقات البالغ عددها 84 في هذه المجموعة.
فتح الحزمة
k this deck
65
Vertical Analysis of an Income Statement
A condensed income statement for Simultech Corporation and a partially completed vertical analysis are presented below.
Required:
1. Complete the vertical analysis by computing each line Item ( a )-( f ) as a percentage of sales revenues. Round to the nearest whole percentage.
2. Does Simultech's Cost of Goods Sold for the year ended January 31, 2013, as a percentage of revenues, represent better or worse performance as compared to that for the year ended January 31, 2012
3. Do the percentages for ( c ) and ( f ) that y6u calculated in 1 indicate whether Simultech's net profit margin has changed over the two years
فتح الحزمة
افتح القفل للوصول البطاقات البالغ عددها 84 في هذه المجموعة.
فتح الحزمة
k this deck
66
Using Ratios to Compare Loan Requests from Two Companies
The 2013 financial statements for Royale and Cavalier companies are summarized here:
These two companies are in the same business and state but different cities. One-half of Royale s sales and one-quarter of Cavalier's sales are on credit. Each company has been in operation for about 10 years. Both companies received an unqualified audit opinion on the financial statements. Royale Company wants to borrow $75,000 cash, and Cavalier Company is asking for $30,000. The loans will be for a two-year period. Both companies estimate bad debts based on an aging analysis, but Cavalier has estimated slightly higher uncollectible rates than Royale. Neither company issued stock in 2013. Assume the end-of-year total assets and net property and equipment balances approximate, the year's average.
Required:
1. Calculate the ratios in Exhibit 13.5 for which sufficient information is available. Round all calculations to two decimal places.
2. Assume that you work in the loan department of a local bank. You have been asked to analyze the situation and recommend which loan is preferable. Based on the data given, your analysis prepared in requirement 1, and any other information (e.g., accounting policies and decisions), give your choice and the supporting explanation.
فتح الحزمة
افتح القفل للوصول البطاقات البالغ عددها 84 في هذه المجموعة.
فتح الحزمة
k this deck
67
Computing the Accounts Receivable and Inventory Turnover Ratios
Procter Gamble is a multinational corporation that manufactures and markets many products that you use every day. In 2010, sales for the company were $78,938 (all amounts in millions). The annual report did not report the amount of credit sales, so we will assume that all sales were on credit. The average gross profit percentage was 52.0 percent. Account balances follow:
Required:
1. Rounded to one decimal place, compute the turnover ratios for accounts receivable and inventory.
2. By dividing 365 by your ratios from requirement 1, calculate the average days to collect receivables and the average days to sell inventory.
3. Interpret what these ratios and measures mean for P G.
Procter Gamble is a multinational corporation that manufactures and markets many products that you use every day. In 2010, sales for the company were $78,938 (all amounts in millions). The annual report did not report the amount of credit sales, so we will assume that all sales were on credit. The average gross profit percentage was 52.0 percent. Account balances follow:
Required:
1. Rounded to one decimal place, compute the turnover ratios for accounts receivable and inventory.
2. By dividing 365 by your ratios from requirement 1, calculate the average days to collect receivables and the average days to sell inventory.
3. Interpret what these ratios and measures mean for P G.
فتح الحزمة
افتح القفل للوصول البطاقات البالغ عددها 84 في هذه المجموعة.
فتح الحزمة
k this deck
68
What is the full disclosure principle
فتح الحزمة
افتح القفل للوصول البطاقات البالغ عددها 84 في هذه المجموعة.
فتح الحزمة
k this deck
69
Analyzing Comparative Financial Statements Using Selected Ratios
Use the data given in PB13-1 for Tiger Audio.
Required:
1. Compute the gross profit percentage in 2013 and 2012. Is the trend going in the right direction
2. Compute the net profit margin for 2013 and 2012. Is the trend going in the right direction
3. Compute the earnings per share for 2013 and 2012. Does the trend look good or bad Explain.
4. Stockholders' equity totaled $65,000 at the end of 2011. Compute the return on equity ratios for 2013 and 2012. Is the trend going in the right direction
5. Net property and equipment totaled $115,000 at the end of 2011. Compute the fixed asset turnover ratios for 2013 and 2012. Is the trend going in the right direction
6. Compute the debt-to-assets ratios for 2013 and 2012. Is debt providing financing for a larger or smaller proportion of the company's asset growth Explain.
7. Compute the times interest earned ratios for 2013 and 2012. Do they look good or bad Explain.
8. After Tiger released its 2013 financial statements, the company's stock was trading at $17. After the release of its 2012 financial statements, the company's stock price was $12 per share. Compute the P/E ratios for both years. Does it appear that investors have become more (or less) optimistic about Tiger's future success
فتح الحزمة
افتح القفل للوصول البطاقات البالغ عددها 84 في هذه المجموعة.
فتح الحزمة
k this deck
70
Vertical Analysis of an Income Statement
A condensed income statement for Southwest Airlines and a partially completed vertical analysts are presented below.
Required:
1. Complete the vertical analysis by computing each line item ( a )-( f ) as a percentage of sales revenues. Round to the nearest whole percentage.
2. Does the percentage that you calculated in 1( a ) suggest that Southwest tried to increase its profit by cutting repairs and maintenance costs in 2010 compared to 2009
3. Refer to the percentages that you calculated in 1( c ) and ( f ). Is Southwest's net profit margin
فتح الحزمة
افتح القفل للوصول البطاقات البالغ عددها 84 في هذه المجموعة.
فتح الحزمة
k this deck
71
Using Ratios to Compare Loan Requests from Two Companies
The 2013 financial statements for Thor and Gunnar Companies are summarized here:
These two companies are in the same business and state but different cities. One-half of Thorns sales and one-quarter of Gunnar's sales are on credit. Each company has been in operation for about 10 years. Both companies received an unqualified audit opinion on the financial statements. Thor Company wants to borrow $105,000, and Gunnar Company is asking for $36,000. The loans will be for a two-year period. Neither company issued stock in 2013. Assume the end-of-year total assets and net property and equipment balances approximate the year's average.
Required:
1. Calculate the ratios in Exhibit 13.5 for which sufficient information is available. Round all calculations to two decimal places.
2. Assume that you work in the loan department of a local bank. You have been asked to analyze the situation and recommend which loan is preferable. Based on the data given, your analysis prepared in requirement 1, and any other information, give your choice and the supporting explanation.
فتح الحزمة
افتح القفل للوصول البطاقات البالغ عددها 84 في هذه المجموعة.
فتح الحزمة
k this deck
72
Which of the following accounting concepts do accountants and auditors assess by using financial analyses
A) Time period.
B) Separate entity.
C) Full disclosure.
D) Going-concern assumption.
A) Time period.
B) Separate entity.
C) Full disclosure.
D) Going-concern assumption.
فتح الحزمة
افتح القفل للوصول البطاقات البالغ عددها 84 في هذه المجموعة.
فتح الحزمة
k this deck
73
Analyzing the Impact of Selected Transactions on the Current Ratio
A company has current assets that total $500,000, a current ratio of 2.00, and uses the perpetual inventory method. Assume that the following transactions are then completed: (1) sold $12,000 in merchandise on short-term credit for $15,000, (2) declared but did not pay dividends of $50,000, (3) paid prepaid rent in the amount of $12,000, (4) paid previously declared dividends in the amount of $50,000, (5) collected an account receivable in the amount of $12,000, and (6) reclassified $40,000 of long-term debt as a current liability.
Required:
Compute the updated current ratio, rounded to two decimal places, after each transaction.
فتح الحزمة
افتح القفل للوصول البطاقات البالغ عددها 84 في هذه المجموعة.
فتح الحزمة
k this deck
74
How is a year-over-year percentage calculated
فتح الحزمة
افتح القفل للوصول البطاقات البالغ عددها 84 في هذه المجموعة.
فتح الحزمة
k this deck
75
What benchmarks are commonly used for interpreting ratios
فتح الحزمة
افتح القفل للوصول البطاقات البالغ عددها 84 في هذه المجموعة.
فتح الحزمة
k this deck
76
Why are some analyses called horizontal and others called vertical
فتح الحزمة
افتح القفل للوصول البطاقات البالغ عددها 84 في هذه المجموعة.
فتح الحزمة
k this deck
77
Inferring Financial Information Using the Current Ratio
Mystic Laboratories reported total assets of $11,200,000 and noncurrent assets of $1,480,000. The company also reported a current ratio of 1.5. What amount of current liabilities did the company report
Mystic Laboratories reported total assets of $11,200,000 and noncurrent assets of $1,480,000. The company also reported a current ratio of 1.5. What amount of current liabilities did the company report
فتح الحزمة
افتح القفل للوصول البطاقات البالغ عددها 84 في هذه المجموعة.
فتح الحزمة
k this deck
78
Describing the Effect of Accounting Decisions on Ratios
For each of the following three accounting choices, indicate the decision that will yield ( a ) a higher net profit margin and ( b ) a lower current ratio. If the decision does not affect the ratio, indicate "no effect."
1. Straight-line versus accelerated depreciation (in the first year of the asset's life).
2. FIFO versus LIFO (in periods of constantly rising costs and rising inventory levels).
3. Straight-line depreciation with a four-year useful life versus a seven-year useful life (no residual value).
فتح الحزمة
افتح القفل للوصول البطاقات البالغ عددها 84 في هذه المجموعة.
فتح الحزمة
k this deck
79
Evaluating Profitability, Liquidity, and Solvency
Looking back over the last few years it is clear that Nicole Mackisey has accomplished a lot running her business Nicole's Getaway Spa (NGS). Nicole is curious about her company's performance as she compares its financial statements.
Required:
1. Was NGS more profitable in 2014 or 2015 Use the gross profit percentage, return on equity, and asset turnover ratio to help in making a decision (round each ratio to two decimal places).
2. Was NGS more liquid in 2014 or 2015 Use the current ratio and quick ratio to help in making a decision (round each ratio to two decimal places).
3. Was NGS more solvent in 2014 or 2015 Use the debt-to-assets ratio and times interest earned ratio to help in making a decision (round each ratio to two decimal places).
فتح الحزمة
افتح القفل للوصول البطاقات البالغ عددها 84 في هذه المجموعة.
فتح الحزمة
k this deck
80
Evaluating Financial Information
Lumber Liquidators, Inc., competes with Lowe's in product lines such as hardwood flooring, moldings, and noise-reducing underlay. The two companies reported the following financial results in fiscal 2010:
Required:
1. Explain how Lowe's could have a higher gross profit percentage than Lumber Liquidators but a nearly identical net profit margin. What does this suggest about the relative ability of the two companies to control operating expenses
2. Explain how Lumber Liquidators could have a higher return on equity but lower earnings per share. What does this suggest about the companies' relative number of outstanding shares What other explanations could account for this seemingly contradictory pattern
فتح الحزمة
افتح القفل للوصول البطاقات البالغ عددها 84 في هذه المجموعة.
فتح الحزمة
k this deck
فتح الحزمة
افتح القفل للوصول البطاقات البالغ عددها 84 في هذه المجموعة.


