Deck 9: Tracking Work
ملء الشاشة (f)
سؤال
سؤال
سؤال
سؤال
سؤال
سؤال
سؤال
سؤال

فتح الحزمة
قم بالتسجيل لفتح البطاقات في هذه المجموعة!
Unlock Deck
Unlock Deck
1/8
العب
ملء الشاشة (f)
Deck 9: Tracking Work
1
Calculate the percent complete for the project shown below using the Weighted Units method for measurement of work.
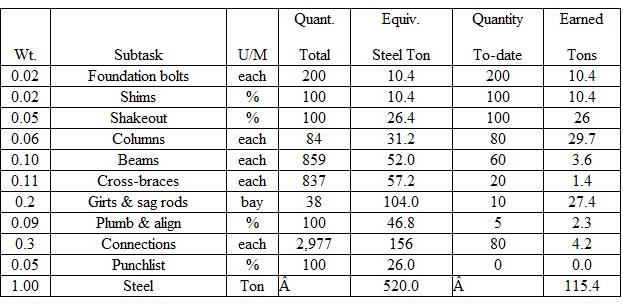 Percent Complete = 115.4 tons / 520.0 tons = 22.2%
 2
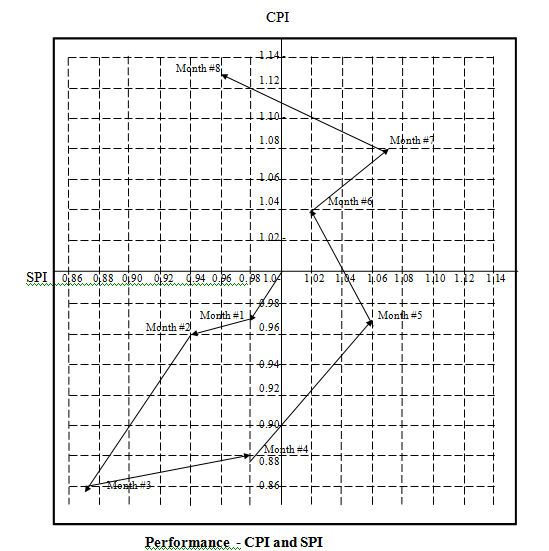
The EPC project shown in Appendix A has an original planned schedule of 17 months with a budget, excluding contingency, of $3,053,150. Below are update reports for the first 8 months of the project.
Analysis of Month #1:
The status report after Month #1 into the project includes the following information:
Planned, BCWS = $3,929
Earned, BCWP = $3,870
Actual, ACWP = $3,968
Budget at Completion, BAC = $3,053,150
Cost and Schedule Deviations:
Cost Variance = BCWP - ACWP
= $3,870 - $3,968
= -$98
A negative value of CV represents a cost overrun. Based on the status report the actual cost is greater than earned by $98.
Schedule Variance = BCWP - BCWS
= $3,870 - $3,929
= -$59
A negative value of SV represents a schedule slippage. The project is behind the planned schedule.
Cost and Schedule Performance:
Cost Performance Index, CPI = BCWP / ACWP
= $3,870 / $3,968
= 0.97
The CPI is less than one, which indicates a poor cost performance. The earned value is less than the actual costs.
Schedule Performance Index, SPI = BCWP / BCWS
= $3,870 / $3,929
= 0.98
The SPI is less than one, which indicates the schedule performance is worse than planned. The project is behind schedule.
Forecasting Cost at Completion
Estimate to Complete, ETC = (BAC - BCWP) / CPI = ($3,053,150 - $3,870) / 0.97
= $3,143,588
Based on the analysis of the status report, the remaining cost to complete the project is $3,143,588
Estimate at Completion, EAC = ACWP + ETC
= 3,968 + $3,143,588
= $3,147,556
Based on analysis of the status report, the estimated cost of the project at completion is $3,147,556, which is $94,406 over the original budget of $3,053,150.
Chapter #9 - Tracking Work
Question #8 continued - Analysis of Month #2:
The status report after Month #2 into the project includes the following information:
Planned, BCWS = $45,672
Earned, BCWP = $42,932
Actual, ACWP = $44,721
Budget at Completion, BAC = $3,053,150
Cost and Schedule Deviations:
Cost Variance = BCWP - ACWP
= $42,932 - $44,721
= -$1,789
A negative value of CV represents a cost overrun. Based on the status report the actual cost is greater than earned by $1,789.
Schedule Variance = BCWP - BCWS
= $42,932 - $45,672
= -$2,740
A negative value of SV represents a schedule slippage. The project is behind the planned schedule.
Cost and Schedule Performance:
Cost Performance Index, CPI = BCWP / ACWP
= $42,932 / $44,721
= 0.96
The CPI is less than one, which indicates a poor cost performance. The earned value is less than the actual costs.
Schedule Performance Index, SPI = BCWP / BCWS
= $42,932 / $45,672
= 0.94
The SPI is less than one, which indicates the schedule performance is worse than planned. The project is behind schedule.
Forecasting Cost at Completion
Estimate to Complete, ETC = (BAC - BCWP) / CPI = ($3,053,150 - $42,932) / 0.96
= $3,135,644
Based on the analysis of the status report, the remaining cost to complete the project is $3,135,644.
Estimate at Completion, EAC = ACWP + ETC
= $44,721 + $3,135,644
= $3,180,365
Based on analysis of the status report, the estimated cost of the project at completion is $3,180,365, which is $127,215 over the original budget of $3,053,150.
Chapter #9 - Tracking Work
Question #8 continued - Analysis of Month #3:
The status report after Month #3 into the project includes the following information:
Planned, BCWS = $184,904
Earned, BCWP = $162,715
Actual, ACWP = $191,429
Budget at Completion, BAC = $3,053,150
Cost and Schedule Deviations:
Cost Variance = BCWP - ACWP
= $162,715 - $191,429
= -$28,714
A negative value of CV represents a cost overrun. Based on the status report the actual cost is greater than earned by $28,714.
Schedule Variance = BCWP - BCWS
= $162,715 - $184,904
= -$22,189
A negative value of SV represents a schedule slippage. The project is behind the planned schedule.
Cost and Schedule Performance:
Cost Performance Index, CPI = BCWP / ACWP
= $162,715 / $191,429
= 0.85
The CPI is less than one, which indicates a poor cost performance. The earned value is less than the actual costs.
Schedule Performance Index, SPI = BCWP / BCWS
= $162,715 / $184,904
= 0.88
The SPI is less than one, which indicates the schedule performance is worse than planned. The project is behind schedule.
Forecasting Cost at Completion
Estimate to Complete, ETC = (BAC - BCWP) / CPI = ($3,053,150 - $162,715) / 0.85
= $3,400,512
Based on the analysis of the status report, the remaining cost to complete the project is $3,400,512.
Estimate at Completion, EAC = ACWP + ETC
= $191,429 + $3,400,512
= $3,591,941
Based on analysis of the status report, the estimated cost of the project at completion is $3,591,941, which is $538,791 over the original budget of $3,053,150.
Chapter #9 - Tracking Work
Question #8 continued - Analysis of Month #4:
The status report after Month #4 into the project includes the following information:
Planned, BCWS = $315,615
Earned, BCWP = $309,303
Actual, ACWP = $351,481
Budget at Completion, BAC = $3,053,150
Cost and Schedule Deviations:
Cost Variance = BCWP - ACWP
= $315,615 - $351,481
= -$35,866
A negative value of CV represents a cost overrun. Based on the status report the actual cost is greater than earned by $35,866.
Schedule Variance = BCWP - BCWS
= $309,303 - $315,615
= -$6,312
A negative value of SV represents a schedule slippage. The project is behind the planned schedule.
Cost and Schedule Performance:
Cost Performance Index, CPI = BCWP / ACWP
= $309,303 / $351,481
= 0.88
The CPI is less than one, which indicates a poor cost performance. The earned value is less than the actual costs.
Schedule Performance Index, SPI = BCWP / BCWS
= $309,303 / $315,615
= 0.98
The SPI is less than one, which indicates the schedule performance is worse than planned. The project is behind schedule.
Forecasting Cost at Completion
Estimate to Complete, ETC = (BAC - BCWP) / CPI = ($3,053,150 - $309,303) / 0.88
= $3,118,008
Based on the analysis of the status report, the remaining cost to complete the project is $3,118,008.
Estimate at Completion, EAC = ACWP + ETC
= $351,181 + $3,118,008
= $3,469,489
Based on analysis of the status report, the estimated cost of the project at completion is $3,469,489, which is $416,339 over the original budget of $3,053,150.
Chapter #9 - Tracking Work
Question #8 continued - Analysis of Month #5:
The status report after Month #5 into the project includes the following information:
Planned, BCWS = $479,343
Earned, BCWP = $508,103
Actual, ACWP = $523,818
Budget at Completion, BAC = $3,053,150
Cost and Schedule Deviations:
Cost Variance = BCWP - ACWP
= $508,103 - $523,818
= -$15,715
A negative value of CV represents a cost overrun. Based on the status report the actual cost is greater than earned by $15,715.
Schedule Variance = BCWP - BCWS
= $508,103 - $479,343
= +$28,760
A positive value of SV represents a good schedule performance. The project is ahead of the planned schedule.
Cost and Schedule Performance:
Cost Performance Index, CPI = BCWP / ACWP
= $508,103 / $523,818
= 0.97
The CPI is less than one, which indicates a poor cost performance. The earned value is less than the actual costs.
Schedule Performance Index, SPI = BCWP / BCWS
= $508,103 / $479,343
= 1.06
The SPI is greater than one, which indicates the schedule performance is better than planned. The project is ahead of schedule.
Forecasting Cost at Completion
Estimate to Complete, ETC = (BAC - BCWP) / CPI = ($3,053,150 - $508,103) / 0.97
= $2,623,760
Based on the analysis of the status report, the remaining cost to complete the project is $2,623,760.
Estimate at Completion, EAC = ACWP + ETC
= $523,818 + $2,623,760
= $3,147,578
Based on analysis of the status report, the estimated cost of the project at completion is $3,147,578, which is $94,428 over the original budget of $3,053,150.
Chapter #9 - Tracking Work
Question #8 continued - Analysis of Month #6:
The status report after Month #6 into the project includes the following information:
Planned, BCWS = $545,863
Earned, BCWP = $556,780
Actual, ACWP = $535,365
Budget at Completion, BAC = $3,053,150
Cost and Schedule Deviations:
Cost Variance = BCWP - ACWP
= $556,780 - $535,365
= +$21,415
A positive value of CV represents a good cost performance. Based on the status report the actual cost is less than earned by $21,415.
Schedule Variance = BCWP - BCWS
= $556,780 - $545,863
= +$10,917
A positive value of SV represents a good schedule performance. The project is ahead of the planned schedule.
Cost and Schedule Performance:
Cost Performance Index, CPI = BCWP / ACWP
= $556,780 / $535,365
= 1.04
The CPI is greater than one, which indicates a good cost performance. The earned value is greater than the actual costs.
Schedule Performance Index, SPI = BCWP / BCWS
= $556,780 / $545,863
= 1.02
The SPI is greater than one, which indicates the schedule performance is better than planned. The project is ahead of schedule.
Forecasting Cost at Completion
Estimate to Complete, ETC = (BAC - BCWP) / CPI = ($3,053,150 - $556,780) / 1.04
= $2,400,356
Based on the analysis of the status report, the remaining cost to complete the project is $2,400,356.
Estimate at Completion, EAC = ACWP + ETC
= $535,365 + $2,400,356
= $2,935,721
Based on analysis of the status report, the estimated cost of the project at completion is $2,935,721, which is $117,429 under the original budget of $3,053,150.
Chapter #9 - Tracking Work
Question #8 continued - Analysis of Month #7:
The status report after Month #7 into the project includes the following information:
Planned, BCWS = $667,210
Earned, BCWP = $713,915
Actual, ACWP = $661,032
Budget at Completion, BAC = $3,053,150
Cost and Schedule Deviations:
Cost Variance = BCWP - ACWP
= $713,915 - $661,032
= +$52,883
A positive value of CV represents a good cost performance. Based on the status report the actual cost is less than earned by $52,883.
Schedule Variance = BCWP - BCWS
= $713,915 - $667,210
= +$46,705
A positive value of SV represents a good schedule performance. The project is ahead of the planned schedule.
Cost and Schedule Performance:
Cost Performance Index, CPI = BCWP / ACWP
= $713,915 / $661,032
= 1.08
The CPI is greater than one, which indicates a good cost performance. The earned value is greater than the actual costs.
Schedule Performance Index, SPI = BCWP / BCWS
= $713,915 / $667,210
= 1.07
The SPI is greater than one, which indicates the schedule performance is better than planned. The project is ahead of schedule.
Forecasting Cost at Completion
Estimate to Complete, ETC = (BAC - BCWP) / CPI = ($3,053,150 - $713,915) / 1.08
= $2,165,958
Based on the analysis of the status report, the remaining cost to complete the project is $2,165,958.
Estimate at Completion, EAC = ACWP + ETC
= $661,032 + $2,165,958
= $2,826,990
Based on analysis of the status report, the estimated cost of the project at completion is $2,826,990, which is $226,160 under the original budget of $3,053,150.
Chapter #9 - Tracking Work
Question #8 continued - Analysis of Month #8:
The status report after Month #8 into the project includes the following information:
Planned, BCWS = $846,740
Earned, BCWP = $812,870
Actual, ACWP = $719,354
Budget at Completion, BAC = $3,053,150
Cost and Schedule Deviations:
Cost Variance = BCWP - ACWP
= $812,870 - $719,354
= +$93,516
A positive value of CV represents a good cost performance. Based on the status report the actual cost is less than earned by $93,516.
Schedule Variance = BCWP - BCWS
= $812,870 - $846,740
= -$33,870
A negative value of SV represents a schedule slippage. The project is behind the planned schedule.
Cost and Schedule Performance:
Cost Performance Index, CPI = BCWP / ACWP
= $812,870 / $719,354
= 1.13
The CPI is greater than one, which indicates a good cost performance. The earned value is greater than the actual costs.
Schedule Performance Index, SPI = BCWP / BCWS
= $812,870 / $846,740
= 0.96
The SPI is less than one, which indicates a poor schedule performance. The project is behind schedule.
Forecasting Cost at Completion
Estimate to Complete, ETC = (BAC - BCWP) / CPI = ($3,053,150 - $812,870) / 1.13
= $1,982,549
Based on the analysis of the status report, the remaining cost to complete the project is $1,982,549.
Estimate at Completion, EAC = ACWP + ETC
= $719,354 + $1,982,549
= $2,701,903
Based on analysis of the status report, the estimated cost of the project at completion is $2,701,903, which is $351,247 under the original budget of $3,053,150.
Chapter 9 - Tracking Work
Question #8 continued -
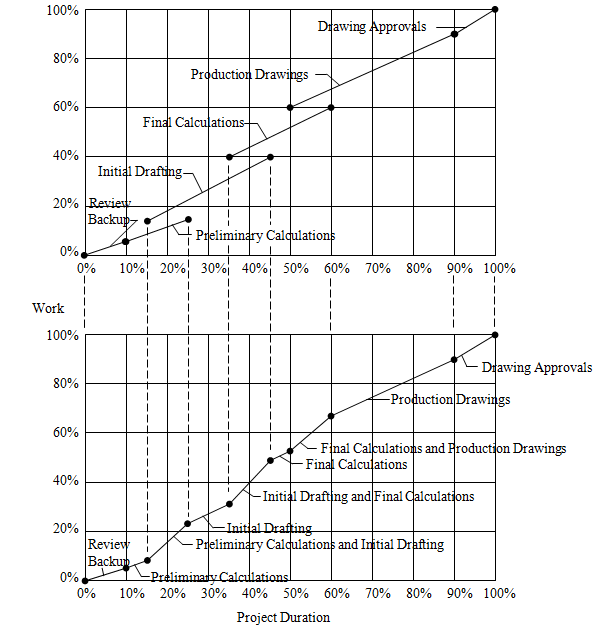
3
You are the project manager for a project and have worked with your team members to establish the following criteria for tracking the work of the project. Develop the work/time relationship curve for the project.
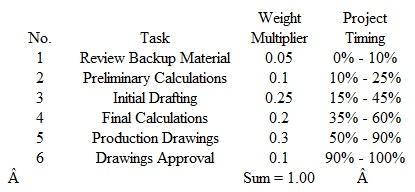 Calculations for the composite weights are shown below. The graphical presentation is shown on the following page:
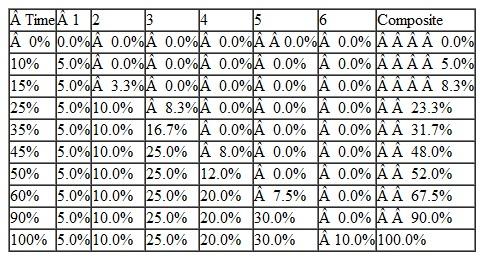
4
The design team for a project has met and determined the grouping of tasks required for the design effort into six categories., The team has also agreed on the following criteria for the weight multipliers to be used to track the design effort. Prepare a graph that shows the relationship between work and time.
فتح الحزمة
افتح القفل للوصول البطاقات البالغ عددها 8 في هذه المجموعة.
فتح الحزمة
k this deck
5
At 50% into the project duration, the status report for the project in Question 2 shows the following information. Prepare a graph that shows the time relationship of the planned wok and actual work. Is the project ahead or behind schedule
فتح الحزمة
افتح القفل للوصول البطاقات البالغ عددها 8 في هذه المجموعة.
فتح الحزمة
k this deck
6
The following data represents the Information that has been jointly compiled by the design team for a project. This data represents the planned cost and the work anticipated during the design phase. Prepare an integrated planned cost/time/work graph for the project.
فتح الحزمة
افتح القفل للوصول البطاقات البالغ عددها 8 في هذه المجموعة.
فتح الحزمة
k this deck
7
The data shown below represents the planned time, cost, and work at the beginning of the design of a project. Prepare the integrated time/cost/work graph.
فتح الحزمة
افتح القفل للوصول البطاقات البالغ عددها 8 في هذه المجموعة.
فتح الحزمة
k this deck
8
The following weight multipliers have been established for the construction phase of a project. Prepare a graph that shows the relationship between accomplished work and time.
فتح الحزمة
افتح القفل للوصول البطاقات البالغ عددها 8 في هذه المجموعة.
فتح الحزمة
k this deck
فتح الحزمة
افتح القفل للوصول البطاقات البالغ عددها 8 في هذه المجموعة.


