Deck 1: Introduction
ملء الشاشة (f)
سؤال
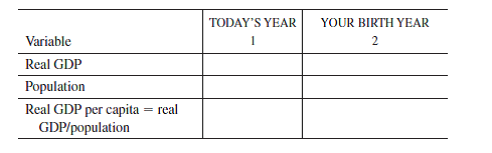
In this exercise, we will calculate by how much U.S. per capita real income has increased between the year you were born and today. Go to http://research.stlouisfed.org/fred2. To find real GDP data, click on "Categories" under "National Accounts," select "National Income Product Accounts," then "GDP/GNP". Then search "GDPCA." For population data, go back to the FRED II home page and click on "Categories" under "Population, Employment, Labor Markets," select "Population," then search "Employment Population." Under "Categories," select "Population," "POP." Use the information provided at these two places to fill in columns 1 and 2 in the table below. Note that you may need to transform the series into annual averages; to do this, take the average of the monthly data in the desired years. You can calculate real GDP per capita by dividing real GDP by population. After filling in columns 1 and 2, you can find out how much per capita income is higher today compared to the year you were born ( Hint : Simply divide the value in column 1 by the value in column 2).
سؤال
سؤال

فتح الحزمة
قم بالتسجيل لفتح البطاقات في هذه المجموعة!
Unlock Deck
Unlock Deck
1/3
العب
ملء الشاشة (f)
Deck 1: Introduction
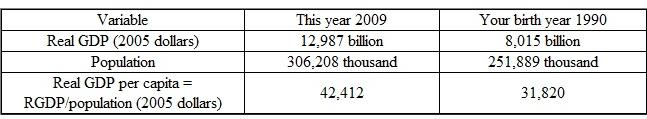
In this exercise, we will calculate by how much U.S. per capita real income has increased between the year you were born and today. Go to http://research.stlouisfed.org/fred2. To find real GDP data, click on "Categories" under "National Accounts," select "National Income Product Accounts," then "GDP/GNP". Then search "GDPCA." For population data, go back to the FRED II home page and click on "Categories" under "Population, Employment, Labor Markets," select "Population," then search "Employment Population." Under "Categories," select "Population," "POP." Use the information provided at these two places to fill in columns 1 and 2 in the table below. Note that you may need to transform the series into annual averages; to do this, take the average of the monthly data in the desired years. You can calculate real GDP per capita by dividing real GDP by population. After filling in columns 1 and 2, you can find out how much per capita income is higher today compared to the year you were born ( Hint : Simply divide the value in column 1 by the value in column 2).
Since this question requires comparisons between the current year and a student's birth year, the answer is student specific. The answers below are based on the assumption that a student was born on 01/01/1990, and that this year is the start of 2009 (the most recent year for which data are currently available). Using the data for 01/01/1990 and 01/01/2009, we find that real income per capita in the U.S. was about 1.3 times as high in 2009 as it was in 1990.
Suppose that actual output is $120 billion and potential (full-employment) output is $156 billion. What is an output gap in this hypothetical economy Based on your estimate of the output gap, would you expect the unemployment level to be higher or lower than usual
Potential output is the maximum level of output that can be produced in a nation efficiently. Actual output is the actual production in the nation. The unemployment level is equal to the natural rate of unemployment at the potential output level.
The given information is as follows:
The potential output is $156 billion.
The actual output is $120 billion.
Calculate the output gap as shown below:
 At this stage, the output gap is negative. The actual output is less than the potential output. So, the workers employed will also be less than normal.
Therefore, the unemployment rate will be higher than usual.
The given information is as follows:
The potential output is $156 billion.
The actual output is $120 billion.
Calculate the output gap as shown below:
At this stage, the output gap is negative. The actual output is less than the potential output. So, the workers employed will also be less than normal.Therefore, the unemployment rate will be higher than usual.
Using the aggregate supply-aggregate demand model, explain how output and prices are determined. Will output vary or stay fixed in the long run Suppose the aggregate demand curve were to remain fixed: What can we infer about the behavior of prices over time
The aggregate demand is the sum of consumption, investment, government expenditure, and net exports. The curve of aggregate demand represents the output at each price level where goods and money market are in equilibrium.
The aggregate supply is the total amount of output that an economy can produce at given price and resources. The curve of aggregate supply curve represents the output firms willing to sell at each price level.
Using the AD-AS model, the output and price are determined by the intersection of AS and AD curves. However, the shape of the curves is different in different the time frame. This is because the shape of the aggregate supply curve is horizontal in the short-run and vertical in the long-run.
In the short-run, the AS curve is horizontal and AD curve is downward sloping. The output is determined by the aggregate demand whereas the price remains fixed. Therefore, the price level is fixed where the aggregate supply hits the vertical axis and output level can change.
In the long-run, the AS curve is vertical and AD curve is downward sloping. The output is determined by the aggregate supply curve and the price is determined by the aggregate demand. Therefore, the output is fixed where the aggregate supply hits the horizontal axis and price can change.
In the medium run, the aggregate supply curve is upward sloping, and the aggregate demand curve is downward sloping. The intersection of both curves after fluctuations determine the output and price level.
In the long run, when the AS curve shifts to rightward, there will be an increase in the potential output. Thus, the output can vary in the long-run.
Suppose the aggregate demand curve is fixed but the aggregate supply curve can change. In such a case, with the change in the supply, the price level will change. For instance, an increase in the supply will reduce the price level. Therefore, the price level change over time keeping aggregate demand fix.
فتح الحزمة
افتح القفل للوصول البطاقات البالغ عددها 3 في هذه المجموعة.


