Deck 2: Basic Descriptive Statistics Percentages, Ratios Rates, Tables, Charts Graphs
ملء الشاشة (f)
سؤال
سؤال
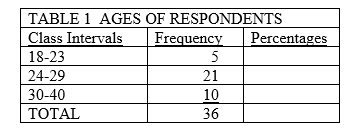
A possible problem with Table 1 is that
A) class intervals overlap
B) class intervals are too large
C) class intervals are unequal in size
D) class intervals are exhaustive
سؤال
سؤال
سؤال
In Table 1, what proportion of cases are 18-23?
A) 0.05
B) 0.36
C) 0.78
D) 0.13
سؤال
سؤال
In Table 1, what percentage of cases is in the 18-23 age group?
A) ( 5/36) x 100 = 13.51%
B) (18/23) x 100 = 78.26%
C) (36/ 5) x 100 = 7.4%
D) ( 5/21) x 100 = 23.81%
سؤال
سؤال
سؤال
سؤال
سؤال
سؤال
سؤال
سؤال
سؤال
سؤال
سؤال
In Table 1, what is the ratio of 30-40 year olds to 18-23 year olds?
A) 0.24:1.00
B) 4.20:1.00
C) 2.00:1.00
D) 1.00:1.00
سؤال
سؤال
سؤال
سؤال
سؤال
سؤال
سؤال
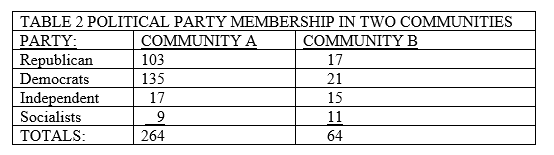
In Table 2, which is the correct fraction for determining the proportion of Independents in community B?
A) 15/17
B) 15/264
C) 64/15
D) 15/64
سؤال
سؤال
سؤال
In Table 2, which community has the higher proportion of Independents?
A) Community A
B) Community B
C) Neither
D) This proportion can't be determined from the information given.
سؤال
سؤال
سؤال
سؤال
سؤال
In Table 2, what percentage of Community A are Republicans?
A) (103/264) x 100 = 39.02
B) (103/17) x 100 = 605.88
C) (264/328) x 100 = 80.49
D) (103/135) x 100 = 76.30
سؤال
سؤال
سؤال
سؤال
In Table 2, what is the ratio of Independents to Socialists in Community A?
A) 15:11
B) 17:9
C) 9:17
D) 17:264
سؤال
In Table 2, what is the ratio of Socialists to Democrats in Community B?
A) 11:21
B) 11:64
C) 64:11
D) 9:11
سؤال
سؤال
In Table 2, what percentage of Democrats lives in community B?
A) (21 / 64) x 100 = 32.8
B) (21/328) x 100 = 6.4
C) (21/156) x 100 = 13.5
D) (64/264) x 100 = 24.2
سؤال
سؤال
سؤال
سؤال
سؤال
سؤال
سؤال
سؤال

فتح الحزمة
قم بالتسجيل لفتح البطاقات في هذه المجموعة!
Unlock Deck
Unlock Deck
1/48
العب
ملء الشاشة (f)
Deck 2: Basic Descriptive Statistics Percentages, Ratios Rates, Tables, Charts Graphs
1
The midpoints of intervals for frequency distributions constructed with interval-ratio variables are found by
A) adding the upper and lower class limits for each interval and then dividing by 2.
B) multiplying the upper and lower class limits for each interval
C) dividing the range by 10
D) None of the above. Class intervals for interval-ratio variables do not have midpoints.
A) adding the upper and lower class limits for each interval and then dividing by 2.
B) multiplying the upper and lower class limits for each interval
C) dividing the range by 10
D) None of the above. Class intervals for interval-ratio variables do not have midpoints.
adding the upper and lower class limits for each interval and then dividing by 2.
2
A possible problem with Table 1 is that
A) class intervals overlap
B) class intervals are too large
C) class intervals are unequal in size
D) class intervals are exhaustive
class intervals are unequal in size
3
Cumulative frequencies and cumulative percentages allow a researcher to
A) be sure the column totals are correct
B) tell at a glance how many cases fall above or below a given category
C) show the accuracy of his or her findings
D) all of the above
A) be sure the column totals are correct
B) tell at a glance how many cases fall above or below a given category
C) show the accuracy of his or her findings
D) all of the above
tell at a glance how many cases fall above or below a given category
4
When constructing frequency distributions for variables measured at the interval-ratio level, approximate interval size (or interval width) can be found by
A) dividing sample size (N) by 10
B) multiplying the number of categories by the lowest score
C) dividing the range by the sample size (N)
D) dividing the range (R) by the number of categories (k)
A) dividing sample size (N) by 10
B) multiplying the number of categories by the lowest score
C) dividing the range by the sample size (N)
D) dividing the range (R) by the number of categories (k)
فتح الحزمة
افتح القفل للوصول البطاقات البالغ عددها 48 في هذه المجموعة.
فتح الحزمة
k this deck
5
In Table 1, what proportion of cases are 18-23?
A) 0.05
B) 0.36
C) 0.78
D) 0.13
فتح الحزمة
افتح القفل للوصول البطاقات البالغ عددها 48 في هذه المجموعة.
فتح الحزمة
k this deck
6
Forty of every two hundred students attend all of their classes. What percentage of the student body is this?
A) 5%
B) 50%
C) 2%
D) 20%
A) 5%
B) 50%
C) 2%
D) 20%
فتح الحزمة
افتح القفل للوصول البطاقات البالغ عددها 48 في هذه المجموعة.
فتح الحزمة
k this deck
7
In Table 1, what percentage of cases is in the 18-23 age group?
A) ( 5/36) x 100 = 13.51%
B) (18/23) x 100 = 78.26%
C) (36/ 5) x 100 = 7.4%
D) ( 5/21) x 100 = 23.81%
فتح الحزمة
افتح القفل للوصول البطاقات البالغ عددها 48 في هذه المجموعة.
فتح الحزمة
k this deck
8
If we added a cumulative percentage column to Table 1 and began our calculations with the 18-23 interval, the entry in the 30-40 interval would be
A) 10%
B) 33.3%
C) 37%
D) 100%
A) 10%
B) 33.3%
C) 37%
D) 100%
فتح الحزمة
افتح القفل للوصول البطاقات البالغ عددها 48 في هذه المجموعة.
فتح الحزمة
k this deck
9
The class intervals below represent ages of young adult respondents. Which set of intervals is both exhaustive and mutually exclusive?
A) 18-19 19-20
20-21
B) 18-19 20-21
22-23
C) 18-20 22-24
26-28
D) 18-19 21-22
24-25
A) 18-19 19-20
20-21
B) 18-19 20-21
22-23
C) 18-20 22-24
26-28
D) 18-19 21-22
24-25
فتح الحزمة
افتح القفل للوصول البطاقات البالغ عددها 48 في هذه المجموعة.
فتح الحزمة
k this deck
10
If 60 cases range in score from 4 to 84 and you want 10 intervals in a frequency distribution, approximately what will be the width of each interval?
A) 4
B) 8
C) 12
D) 60
A) 4
B) 8
C) 12
D) 60
فتح الحزمة
افتح القفل للوصول البطاقات البالغ عددها 48 في هذه المجموعة.
فتح الحزمة
k this deck
11
As a very general rule, frequency distributions should have ___ categories.
A) less than 5
B) more than 20
C) no more than 5
D) about 10
A) less than 5
B) more than 20
C) no more than 5
D) about 10
فتح الحزمة
افتح القفل للوصول البطاقات البالغ عددها 48 في هذه المجموعة.
فتح الحزمة
k this deck
12
Twenty-three of the 50 states rejected a proposed constitutional amendment to make the house fly the National Insect. What percentage is this?
A) 23%
B) 25%
C) 46%
D) 54%
A) 23%
B) 25%
C) 46%
D) 54%
فتح الحزمة
افتح القفل للوصول البطاقات البالغ عددها 48 في هذه المجموعة.
فتح الحزمة
k this deck
13
Which of the following is an impossible value for a percentage?
A) 0.0%
B) 47.458923%
C) 110.00%
D) 0.05%
A) 0.0%
B) 47.458923%
C) 110.00%
D) 0.05%
فتح الحزمة
افتح القفل للوصول البطاقات البالغ عددها 48 في هذه المجموعة.
فتح الحزمة
k this deck
14
Frequency distributions may be compiled for variables measured at which level?
A) nominal
B) ordinal
C) interval-ratio
D) all of the above
A) nominal
B) ordinal
C) interval-ratio
D) all of the above
فتح الحزمة
افتح القفل للوصول البطاقات البالغ عددها 48 في هذه المجموعة.
فتح الحزمة
k this deck
15
To calculate a proportion, the number of cases in any category (f) is divided by
A) the total number of categories (k)
B) the number of cases in all categories (N)
C) the cases in that category (f)
D) the number of cases in adjacent categories (k-1)
A) the total number of categories (k)
B) the number of cases in all categories (N)
C) the cases in that category (f)
D) the number of cases in adjacent categories (k-1)
فتح الحزمة
افتح القفل للوصول البطاقات البالغ عددها 48 في هذه المجموعة.
فتح الحزمة
k this deck
16
When working with a very small number of cases, it is usually preferable to report
A) percentages
B) proportions
C) fractions
D) actual frequencies
A) percentages
B) proportions
C) fractions
D) actual frequencies
فتح الحزمة
افتح القفل للوصول البطاقات البالغ عددها 48 في هذه المجموعة.
فتح الحزمة
k this deck
17
The sum of the proportions for all categories of a variable will be
A) 100.00
B) 10.00
C) 1.00
D) 0.10
A) 100.00
B) 10.00
C) 1.00
D) 0.10
فتح الحزمة
افتح القفل للوصول البطاقات البالغ عددها 48 في هذه المجموعة.
فتح الحزمة
k this deck
18
In Table 1, what is the ratio of 30-40 year olds to 18-23 year olds?
A) 0.24:1.00
B) 4.20:1.00
C) 2.00:1.00
D) 1.00:1.00
فتح الحزمة
افتح القفل للوصول البطاقات البالغ عددها 48 في هذه المجموعة.
فتح الحزمة
k this deck
19
To be converted to a percentage, the proportion must be multiplied by
A) 10
B) 100
C) 1000
D) any of the above
A) 10
B) 100
C) 1000
D) any of the above
فتح الحزمة
افتح القفل للوصول البطاقات البالغ عددها 48 في هذه المجموعة.
فتح الحزمة
k this deck
20
A frequency distribution should reflect a balance of
A) detail and conciseness
B) time and money
C) questions and answers
D) elegance and symmetry
A) detail and conciseness
B) time and money
C) questions and answers
D) elegance and symmetry
فتح الحزمة
افتح القفل للوصول البطاقات البالغ عددها 48 في هذه المجموعة.
فتح الحزمة
k this deck
21
Open-ended intervals
A) are always preferable to unequal intervals
B) should never be used in actual research
C) can be useful when there are a few very high or very low scores in a distribution
D) should only be used with ordinal-level variables
A) are always preferable to unequal intervals
B) should never be used in actual research
C) can be useful when there are a few very high or very low scores in a distribution
D) should only be used with ordinal-level variables
فتح الحزمة
افتح القفل للوصول البطاقات البالغ عددها 48 في هذه المجموعة.
فتح الحزمة
k this deck
22
To find the ratio of smokers to non-smokers, you would
A) divide the number of non-smokers by the number of smokers
B) add them together and divide by the number of smokers
C) divide the number of smokers by the number of non-smokers
D) multiply the number of smokers by the total number of people
A) divide the number of non-smokers by the number of smokers
B) add them together and divide by the number of smokers
C) divide the number of smokers by the number of non-smokers
D) multiply the number of smokers by the total number of people
فتح الحزمة
افتح القفل للوصول البطاقات البالغ عددها 48 في هذه المجموعة.
فتح الحزمة
k this deck
23
In reading SPSS output for the Frequencies procedure, we usually ignore the 'Percent' column because it
A) includes "missing" scores
B) excludes scores labeled DK and NA
C) is appropriate only for nominal-level variables
D) is based on cumulative percentages
A) includes "missing" scores
B) excludes scores labeled DK and NA
C) is appropriate only for nominal-level variables
D) is based on cumulative percentages
فتح الحزمة
افتح القفل للوصول البطاقات البالغ عددها 48 في هذه المجموعة.
فتح الحزمة
k this deck
24
Proportions and percentages, ratios and rates are all ways of expressing
A) concise distributions of a variable
B) data without leaving out any details
C) relative frequencies
D) raw frequencies
A) concise distributions of a variable
B) data without leaving out any details
C) relative frequencies
D) raw frequencies
فتح الحزمة
افتح القفل للوصول البطاقات البالغ عددها 48 في هذه المجموعة.
فتح الحزمة
k this deck
25
In Table 2, which is the correct fraction for determining the proportion of Independents in community B?
A) 15/17
B) 15/264
C) 64/15
D) 15/64
فتح الحزمة
افتح القفل للوصول البطاقات البالغ عددها 48 في هذه المجموعة.
فتح الحزمة
k this deck
26
A class has 20 men and 10 women. The ratio of women to men is
A) 2 to 1
B) 1 to 2
C) 20%
D) .2
A) 2 to 1
B) 1 to 2
C) 20%
D) .2
فتح الحزمة
افتح القفل للوصول البطاقات البالغ عددها 48 في هذه المجموعة.
فتح الحزمة
k this deck
27
The crude birth rate of a city that has 250 births in a year and a population of 7500 would be found by using which of the following?
A) crude birth rate = (250/7500) x 1000
B) crude birth rate = 7500/250
C) crude birth rate = (1000/7500) x 250
D) crude birth rate = (250/1000) x 7500
A) crude birth rate = (250/7500) x 1000
B) crude birth rate = 7500/250
C) crude birth rate = (1000/7500) x 250
D) crude birth rate = (250/1000) x 7500
فتح الحزمة
افتح القفل للوصول البطاقات البالغ عددها 48 في هذه المجموعة.
فتح الحزمة
k this deck
28
In Table 2, which community has the higher proportion of Independents?
A) Community A
B) Community B
C) Neither
D) This proportion can't be determined from the information given.
فتح الحزمة
افتح القفل للوصول البطاقات البالغ عددها 48 في هذه المجموعة.
فتح الحزمة
k this deck
29
A possible problem with open-ended or unequal intervals is that they
A) do not permit the computation of midpoints
B) are useful only for nominal-level variables
C) can be used only with variables that have few scores
D) cannot be used for interval-ratio level variables
A) do not permit the computation of midpoints
B) are useful only for nominal-level variables
C) can be used only with variables that have few scores
D) cannot be used for interval-ratio level variables
فتح الحزمة
افتح القفل للوصول البطاقات البالغ عددها 48 في هذه المجموعة.
فتح الحزمة
k this deck
30
The ratio of men to women in a karate class is 3.3:1. If there are 100 women, how many men are there?
A) 33
B) 66
C) 133
D) 330
A) 33
B) 66
C) 133
D) 330
فتح الحزمة
افتح القفل للوصول البطاقات البالغ عددها 48 في هذه المجموعة.
فتح الحزمة
k this deck
31
City A (population = 1567 people) had 34 auto thefts last year. City B (population = 34,567) had 40 auto thefts in the same time period and City C (population = 156,980) had 70 auto thefts. Which city had the highest RATE of auto theft?
A) City A
B) City B
C) City C
D) More information is needed to answer this question.
A) City A
B) City B
C) City C
D) More information is needed to answer this question.
فتح الحزمة
افتح القفل للوصول البطاقات البالغ عددها 48 في هذه المجموعة.
فتح الحزمة
k this deck
32
According to the text book, the rate of traffic fatalities in the United States
A) fell between 1994 and 2011
B) rose dramatically between 1994 and 2011
C) rose between 1980 and 2000 and then fell
D) fell between 1980 and 2000 and then rose
A) fell between 1994 and 2011
B) rose dramatically between 1994 and 2011
C) rose between 1980 and 2000 and then fell
D) fell between 1980 and 2000 and then rose
فتح الحزمة
افتح القفل للوصول البطاقات البالغ عددها 48 في هذه المجموعة.
فتح الحزمة
k this deck
33
In Table 2, what percentage of Community A are Republicans?
A) (103/264) x 100 = 39.02
B) (103/17) x 100 = 605.88
C) (264/328) x 100 = 80.49
D) (103/135) x 100 = 76.30
فتح الحزمة
افتح القفل للوصول البطاقات البالغ عددها 48 في هذه المجموعة.
فتح الحزمة
k this deck
34
A small town of 1,709 residents had one homicide in the past year. The homicide rate for this town
A) cannot be determined from the information given
B) is (1/1709) x 100,000
C) is rising
D) is (1709:1) x 1,000
A) cannot be determined from the information given
B) is (1/1709) x 100,000
C) is rising
D) is (1709:1) x 1,000
فتح الحزمة
افتح القفل للوصول البطاقات البالغ عددها 48 في هذه المجموعة.
فتح الحزمة
k this deck
35
The homicide rate for a city is reported as 23.89. This means that
A) for every homicide, there were 23.89 victims
B) For every 100,000 people in the population there were 23.89 homicides
C) The homicide rate is rising
D) There was an average of 23.89 homicides each month
A) for every homicide, there were 23.89 victims
B) For every 100,000 people in the population there were 23.89 homicides
C) The homicide rate is rising
D) There was an average of 23.89 homicides each month
فتح الحزمة
افتح القفل للوصول البطاقات البالغ عددها 48 في هذه المجموعة.
فتح الحزمة
k this deck
36
A police department reports that the number of reported rapes in their jurisdiction increased by 100% over the past decade. This means that the number of reported rapes today is
A) double the number 10 years ago
B) actually about the same as 10 years ago
C) equal to the number 10 years ago plus 50%
D) triple the number 10 years ago
A) double the number 10 years ago
B) actually about the same as 10 years ago
C) equal to the number 10 years ago plus 50%
D) triple the number 10 years ago
فتح الحزمة
افتح القفل للوصول البطاقات البالغ عددها 48 في هذه المجموعة.
فتح الحزمة
k this deck
37
In Table 2, what is the ratio of Independents to Socialists in Community A?
A) 15:11
B) 17:9
C) 9:17
D) 17:264
فتح الحزمة
افتح القفل للوصول البطاقات البالغ عددها 48 في هذه المجموعة.
فتح الحزمة
k this deck
38
In Table 2, what is the ratio of Socialists to Democrats in Community B?
A) 11:21
B) 11:64
C) 64:11
D) 9:11
فتح الحزمة
افتح القفل للوصول البطاقات البالغ عددها 48 في هذه المجموعة.
فتح الحزمة
k this deck
39
A city of 1567 people had 34 auto thefts last year. The auto theft rate for this city
A) cannot be determined from the information given
B) is falling
C) is (34/1567) x 100,000
D) is (100,000 x 1567)/34
A) cannot be determined from the information given
B) is falling
C) is (34/1567) x 100,000
D) is (100,000 x 1567)/34
فتح الحزمة
افتح القفل للوصول البطاقات البالغ عددها 48 في هذه المجموعة.
فتح الحزمة
k this deck
40
In Table 2, what percentage of Democrats lives in community B?
A) (21 / 64) x 100 = 32.8
B) (21/328) x 100 = 6.4
C) (21/156) x 100 = 13.5
D) (64/264) x 100 = 24.2
فتح الحزمة
افتح القفل للوصول البطاقات البالغ عددها 48 في هذه المجموعة.
فتح الحزمة
k this deck
41
According to the report discussed in the text, about what percentage of high school students have used cigarettes, alcohol, marijuana, or cocaine at least once?
A) 100%
B) 75%
C) 25%
D) 10%
A) 100%
B) 75%
C) 25%
D) 10%
فتح الحزمة
افتح القفل للوصول البطاقات البالغ عددها 48 في هذه المجموعة.
فتح الحزمة
k this deck
42
A researcher wants to visually display the U.S. divorce rate (an interval-ratio level variable) for the last 50 years. An appropriate format would be
A) a line chart or histogram
B) only a histogram would work in this situation
C) a pie chart
D) none of the above. Data in the form of rate should never be displayed in a chart or graph.
A) a line chart or histogram
B) only a histogram would work in this situation
C) a pie chart
D) none of the above. Data in the form of rate should never be displayed in a chart or graph.
فتح الحزمة
افتح القفل للوصول البطاقات البالغ عددها 48 في هذه المجموعة.
فتح الحزمة
k this deck
43
Pie charts show the frequency distribution of
A) one variable
B) two variables
C) three or more variables
D) any of the above
A) one variable
B) two variables
C) three or more variables
D) any of the above
فتح الحزمة
افتح القفل للوصول البطاقات البالغ عددها 48 في هذه المجموعة.
فتح الحزمة
k this deck
44
For a single variable at the interval-ratio level, an appropriate graph would be
A) a pie chart
B) a histogram
C) a bivariate table
D) none of the above. Graphs are never used for interval-ratio level variables
A) a pie chart
B) a histogram
C) a bivariate table
D) none of the above. Graphs are never used for interval-ratio level variables
فتح الحزمة
افتح القفل للوصول البطاقات البالغ عددها 48 في هذه المجموعة.
فتح الحزمة
k this deck
45
A line chart or frequency polygon is based on
A) the upper limits of each interval
B) the lower limits of each interval
C) the midpoint of each interval
D) any limit which the researcher selects
A) the upper limits of each interval
B) the lower limits of each interval
C) the midpoint of each interval
D) any limit which the researcher selects
فتح الحزمة
افتح القفل للوصول البطاقات البالغ عددها 48 في هذه المجموعة.
فتح الحزمة
k this deck
46
Histograms and line charts or frequency polygons are used with data measured at the
A) nominal level
B) ordinal level
C) interval-ratio level
D) any level
A) nominal level
B) ordinal level
C) interval-ratio level
D) any level
فتح الحزمة
افتح القفل للوصول البطاقات البالغ عددها 48 في هذه المجموعة.
فتح الحزمة
k this deck
47
According to information presented in the text, the US divorce rate
A) has generally fallen since the early 1980s
B) has been rising steadily since the 1950s
C) has been basically unchangedsince the 1970s
D) rose until the 1990s and then began to fall sharply
A) has generally fallen since the early 1980s
B) has been rising steadily since the 1950s
C) has been basically unchangedsince the 1970s
D) rose until the 1990s and then began to fall sharply
فتح الحزمة
افتح القفل للوصول البطاقات البالغ عددها 48 في هذه المجموعة.
فتح الحزمة
k this deck
48
For a single variable measured at the nominal level, an appropriate graph would be a
A) pie chart
B) histogram
C) frequency polygon
D) bivariate table
A) pie chart
B) histogram
C) frequency polygon
D) bivariate table
فتح الحزمة
افتح القفل للوصول البطاقات البالغ عددها 48 في هذه المجموعة.
فتح الحزمة
k this deck
فتح الحزمة
افتح القفل للوصول البطاقات البالغ عددها 48 في هذه المجموعة.


