Deck 7: Continuous Probability Distributions
ملء الشاشة (f)
سؤال
سؤال
سؤال
سؤال
سؤال
سؤال
سؤال
The Minitab descriptive statistics display from a data set is shown here:
Using the IQR/s criteria, do these data appear to be normally distributed?
A) Yes, the data appear to be normally distributed because IQR/s is very close to the standard normal value of 0.6.
B) No, the data do not appear to be normally distributed because IQR/s is not very close to the standard normal value of 0.6.
C) Yes, the data appear to be normally distributed because IQR/s is very close to the standard normal value of 1.3.
D) No, the data do not appear to be normally distributed because IQR/s is not very close to the standard normal value of 1.3.
سؤال
سؤال
سؤال
سؤال
سؤال
سؤال
سؤال
سؤال
سؤال
سؤال
سؤال
The plots shown here are normal probability plots for random samples of 65 healthy male and 65 healthy female body temperatures. 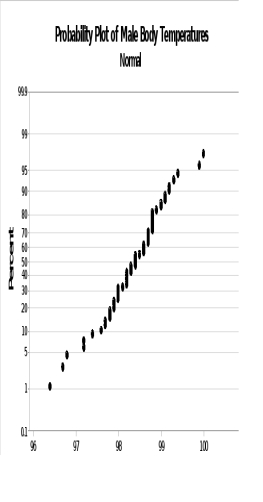
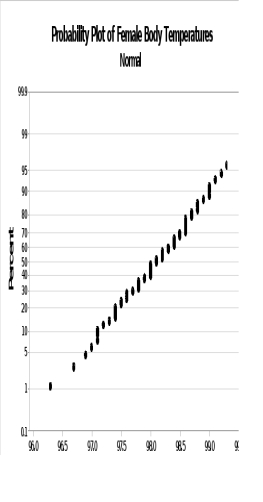 Which group is more likely to be normally distributed?
A) The males are more likely to be normal because their plot does not appear to be a straight line.
B) The females are more likely to be normal because their plot does not appear to be a straight line.
C) The females are more likely to be normal because their plot does appear to be a straight line.
D) The two groups appear to be equally normally distributed.
Which group is more likely to be normally distributed?A) The males are more likely to be normal because their plot does not appear to be a straight line.
B) The females are more likely to be normal because their plot does not appear to be a straight line.
C) The females are more likely to be normal because their plot does appear to be a straight line.
D) The two groups appear to be equally normally distributed.
سؤال
سؤال
سؤال
سؤال
سؤال
سؤال
سؤال
سؤال
سؤال
سؤال
سؤال
سؤال
سؤال
سؤال
سؤال
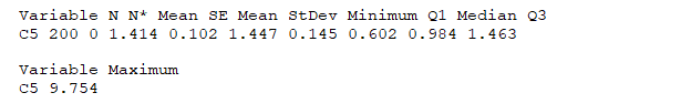
The descriptive statistics for the age differences (husband age - wife age) from a sample of 100 married couples are shown here.  Based on these statistics, do the data appear to be normally distributed?
A) Yes, because the mean and the median are roughly the same.
B) Yes, because the value of IQR/s is roughly 1.3.
C) No, because the value of IQR/s is less than 1.3.
D) No, because the mean and the median are the same.
Based on these statistics, do the data appear to be normally distributed?A) Yes, because the mean and the median are roughly the same.
B) Yes, because the value of IQR/s is roughly 1.3.
C) No, because the value of IQR/s is less than 1.3.
D) No, because the mean and the median are the same.
سؤال
سؤال
سؤال
سؤال
سؤال
سؤال
سؤال
سؤال
سؤال
سؤال
سؤال
Suppose the cumulative distribution function (CDF) of continuous random variable X is defined as follows: 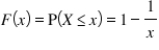 where 1 ≤ x < ∞.What is P(1.5 ≤ X ≤ 2)?
A) 0.3333
B) 0.5000
C) 0.1667
D) 0.2500
where 1 ≤ x < ∞.What is P(1.5 ≤ X ≤ 2)?A) 0.3333
B) 0.5000
C) 0.1667
D) 0.2500
سؤال
Suppose the cumulative distribution function (CDF) of continuous random variable X is defined as follows: 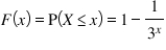 where x ≥ 0.What is P(X > 1.25)?
A) 0.7467
B) 0.5833
C) 0.2533
D) 0.7333
where x ≥ 0.What is P(X > 1.25)?A) 0.7467
B) 0.5833
C) 0.2533
D) 0.7333

فتح الحزمة
قم بالتسجيل لفتح البطاقات في هذه المجموعة!
Unlock Deck
Unlock Deck
1/45
العب
ملء الشاشة (f)
Deck 7: Continuous Probability Distributions
1
Which of the following statements is true with regard to continuous random variables?
A) They can assume values at all points on an interval with no breaks between possible values.
B) They are defined at specific values.
C) Their probability density functions are symmetric.
D) Their probability density functions define the probability that the random variable X equals a specific value x.
They can assume values at all points on an interval with no breaks between possible values.
2
The amount of time a person waits for a cab in Manhattan is uniformly distributed.If the maximum time a person waits for a cab in Manhattan is 5 minutes and the minimum is 30 seconds, what is the average wait time for a cab in Manhattan?
A) 2.75 minutes
B) 17.5 minutes
C) 2.25 minutes
D) 2.50 minutes
A) 2.75 minutes
B) 17.5 minutes
C) 2.25 minutes
D) 2.50 minutes
2.75 minutes
3
A child psychologist believes that the results from a standardized behavior test fail to hold to the assumption of normality.She samples 250 results from the test to evaluate normality.The average value of the 250 samples is 105.25, with a standard deviation of 21.2.She finds that 30% of the scores are greater than 168.What conclusion should she draw based solely on this finding?
A) The data could be normal because we expect 30% of the readings from this data set to be greater than 168.
B) The data are most likely not normal because drastically fewer than 30% of the observations should be this high if the data set were normal.
C) The data are most likely not normal because more than 30% of the observations should be this high if the data set were normal.
D) The determination of normality cannot reliably be made from this information.
The data are most likely not normal because drastically fewer than 30% of the observations should be this high if the data set were normal.
4
Let X = the time (in minutes) that a postal clerk spends with her customers.This time is known to have an exponential distribution with an average of 4 minutes.What is the variance for this distribution?
A) 16
B) 0.25
C) 0.0625
D) 0.025
A) 16
B) 0.25
C) 0.0625
D) 0.025
فتح الحزمة
افتح القفل للوصول البطاقات البالغ عددها 45 في هذه المجموعة.
فتح الحزمة
k this deck
5
Which of the following statements is true with regard to continuous random variables?
A) The height of the curve shows the probability of an event.
B) The probability of an event A occurring is always equal to one.
C) Probabilities of events are determined from areas under the curve.
D) The probability distribution is always mound-shaped.
A) The height of the curve shows the probability of an event.
B) The probability of an event A occurring is always equal to one.
C) Probabilities of events are determined from areas under the curve.
D) The probability distribution is always mound-shaped.
فتح الحزمة
افتح القفل للوصول البطاقات البالغ عددها 45 في هذه المجموعة.
فتح الحزمة
k this deck
6
X follows a normal distribution with a mean of 1112.5 and a variance of 144.2.Standardize an X value of 1000.
A) -84.32
B) -0.2177
C) -0.78
D) -9.37
A) -84.32
B) -0.2177
C) -0.78
D) -9.37
فتح الحزمة
افتح القفل للوصول البطاقات البالغ عددها 45 في هذه المجموعة.
فتح الحزمة
k this deck
7
The Minitab descriptive statistics display from a data set is shown here:
Using the IQR/s criteria, do these data appear to be normally distributed?
A) Yes, the data appear to be normally distributed because IQR/s is very close to the standard normal value of 0.6.
B) No, the data do not appear to be normally distributed because IQR/s is not very close to the standard normal value of 0.6.
C) Yes, the data appear to be normally distributed because IQR/s is very close to the standard normal value of 1.3.
D) No, the data do not appear to be normally distributed because IQR/s is not very close to the standard normal value of 1.3.
Using the IQR/s criteria, do these data appear to be normally distributed?
A) Yes, the data appear to be normally distributed because IQR/s is very close to the standard normal value of 0.6.
B) No, the data do not appear to be normally distributed because IQR/s is not very close to the standard normal value of 0.6.
C) Yes, the data appear to be normally distributed because IQR/s is very close to the standard normal value of 1.3.
D) No, the data do not appear to be normally distributed because IQR/s is not very close to the standard normal value of 1.3.
فتح الحزمة
افتح القفل للوصول البطاقات البالغ عددها 45 في هذه المجموعة.
فتح الحزمة
k this deck
8
The higher the peak of a normal distribution,
A) the smaller the standard deviation σ.
B) the larger the standard deviation σ.
C) the smaller the value of the mean μ.
D) the larger the value of the mean μ.
A) the smaller the standard deviation σ.
B) the larger the standard deviation σ.
C) the smaller the value of the mean μ.
D) the larger the value of the mean μ.
فتح الحزمة
افتح القفل للوصول البطاقات البالغ عددها 45 في هذه المجموعة.
فتح الحزمة
k this deck
9
The maximum value for any cumulative probability distribution function is always
A) = 1.
B) > 1.
C) < 1.
D) ≈ 1.
A) = 1.
B) > 1.
C) < 1.
D) ≈ 1.
فتح الحزمة
افتح القفل للوصول البطاقات البالغ عددها 45 في هذه المجموعة.
فتح الحزمة
k this deck
10
For any continuous random variable X, if both a and b are fixed real numbers such that a < b, then P(a ≤ X ≤ b) will always be:
A) P(X < b).
B) P(X ≤ b).
C) P(X ≤ b) - P(X < a)
D) Both A and B are correct.
A) P(X < b).
B) P(X ≤ b).
C) P(X ≤ b) - P(X < a)
D) Both A and B are correct.
فتح الحزمة
افتح القفل للوصول البطاقات البالغ عددها 45 في هذه المجموعة.
فتح الحزمة
k this deck
11
A major producer of incandescent light bulbs wishes to model the amount of time incandescent bulbs manufactured at a specific plant will last.The company uses an exponential random variable to model bulb life.If random variable X, which represents the lifetime of these incandescent bulbs, is exponentially distributed with λ = 0.0012 (corresponding to measurements in hours), what is the modeled mean lifetime of these bulbs?
A) 1200 hours
B) 833.3 hours
C) 694,444 hours
D) 921.2 hours
A) 1200 hours
B) 833.3 hours
C) 694,444 hours
D) 921.2 hours
فتح الحزمة
افتح القفل للوصول البطاقات البالغ عددها 45 في هذه المجموعة.
فتح الحزمة
k this deck
12
Most production model hybrid cars use a large battery as the core component of their power system.The battery lifetime of a particular hybrid are follows an exponential distribution with a mean lifetime of 8.62 years.What is the probability that one of these hybrid cars will have a battery that will last between 8 and 10 years?
A) 0.3953
B) 0.0819
C) 0.6047
D) 0.1160
A) 0.3953
B) 0.0819
C) 0.6047
D) 0.1160
فتح الحزمة
افتح القفل للوصول البطاقات البالغ عددها 45 في هذه المجموعة.
فتح الحزمة
k this deck
13
A study of college dropouts models the number of undergraduate credits a student successfully earns prior to quitting using an exponential random variable.If the observed average number of credits earned is 22.5, what proportion of students drop out with more than 100 credits, assuming an exponential random variable is appropriate here?
A) 0.0117
B) 0.0392
C) 0.9802
D) 0.2250
A) 0.0117
B) 0.0392
C) 0.9802
D) 0.2250
فتح الحزمة
افتح القفل للوصول البطاقات البالغ عددها 45 في هذه المجموعة.
فتح الحزمة
k this deck
14
The memoryless property of the exponential distribution describes the fact that:
A) the equations associated with the exponential distribution are so difficult that rarely can anyone remember how to calculate probability without help.
B) at any point in time, the exponential random variable forgets or ignores what happened earlier; the future is independent of the past.
C) the probability associated with any one span of time is dependent upon the span of time that preceded it.
D) the exponential distribution is the only distribution that exhibits an inverse relationship concerning the past.In other words, the more time that precedes an event, the greater the probability of present occurrence.
فتح الحزمة
افتح القفل للوصول البطاقات البالغ عددها 45 في هذه المجموعة.
فتح الحزمة
k this deck
15
Let X = the time (in minutes) that a postal clerk spends with her customers.This time is known to have an exponential distribution with an average of 4 minutes.What is the probability that the clerk spends 4 to 5 minutes with a randomly selected customer?
A) 0.7135
B) 0.6321
C) 0.3456
D) 0.0814
A) 0.7135
B) 0.6321
C) 0.3456
D) 0.0814
فتح الحزمة
افتح القفل للوصول البطاقات البالغ عددها 45 في هذه المجموعة.
فتح الحزمة
k this deck
16
If a random variable X is normally distributed with mean μ = 0.45 and standard deviation σ = 0.40, then what is P(X ≥ 0.75)?
A) 0.7500
B) 0.7734
C) 0.2266
D) 0.2734
A) 0.7500
B) 0.7734
C) 0.2266
D) 0.2734
فتح الحزمة
افتح القفل للوصول البطاقات البالغ عددها 45 في هذه المجموعة.
فتح الحزمة
k this deck
17
Seismologists have discovered a thermal disturbance in a remote location near the polar ice caps.Since the disturbance appears to occur randomly, they model the event using an exponential random variable X.If the mean time between occurrences is 52.25 hours, what is the probability that there will be at least 24 hours between occurrences?
A) 0.0190
B) 0.3683
C) 1.000
D) 0.6317
A) 0.0190
B) 0.3683
C) 1.000
D) 0.6317
فتح الحزمة
افتح القفل للوصول البطاقات البالغ عددها 45 في هذه المجموعة.
فتح الحزمة
k this deck
18
The plots shown here are normal probability plots for random samples of 65 healthy male and 65 healthy female body temperatures. Which group is more likely to be normally distributed?
A) The males are more likely to be normal because their plot does not appear to be a straight line.
B) The females are more likely to be normal because their plot does not appear to be a straight line.
C) The females are more likely to be normal because their plot does appear to be a straight line.
D) The two groups appear to be equally normally distributed.
Which group is more likely to be normally distributed?A) The males are more likely to be normal because their plot does not appear to be a straight line.
B) The females are more likely to be normal because their plot does not appear to be a straight line.
C) The females are more likely to be normal because their plot does appear to be a straight line.
D) The two groups appear to be equally normally distributed.
فتح الحزمة
افتح القفل للوصول البطاقات البالغ عددها 45 في هذه المجموعة.
فتح الحزمة
k this deck
19
A density curve is a:
A) mathematical device that adjusts (equalizes) probability across the range of data.
B) smooth curve that visually displays the distribution of probability for a continuous random variable.
C) visual display that shows the gradual transition of probability that is adjusted to equalize a data set.
D) tool of descriptive statistics that displays only the region of a data set that has a high concentration of readings.
فتح الحزمة
افتح القفل للوصول البطاقات البالغ عددها 45 في هذه المجموعة.
فتح الحزمة
k this deck
20
Although the binomial distribution is discrete, in many cases it can be modeled using a normal distribution.If X is binomial with mean = μx and standard deviation = σx, then we can define a new random variable Y that is normal with the same mean and same standard deviation.In this case under certain assumptions,P(X ≤ x) ≈ P(Y ≤ x).This relationship is most useful when X has a large number of trials.If X is binomial with a mean of 25 and a standard deviation of 4.33 (n = 100, p = 0.25), what is P(X ≤ 23) using the normal approximation discussed here?
A) 0.3228
B) 0.4300
C) 0.4500
D) 0.6772
A) 0.3228
B) 0.4300
C) 0.4500
D) 0.6772
فتح الحزمة
افتح القفل للوصول البطاقات البالغ عددها 45 في هذه المجموعة.
فتح الحزمة
k this deck
21
Variable N N* Mean SE Mean StDev Minimum Q1 Median Q3 C3 150 0 69.912 0.0798 0.977 67.625 69.175 69.948
Variable Maximum
C3 72.339
If the data set presented here were normal, which value would most likely fall into the third quartile?
A) 72.84
B) 70.15
C) 69.76
D) 70.45
Variable Maximum
C3 72.339
If the data set presented here were normal, which value would most likely fall into the third quartile?
A) 72.84
B) 70.15
C) 69.76
D) 70.45
فتح الحزمة
افتح القفل للوصول البطاقات البالغ عددها 45 في هذه المجموعة.
فتح الحزمة
k this deck
22
Metro buses are scheduled to arrive at each stop every 30 minutes.If the time a person waits at a bus stop is uniformly distributed and the maximum possible wait time for a bus is 30 minutes, what is the probability that you will wait more than 25 minutes for a bus?
A) 0.1667
B) 0.8333
C) 0.2000
D) 0.1333
A) 0.1667
B) 0.8333
C) 0.2000
D) 0.1333
فتح الحزمة
افتح القفل للوصول البطاقات البالغ عددها 45 في هذه المجموعة.
فتح الحزمة
k this deck
23
Spinal fusion surgery has become a popular and effective option for patients suffering from nerve pain caused by irregularities in the spinal disks.The effectiveness of the surgery varies from patient to patient.If the pain improvement post-surgery follows a normal distribution with a mean improvement of 2.25 and a standard deviation of 1.2, what is the probability that a randomly selected patient who undergoes fusion experiences a pain improvement between 0 and 2?
A) 0.3867
B) 0.4168
C) 0.2100
D) 0.0301
A) 0.3867
B) 0.4168
C) 0.2100
D) 0.0301
فتح الحزمة
افتح القفل للوصول البطاقات البالغ عددها 45 في هذه المجموعة.
فتح الحزمة
k this deck
24
If X is a normal random variable with mean μ, standard deviation 0.15, and P(X < 2.10) = 0.025, what is the value of μ?
A) 2.394
B) 2.104
C) 2.096
D) 1.806
A) 2.394
B) 2.104
C) 2.096
D) 1.806
فتح الحزمة
افتح القفل للوصول البطاقات البالغ عددها 45 في هذه المجموعة.
فتح الحزمة
k this deck
25
Large electrical generation companies use so-called peaking generators to carry additional load when demand for electrical power is particularly high.Running these generators at very low loads is bad for them for a number of reasons.A particular peaking generator carries an average load of 20 MW, with standard deviation of 4.23 MW.If this generator's low load threshold is 10 MW, what percentage of time is this generator being run at a low load condition?
A) 0.91%
B) 2.36%
C) 99.09%
D) 1%
A) 0.91%
B) 2.36%
C) 99.09%
D) 1%
فتح الحزمة
افتح القفل للوصول البطاقات البالغ عددها 45 في هذه المجموعة.
فتح الحزمة
k this deck
26
Let X be a continuous random variable and let c be a constant.Which of the following statements is true?
A) The probability that X assumes a value in the interval X1 to X2 is the area under the probability density function between X1 and X2.
B) P(X = c) = 0.
C) P(X ≤ c) = P(X < c).
D) All of these statements are true.
A) The probability that X assumes a value in the interval X1 to X2 is the area under the probability density function between X1 and X2.
B) P(X = c) = 0.
C) P(X ≤ c) = P(X < c).
D) All of these statements are true.
فتح الحزمة
افتح القفل للوصول البطاقات البالغ عددها 45 في هذه المجموعة.
فتح الحزمة
k this deck
27
A sample of recorded dog barks is analyzed for decibel intensity.The mean intensity is 62.25 decibels, with a variance of 4.45.If this data set is normally distributed, we would expect approximately 95% of the barks to be within what range?
A) (58.03, 66.47)
B) (60.16, 64.36)
C) (55.92, 66.47)
D) (53.35, 71.15)
A) (58.03, 66.47)
B) (60.16, 64.36)
C) (55.92, 66.47)
D) (53.35, 71.15)
فتح الحزمة
افتح القفل للوصول البطاقات البالغ عددها 45 في هذه المجموعة.
فتح الحزمة
k this deck
28
Heights of children entering kindergarten are normally distributed with a mean height of 103 cm and a standard deviation of 1.27 cm.Sixty-seven percent of the children entering kindergarten are taller than:
A) 103 cm.
B) 0.44 cm.
C) 103.56 cm.
D) 102.44 cm.
A) 103 cm.
B) 0.44 cm.
C) 103.56 cm.
D) 102.44 cm.
فتح الحزمة
افتح القفل للوصول البطاقات البالغ عددها 45 في هذه المجموعة.
فتح الحزمة
k this deck
29
The return on investment for a particular security has historically followed a normal distribution with a mean profit of 4.75% and standard deviation of 1.5%.If the historical pattern holds, what is the probability of investing in this security and seeing greater than a 6% return?
A) 0.7967
B) 0.8333
C) 0.2033
D) 0.1666
A) 0.7967
B) 0.8333
C) 0.2033
D) 0.1666
فتح الحزمة
افتح القفل للوصول البطاقات البالغ عددها 45 في هذه المجموعة.
فتح الحزمة
k this deck
30
Quality control engineers create acceptable boundaries for variability within the processes they monitor.They determine that the acceptable boundary for a certain heat exchange process at a gasoline refinery must be set such that under normal operating conditions the threshold would be exceeded only 1% of the time.Under normal operating conditions, the process varies according to a normal distribution, with mean temperature of 231°C and standard deviation of 2.5°C.What upper temperature should they set so that the process will normally exceed the temperature 0.51% of the time?
A) 257.00°C
B) 237.68°C
C) 224.58°C
D) 237.43°C
A) 257.00°C
B) 237.68°C
C) 224.58°C
D) 237.43°C
فتح الحزمة
افتح القفل للوصول البطاقات البالغ عددها 45 في هذه المجموعة.
فتح الحزمة
k this deck
31
If the heights of NBA players are normally distributed with a mean height of 73.5 inches and a standard deviation of 2.2 inches, what is the probability of randomly selecting an NBA player who is between 72 and 73 inches tall?
A) 0.1624
B) 0.5910
C) 0.4500
D) 0.4090
A) 0.1624
B) 0.5910
C) 0.4500
D) 0.4090
فتح الحزمة
افتح القفل للوصول البطاقات البالغ عددها 45 في هذه المجموعة.
فتح الحزمة
k this deck
32
Assume that the lifetime (in hours) of a particular car fan can be modeled with an exponential distribution with parameter 0.0003.Find the proportion of fans that will last for at least 10,000 hours.
A) 0.0302
B) 0.0498
C) 0.0357
D) 0.95012
A) 0.0302
B) 0.0498
C) 0.0357
D) 0.95012
فتح الحزمة
افتح القفل للوصول البطاقات البالغ عددها 45 في هذه المجموعة.
فتح الحزمة
k this deck
33
The descriptive statistics for the age differences (husband age - wife age) from a sample of 100 married couples are shown here. Based on these statistics, do the data appear to be normally distributed?
A) Yes, because the mean and the median are roughly the same.
B) Yes, because the value of IQR/s is roughly 1.3.
C) No, because the value of IQR/s is less than 1.3.
D) No, because the mean and the median are the same.
Based on these statistics, do the data appear to be normally distributed?A) Yes, because the mean and the median are roughly the same.
B) Yes, because the value of IQR/s is roughly 1.3.
C) No, because the value of IQR/s is less than 1.3.
D) No, because the mean and the median are the same.
فتح الحزمة
افتح القفل للوصول البطاقات البالغ عددها 45 في هذه المجموعة.
فتح الحزمة
k this deck
34
For any continuous random variable X, if a is any real fixed number, then P(X ≥ a) is always:
A) 1 - P(X< a).
B) 1 - P(X ≤ a).
C) P(X< a).
D) Both A and B are correct.
A) 1 - P(X< a).
B) 1 - P(X ≤ a).
C) P(X< a).
D) Both A and B are correct.
فتح الحزمة
افتح القفل للوصول البطاقات البالغ عددها 45 في هذه المجموعة.
فتح الحزمة
k this deck
35
The smiling times (in seconds) of an 8-week-old baby can be modeled with a uniform distribution with a = 0 and b = 23 seconds.What is the probability that a randomly chosen 8-week-old baby smiles between 2 and 18 seconds?
A) 0.7826
B) 0.6956
C) 0.8696
D) 0.0870
A) 0.7826
B) 0.6956
C) 0.8696
D) 0.0870
فتح الحزمة
افتح القفل للوصول البطاقات البالغ عددها 45 في هذه المجموعة.
فتح الحزمة
k this deck
36
Assume Z is a standard normal random variable with P(-z < Z < z) = 0.8764.What is z?
A) 0.3764
B) 1.16
C) 1.54
D) 3.08
A) 0.3764
B) 1.16
C) 1.54
D) 3.08
فتح الحزمة
افتح القفل للوصول البطاقات البالغ عددها 45 في هذه المجموعة.
فتح الحزمة
k this deck
37
Variable N N* Mean SE Mean StDev Minimum Q1 Median Q3 C4 150 0 64.940 0.0825 1.010 62.722 65.679
Variable Maximum
C4 67.445
If this data set were normal, which value would most likely fall into the first quartile?
A) 63.93
B) 65.073
C) 64.366
D) 63.730
Variable Maximum
C4 67.445
If this data set were normal, which value would most likely fall into the first quartile?
A) 63.93
B) 65.073
C) 64.366
D) 63.730
فتح الحزمة
افتح القفل للوصول البطاقات البالغ عددها 45 في هذه المجموعة.
فتح الحزمة
k this deck
38
Let X = the time (in minutes) that a postal clerk spends with her customers.This time is known to have an exponential distribution with an average of 4 minutes.What is the parameter λ for this random variable?
A) 4
B) 2
C) 0.5
D) 0.25
A) 4
B) 2
C) 0.5
D) 0.25
فتح الحزمة
افتح القفل للوصول البطاقات البالغ عددها 45 في هذه المجموعة.
فتح الحزمة
k this deck
39
The speed at which an automated assembly line produces a product follows a normal distribution, with a mean production time of 32.20 seconds and a standard deviation of 1.05 seconds.What is the probability that a product requires more than 34 seconds to produce?
A) 0.0436
B) 0.1710
C) 0.9564
D) 0.0038
A) 0.0436
B) 0.1710
C) 0.9564
D) 0.0038
فتح الحزمة
افتح القفل للوصول البطاقات البالغ عددها 45 في هذه المجموعة.
فتح الحزمة
k this deck
40
X is a normally distributed random variable with μx = 125 and σx = 12.5.What is P(X ≥ 110)?
A) 0.1151
B) 0.3849
C) 0.8849
D) 0.6151
A) 0.1151
B) 0.3849
C) 0.8849
D) 0.6151
فتح الحزمة
افتح القفل للوصول البطاقات البالغ عددها 45 في هذه المجموعة.
فتح الحزمة
k this deck
41
Any distribution whose mean value is equal to the median with first and third quartiles equidistant from them both is:
A) always normal.
B) always non-normal.
C) always symmetric.
D) always skewed.
A) always normal.
B) always non-normal.
C) always symmetric.
D) always skewed.
فتح الحزمة
افتح القفل للوصول البطاقات البالغ عددها 45 في هذه المجموعة.
فتح الحزمة
k this deck
42
What differentiates the standard normal distribution (Z) from any other arbitrary normal distribution?
A) The Z distribution has the least amount of variability of all normal distributions.
B) The Z distribution is the only normal distribution with a fixed real mean value.
C) The Z distribution has a mean value of 0 and a variance/standard deviation of 1.
D) The Z distribution has a mean value and variance that is defined, which is uncommon for the normal distribution.
فتح الحزمة
افتح القفل للوصول البطاقات البالغ عددها 45 في هذه المجموعة.
فتح الحزمة
k this deck
43
A team of marine researchers is investigating ocean life that lives in the Hadalpelagic Zone (more than 6000 m beneath the surface).In this zone it is believed that the average depth at which the strange creatures that live here dwell is 7000 m, with a standard deviation of 200 m.If the distribution of depths is normal, 1.07% of the life in this zone lives above:
A) 6520 m.
B) 6560 m.
C) 6540 m.
D) 6786 m.
A) 6520 m.
B) 6560 m.
C) 6540 m.
D) 6786 m.
فتح الحزمة
افتح القفل للوصول البطاقات البالغ عددها 45 في هذه المجموعة.
فتح الحزمة
k this deck
44
Suppose the cumulative distribution function (CDF) of continuous random variable X is defined as follows: where 1 ≤ x < ∞.What is P(1.5 ≤ X ≤ 2)?
A) 0.3333
B) 0.5000
C) 0.1667
D) 0.2500
where 1 ≤ x < ∞.What is P(1.5 ≤ X ≤ 2)?A) 0.3333
B) 0.5000
C) 0.1667
D) 0.2500
فتح الحزمة
افتح القفل للوصول البطاقات البالغ عددها 45 في هذه المجموعة.
فتح الحزمة
k this deck
45
Suppose the cumulative distribution function (CDF) of continuous random variable X is defined as follows: where x ≥ 0.What is P(X > 1.25)?
A) 0.7467
B) 0.5833
C) 0.2533
D) 0.7333
where x ≥ 0.What is P(X > 1.25)?A) 0.7467
B) 0.5833
C) 0.2533
D) 0.7333
فتح الحزمة
افتح القفل للوصول البطاقات البالغ عددها 45 في هذه المجموعة.
فتح الحزمة
k this deck
فتح الحزمة
افتح القفل للوصول البطاقات البالغ عددها 45 في هذه المجموعة.


