Deck 12: The Analysis of Categorical Data and Goodness-Of-Fit Tests
ملء الشاشة (f)
سؤال

سؤال

سؤال
سؤال
سؤال
سؤال
سؤال
سؤال
سؤال

فتح الحزمة
قم بالتسجيل لفتح البطاقات في هذه المجموعة!
Unlock Deck
Unlock Deck
1/9
العب
ملء الشاشة (f)
Deck 12: The Analysis of Categorical Data and Goodness-Of-Fit Tests
1
True
2
False
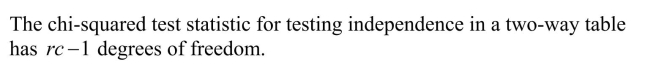
3
The formulas for the expected cell counts and degrees of freedom for the chi-squared test used to test whether the true category proportions of two or more populations are computed in the same way as for the chi-squared test of the independence of two variables.
True
4
In order to decide whether the observed data is compatible with the null hypothesis, the observed cell counts are compared to the cell counts that would be expected when the alternative hypothesis is true.
فتح الحزمة
افتح القفل للوصول البطاقات البالغ عددها 9 في هذه المجموعة.
فتح الحزمة
k this deck
5
فتح الحزمة
افتح القفل للوصول البطاقات البالغ عددها 9 في هذه المجموعة.
فتح الحزمة
k this deck
6
The row and column marginal totals provide information on the distribution of the observed values for each of the two variables defining the contingency table.
فتح الحزمة
افتح القفل للوصول البطاقات البالغ عددها 9 في هذه المجموعة.
فتح الحزمة
k this deck
7
فتح الحزمة
افتح القفل للوصول البطاقات البالغ عددها 9 في هذه المجموعة.
فتح الحزمة
k this deck
8
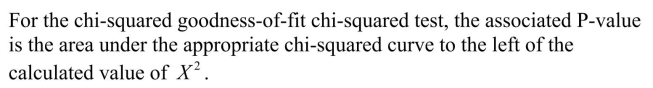
A chi-squared goodness-of-fit can be used to test hypotheses about the proportion of the population falling into each of the possible categories.
فتح الحزمة
افتح القفل للوصول البطاقات البالغ عددها 9 في هذه المجموعة.
فتح الحزمة
k this deck
9
The expected cell count for the row a and column b entry in a bivariate contingency table is equal to the product of the row a and column b marginal totals.
فتح الحزمة
افتح القفل للوصول البطاقات البالغ عددها 9 في هذه المجموعة.
فتح الحزمة
k this deck
فتح الحزمة
افتح القفل للوصول البطاقات البالغ عددها 9 في هذه المجموعة.


