Deck 12: Asking and Answering Questions About a Population Mean
ملء الشاشة (f)
سؤال
سؤال
A 
سؤال
سؤال

سؤال
سؤال
سؤال
سؤال
C 
سؤال
سؤال

سؤال

سؤال
C 
سؤال
A 
سؤال
سؤال
سؤال
سؤال
سؤال
سؤال
سؤال

سؤال
One indicator of the health of field mice is the length of their tails. The following
data on tail length (in mm) were gathered from a representative sample of field mice
near Fairfield, Iowa. A biologist would like to construct a 95% confidence interval
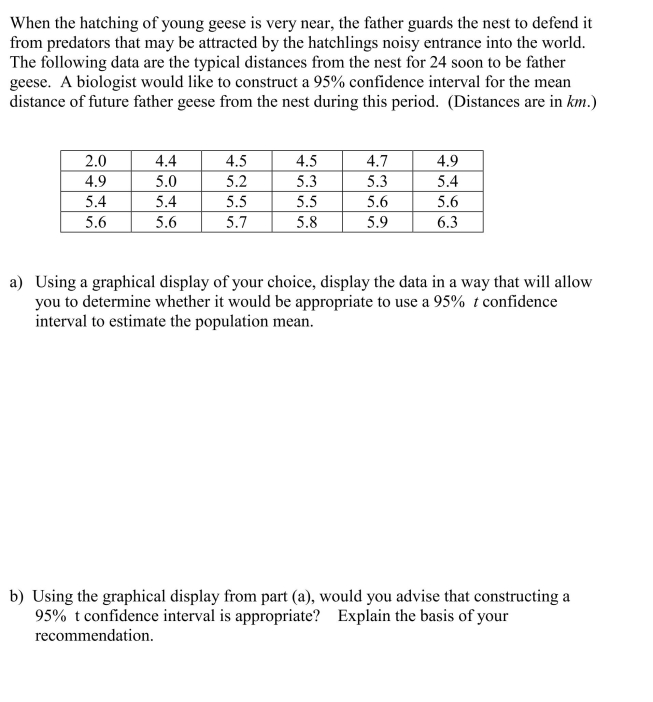
for the population mean tail length of the field mice near Fairfield.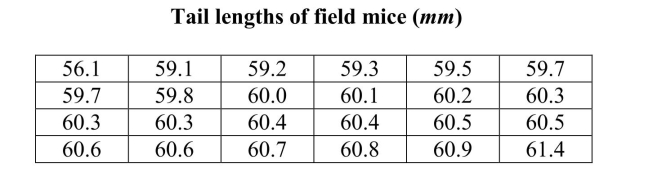 a) Using a graphical display of your choice, display the data in a way that will allow
you to determine whether it would be appropriate to use a t confidence interval to
estimate the population mean.
b) Using the graphical display from part (a), would you advise that constructing a t
confidence interval is appropriate? Explain the basis of your recommendation.
data on tail length (in mm) were gathered from a representative sample of field mice
near Fairfield, Iowa. A biologist would like to construct a 95% confidence interval
for the population mean tail length of the field mice near Fairfield.
a) Using a graphical display of your choice, display the data in a way that will allowyou to determine whether it would be appropriate to use a t confidence interval to
estimate the population mean.
b) Using the graphical display from part (a), would you advise that constructing a t
confidence interval is appropriate? Explain the basis of your recommendation.
سؤال
سؤال
Give as much information as you can about the P-value of a t-test in the following
situations: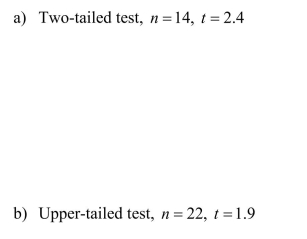
situations:
سؤال
Many national parks, wildlife refuges, and wilderness areas lie directly below designated
military air space. This raises issues of whether wildlife and loud jet noises are compatible.
In an effort to evaluate the effects of low-altitude jet-noise, researchers simulated these
noises for a representative sample of captive desert mule deer. Three minutes after the loud
noises were played, the heart rates (beats per minute) of these animals was measured, with
the following results: a) Calculate and interpret a 95% confidence interval for the mean heart rate 3 minutes after
loud jet noises.
b) The usual mean heart rate for desert mule deer is about 51.2 beats per minute. Does the
confidence interval in part (a) support the view that the loud jet noise has some lingering
effect on the heart rate of desert mule deer? Explain, using appropriate statistical
language.
military air space. This raises issues of whether wildlife and loud jet noises are compatible.
In an effort to evaluate the effects of low-altitude jet-noise, researchers simulated these
noises for a representative sample of captive desert mule deer. Three minutes after the loud
noises were played, the heart rates (beats per minute) of these animals was measured, with
the following results:
a) Calculate and interpret a 95% confidence interval for the mean heart rate 3 minutes afterloud jet noises.
b) The usual mean heart rate for desert mule deer is about 51.2 beats per minute. Does the
confidence interval in part (a) support the view that the loud jet noise has some lingering
effect on the heart rate of desert mule deer? Explain, using appropriate statistical
language.
سؤال
Give as much information as you can about the P-value of a t-test in the following
situations: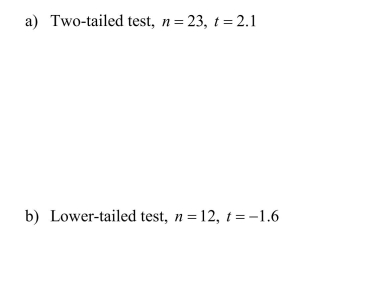
situations:
سؤال
Describe in a few sentences how each of the following affects the power of a test: 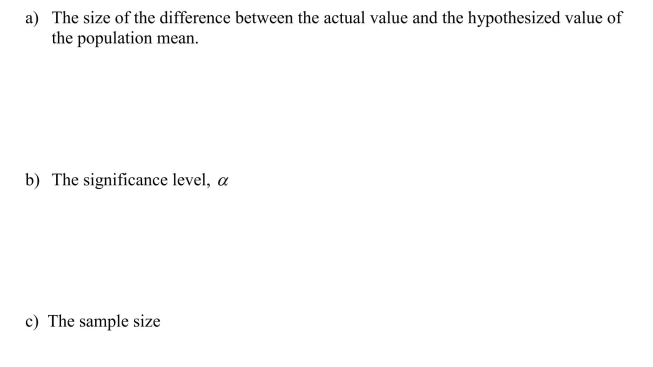
سؤال
A boat manufacturer claims that a particular boat model and motor combination will
burn less than 4.0 gallons of fuel per hour. Fuel consumption for a random sample of
10 similar boats was measured, resulting in the data below: A consumer group is interested in determining if there is convincing evidence that the
manufacturer's claim is correct.
a) What null and alternative hypotheses should the investigators use? In a few
sentences, justify your choice of the alternative hypothesis.
b) Using a graphic technique of your choice, show that the t-procedures are
appropriate to use with these data.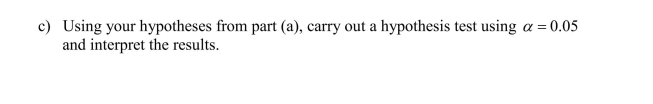 d) In the context of this study, describe a Type I and a Type II error.
burn less than 4.0 gallons of fuel per hour. Fuel consumption for a random sample of
10 similar boats was measured, resulting in the data below:
A consumer group is interested in determining if there is convincing evidence that themanufacturer's claim is correct.
a) What null and alternative hypotheses should the investigators use? In a few
sentences, justify your choice of the alternative hypothesis.
b) Using a graphic technique of your choice, show that the t-procedures are
appropriate to use with these data.
d) In the context of this study, describe a Type I and a Type II error. سؤال
سؤال
At the Billy Goat Gruff Inn, machines are set to dispense 600 ml of soda into every
customer's glass. Over time, however, the machine can get "out of control" and dispense too
much soda or too little. The machine needs adjustment if the mean amount dispensed is
different than 600 ml. At a randomly selected time each clock hour, the owner dispenses and
checks a glass of soda and determines the actual volume of soda dispensed. One day the
volumes (in ml) of the dispensed soda were: Is there sufficient evidence to conclude that the dispensing machine needs adjustment?
customer's glass. Over time, however, the machine can get "out of control" and dispense too
much soda or too little. The machine needs adjustment if the mean amount dispensed is
different than 600 ml. At a randomly selected time each clock hour, the owner dispenses and
checks a glass of soda and determines the actual volume of soda dispensed. One day the
volumes (in ml) of the dispensed soda were:
Is there sufficient evidence to conclude that the dispensing machine needs adjustment? سؤال
A company provides portable walkie-talkies to construction crews. Their batteries last, on
average, 55 hours of continuous use. The purchasing manager receives a brochure
advertising a new brand of batteries with a lower price, but suspects that the lifetime of the
batteries may be shorter than the brand currently in use. To test this, 8 randomly selected
new brand batteries are installed in the same model radio. Here are the results for the
lifetime of the batteries (in hours):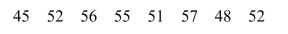 Is there sufficient evidence to conclude that the purchasing manager is correct in his
conjecture that the new brand has a shorter average lifetime?
average, 55 hours of continuous use. The purchasing manager receives a brochure
advertising a new brand of batteries with a lower price, but suspects that the lifetime of the
batteries may be shorter than the brand currently in use. To test this, 8 randomly selected
new brand batteries are installed in the same model radio. Here are the results for the
lifetime of the batteries (in hours):
Is there sufficient evidence to conclude that the purchasing manager is correct in hisconjecture that the new brand has a shorter average lifetime?
سؤال
The department of natural resources classifies a fish to be unsafe to eat if its
polychlorinated biphenol (PCB) concentration exceeds 5 parts per billion (ppb). A
random sample of 10 fish taken from a local lake resulted in the concentrations listed
below:
2. The department if natural resources is concerned that the mean PCB concentration for
fish from this lake exceeds 5 ppb.
a) What null and alternative hypotheses should the investigators use? In a few
sentences, justify your choice of the alternative hypothesis.
b) Using a graphic technique of your choice, show that the t-procedures are
appropriate to use with these data.
c) Using your hypotheses from part (a), carry out a hypothesis test using α= 0.05
and interpret the results.
d) In the context of this study, describe a Type I and a Type II error.
polychlorinated biphenol (PCB) concentration exceeds 5 parts per billion (ppb). A
random sample of 10 fish taken from a local lake resulted in the concentrations listed
below:
2.
The department if natural resources is concerned that the mean PCB concentration forfish from this lake exceeds 5 ppb.
a) What null and alternative hypotheses should the investigators use? In a few
sentences, justify your choice of the alternative hypothesis.
b) Using a graphic technique of your choice, show that the t-procedures are
appropriate to use with these data.
c) Using your hypotheses from part (a), carry out a hypothesis test using α= 0.05
and interpret the results.
d) In the context of this study, describe a Type I and a Type II error.
سؤال
T 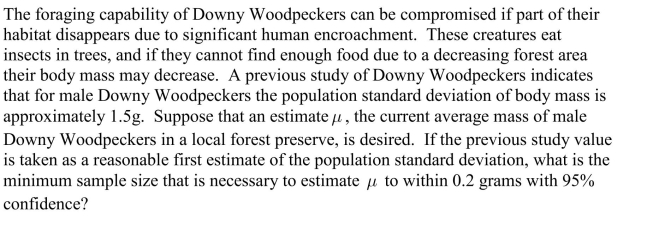
سؤال
سؤال
The State Fisheries Department wishes to stock the Styx River with fish, and would like the
species to not only survive but thrive. The "substrate" (pebble size at bottom) of a river is an
important determinant of the quality of spawning habitat. Unknown to the Fisheries
officials, the pebble diameters in the Styx River are approximately normally distributed with
a mean of 24 mm, and a standard deviation of 8 mm. Fisheries officials will select a random
sample of pebbles in an attempt to estimate the average pebble size.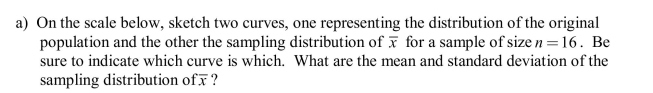
 b) What is the approximate probability that a sample of n = 16 from this population would
result in a sample mean greater than 30 mm?
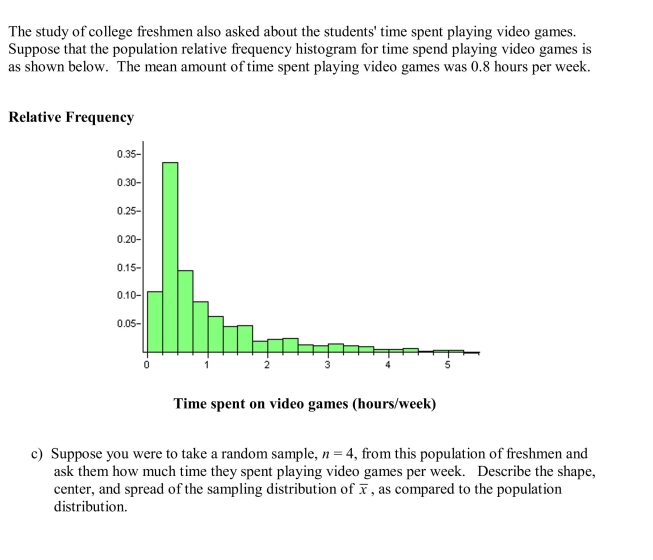
The graph below is a relative frequency histogram of the lengths of the gentle Hecate fish in the
Styx River, as recorded during a large fish tagging survey. You can assume that this histogram
represents the population of fish lengths.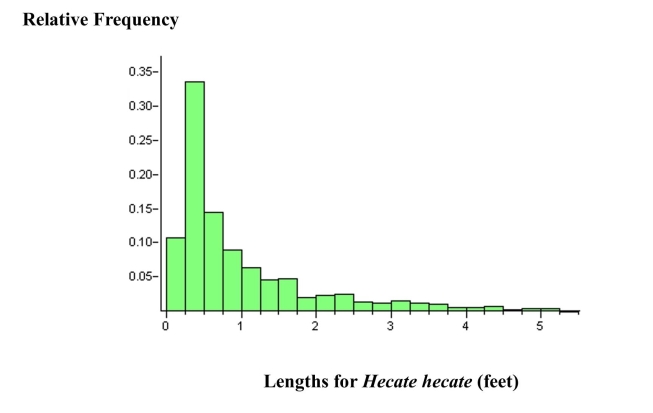 c) Suppose you were to take a random sample, n = 4, from this population of fish and
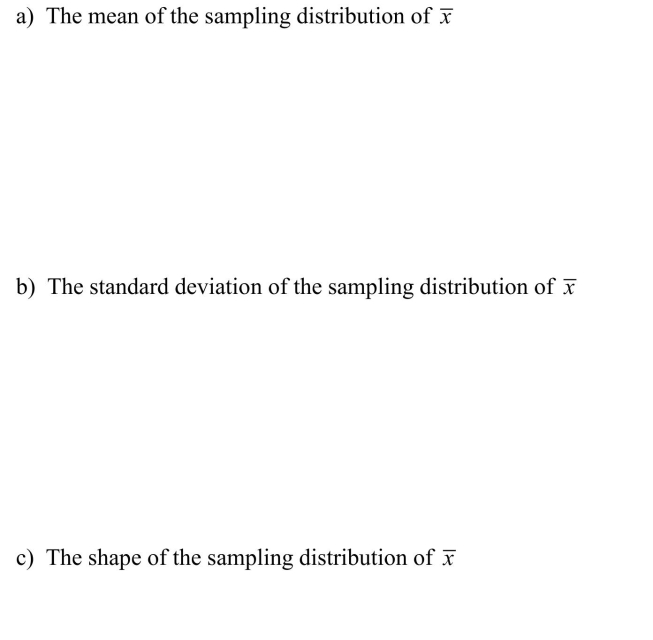
measure their lengths. Describe the shape, center, and spread of the sampling
distribution of x , as compared to the population distribution.
species to not only survive but thrive. The "substrate" (pebble size at bottom) of a river is an
important determinant of the quality of spawning habitat. Unknown to the Fisheries
officials, the pebble diameters in the Styx River are approximately normally distributed with
a mean of 24 mm, and a standard deviation of 8 mm. Fisheries officials will select a random
sample of pebbles in an attempt to estimate the average pebble size.
b) What is the approximate probability that a sample of n = 16 from this population wouldresult in a sample mean greater than 30 mm?
The graph below is a relative frequency histogram of the lengths of the gentle Hecate fish in the
Styx River, as recorded during a large fish tagging survey. You can assume that this histogram
represents the population of fish lengths.
c) Suppose you were to take a random sample, n = 4, from this population of fish andmeasure their lengths. Describe the shape, center, and spread of the sampling
distribution of x , as compared to the population distribution.
سؤال
A very large study of college students' study habits found that the time (in hours) that
freshmen study each week is approximately normal with mean 24 hours and standard
deviation 8 hours. Consider random samples of size 16 from the population of freshmen.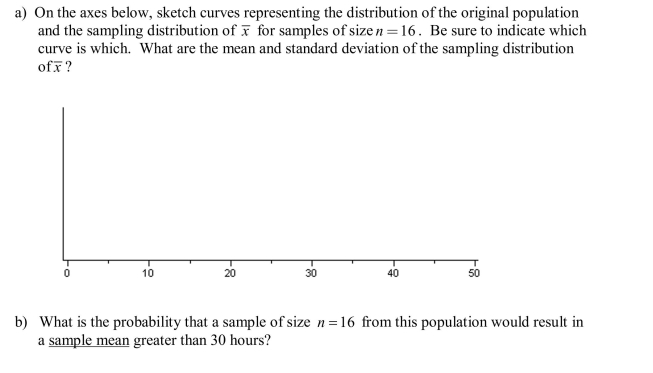
freshmen study each week is approximately normal with mean 24 hours and standard
deviation 8 hours. Consider random samples of size 16 from the population of freshmen.
سؤال
سؤال
سؤال
Describe in a few sentences how each of the following affects the power of a test: 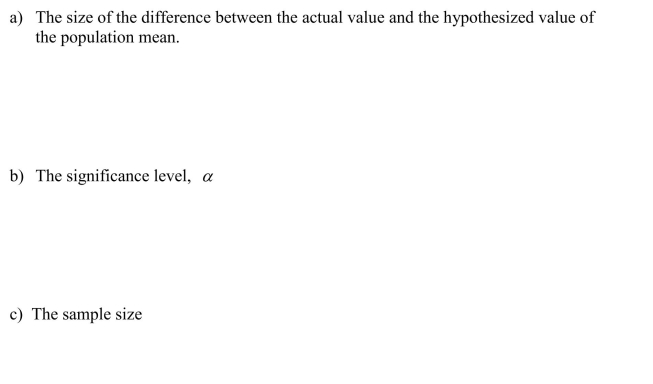

فتح الحزمة
قم بالتسجيل لفتح البطاقات في هذه المجموعة!
Unlock Deck
Unlock Deck
1/38
العب
ملء الشاشة (f)
Deck 12: Asking and Answering Questions About a Population Mean
1
2
A
3
False
4
فتح الحزمة
افتح القفل للوصول البطاقات البالغ عددها 38 في هذه المجموعة.
فتح الحزمة
k this deck
5
فتح الحزمة
افتح القفل للوصول البطاقات البالغ عددها 38 في هذه المجموعة.
فتح الحزمة
k this deck
6
The level of significance of a test is the probability of making a type I
error.
error.
فتح الحزمة
افتح القفل للوصول البطاقات البالغ عددها 38 في هذه المجموعة.
فتح الحزمة
k this deck
7
فتح الحزمة
افتح القفل للوصول البطاقات البالغ عددها 38 في هذه المجموعة.
فتح الحزمة
k this deck
8
C
فتح الحزمة
افتح القفل للوصول البطاقات البالغ عددها 38 في هذه المجموعة.
فتح الحزمة
k this deck
9
فتح الحزمة
افتح القفل للوصول البطاقات البالغ عددها 38 في هذه المجموعة.
فتح الحزمة
k this deck
10
فتح الحزمة
افتح القفل للوصول البطاقات البالغ عددها 38 في هذه المجموعة.
فتح الحزمة
k this deck
11
فتح الحزمة
افتح القفل للوصول البطاقات البالغ عددها 38 في هذه المجموعة.
فتح الحزمة
k this deck
12
C
فتح الحزمة
افتح القفل للوصول البطاقات البالغ عددها 38 في هذه المجموعة.
فتح الحزمة
k this deck
13
A
فتح الحزمة
افتح القفل للوصول البطاقات البالغ عددها 38 في هذه المجموعة.
فتح الحزمة
k this deck
14
A statistic is a characteristic of a population.
فتح الحزمة
افتح القفل للوصول البطاقات البالغ عددها 38 في هذه المجموعة.
فتح الحزمة
k this deck
15
All other things being equal, choosing a smaller value of α will increase
the probability of making a type II error.
the probability of making a type II error.
فتح الحزمة
افتح القفل للوصول البطاقات البالغ عددها 38 في هذه المجموعة.
فتح الحزمة
k this deck
16
Local health authorities are concerned that the hectic pace in their city has elevated
the stress, and thus the blood pressure, of women. The authorities will study this
issue by measuring the blood pressure of a random sample of women in the city and
estimating the mean blood pressure, μ , of women in the city. Blood pressure is
approximately normally distributed in humans, and a previous study suggests the
population standard deviation of women's blood pressure is about 8 mm Hg.
Suppose the health authorities accept this value as a reasonable estimate of the
standard deviation of blood pressure of today's women in this city. If it is desired to
estimate μ to within 1.0 mm Hg with 95% confidence, what is the minimum sample
size that is necessary?
فتح الحزمة
افتح القفل للوصول البطاقات البالغ عددها 38 في هذه المجموعة.
فتح الحزمة
k this deck
17
فتح الحزمة
افتح القفل للوصول البطاقات البالغ عددها 38 في هذه المجموعة.
فتح الحزمة
k this deck
18
If the null hypothesis is not rejected, there is strong statistical evidence
that the null hypothesis is true.
that the null hypothesis is true.
فتح الحزمة
افتح القفل للوصول البطاقات البالغ عددها 38 في هذه المجموعة.
فتح الحزمة
k this deck
19
We say that the result of a hypothesis test is "statistically significant"
when the P-value is less than or equal toα.
when the P-value is less than or equal toα.
فتح الحزمة
افتح القفل للوصول البطاقات البالغ عددها 38 في هذه المجموعة.
فتح الحزمة
k this deck
20
فتح الحزمة
افتح القفل للوصول البطاقات البالغ عددها 38 في هذه المجموعة.
فتح الحزمة
k this deck
21
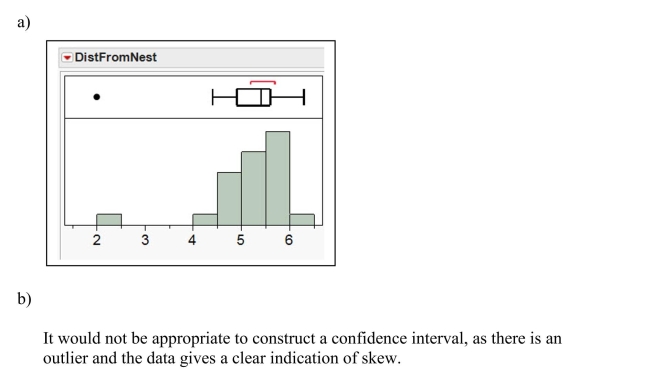
One indicator of the health of field mice is the length of their tails. The following
data on tail length (in mm) were gathered from a representative sample of field mice
near Fairfield, Iowa. A biologist would like to construct a 95% confidence interval
for the population mean tail length of the field mice near Fairfield. a) Using a graphical display of your choice, display the data in a way that will allow
you to determine whether it would be appropriate to use a t confidence interval to
estimate the population mean.
b) Using the graphical display from part (a), would you advise that constructing a t
confidence interval is appropriate? Explain the basis of your recommendation.
data on tail length (in mm) were gathered from a representative sample of field mice
near Fairfield, Iowa. A biologist would like to construct a 95% confidence interval
for the population mean tail length of the field mice near Fairfield.
a) Using a graphical display of your choice, display the data in a way that will allowyou to determine whether it would be appropriate to use a t confidence interval to
estimate the population mean.
b) Using the graphical display from part (a), would you advise that constructing a t
confidence interval is appropriate? Explain the basis of your recommendation.
فتح الحزمة
افتح القفل للوصول البطاقات البالغ عددها 38 في هذه المجموعة.
فتح الحزمة
k this deck
22
When performing hypothesis tests, there are assumptions that must be met in order for the test
to be appropriate. Describe the assumptions associated with a hypothesis test about a
population mean when the sample size is small. For any assumptions that can be checked
using sample data, describe how the check would be performed.
to be appropriate. Describe the assumptions associated with a hypothesis test about a
population mean when the sample size is small. For any assumptions that can be checked
using sample data, describe how the check would be performed.
فتح الحزمة
افتح القفل للوصول البطاقات البالغ عددها 38 في هذه المجموعة.
فتح الحزمة
k this deck
23
Give as much information as you can about the P-value of a t-test in the following
situations:
situations:
فتح الحزمة
افتح القفل للوصول البطاقات البالغ عددها 38 في هذه المجموعة.
فتح الحزمة
k this deck
24
Many national parks, wildlife refuges, and wilderness areas lie directly below designated
military air space. This raises issues of whether wildlife and loud jet noises are compatible.
In an effort to evaluate the effects of low-altitude jet-noise, researchers simulated these
noises for a representative sample of captive desert mule deer. Three minutes after the loud
noises were played, the heart rates (beats per minute) of these animals was measured, with
the following results: a) Calculate and interpret a 95% confidence interval for the mean heart rate 3 minutes after
loud jet noises.
b) The usual mean heart rate for desert mule deer is about 51.2 beats per minute. Does the
confidence interval in part (a) support the view that the loud jet noise has some lingering
effect on the heart rate of desert mule deer? Explain, using appropriate statistical
language.
military air space. This raises issues of whether wildlife and loud jet noises are compatible.
In an effort to evaluate the effects of low-altitude jet-noise, researchers simulated these
noises for a representative sample of captive desert mule deer. Three minutes after the loud
noises were played, the heart rates (beats per minute) of these animals was measured, with
the following results:
a) Calculate and interpret a 95% confidence interval for the mean heart rate 3 minutes afterloud jet noises.
b) The usual mean heart rate for desert mule deer is about 51.2 beats per minute. Does the
confidence interval in part (a) support the view that the loud jet noise has some lingering
effect on the heart rate of desert mule deer? Explain, using appropriate statistical
language.
فتح الحزمة
افتح القفل للوصول البطاقات البالغ عددها 38 في هذه المجموعة.
فتح الحزمة
k this deck
25
Give as much information as you can about the P-value of a t-test in the following
situations:
situations:
فتح الحزمة
افتح القفل للوصول البطاقات البالغ عددها 38 في هذه المجموعة.
فتح الحزمة
k this deck
26
Describe in a few sentences how each of the following affects the power of a test:
فتح الحزمة
افتح القفل للوصول البطاقات البالغ عددها 38 في هذه المجموعة.
فتح الحزمة
k this deck
27
A boat manufacturer claims that a particular boat model and motor combination will
burn less than 4.0 gallons of fuel per hour. Fuel consumption for a random sample of
10 similar boats was measured, resulting in the data below: A consumer group is interested in determining if there is convincing evidence that the
manufacturer's claim is correct.
a) What null and alternative hypotheses should the investigators use? In a few
sentences, justify your choice of the alternative hypothesis.
b) Using a graphic technique of your choice, show that the t-procedures are
appropriate to use with these data. d) In the context of this study, describe a Type I and a Type II error.
burn less than 4.0 gallons of fuel per hour. Fuel consumption for a random sample of
10 similar boats was measured, resulting in the data below:
A consumer group is interested in determining if there is convincing evidence that themanufacturer's claim is correct.
a) What null and alternative hypotheses should the investigators use? In a few
sentences, justify your choice of the alternative hypothesis.
b) Using a graphic technique of your choice, show that the t-procedures are
appropriate to use with these data.
d) In the context of this study, describe a Type I and a Type II error. فتح الحزمة
افتح القفل للوصول البطاقات البالغ عددها 38 في هذه المجموعة.
فتح الحزمة
k this deck
28
When performing hypothesis tests, there are assumptions that must be met in order for the test
to be appropriate. Describe the assumptions associated with a hypothesis test about a
population mean when the sample size is small. For any assumptions that can be checked
using sample data, describe how the check would be performed.
to be appropriate. Describe the assumptions associated with a hypothesis test about a
population mean when the sample size is small. For any assumptions that can be checked
using sample data, describe how the check would be performed.
فتح الحزمة
افتح القفل للوصول البطاقات البالغ عددها 38 في هذه المجموعة.
فتح الحزمة
k this deck
29
At the Billy Goat Gruff Inn, machines are set to dispense 600 ml of soda into every
customer's glass. Over time, however, the machine can get "out of control" and dispense too
much soda or too little. The machine needs adjustment if the mean amount dispensed is
different than 600 ml. At a randomly selected time each clock hour, the owner dispenses and
checks a glass of soda and determines the actual volume of soda dispensed. One day the
volumes (in ml) of the dispensed soda were: Is there sufficient evidence to conclude that the dispensing machine needs adjustment?
customer's glass. Over time, however, the machine can get "out of control" and dispense too
much soda or too little. The machine needs adjustment if the mean amount dispensed is
different than 600 ml. At a randomly selected time each clock hour, the owner dispenses and
checks a glass of soda and determines the actual volume of soda dispensed. One day the
volumes (in ml) of the dispensed soda were:
Is there sufficient evidence to conclude that the dispensing machine needs adjustment? فتح الحزمة
افتح القفل للوصول البطاقات البالغ عددها 38 في هذه المجموعة.
فتح الحزمة
k this deck
30
A company provides portable walkie-talkies to construction crews. Their batteries last, on
average, 55 hours of continuous use. The purchasing manager receives a brochure
advertising a new brand of batteries with a lower price, but suspects that the lifetime of the
batteries may be shorter than the brand currently in use. To test this, 8 randomly selected
new brand batteries are installed in the same model radio. Here are the results for the
lifetime of the batteries (in hours): Is there sufficient evidence to conclude that the purchasing manager is correct in his
conjecture that the new brand has a shorter average lifetime?
average, 55 hours of continuous use. The purchasing manager receives a brochure
advertising a new brand of batteries with a lower price, but suspects that the lifetime of the
batteries may be shorter than the brand currently in use. To test this, 8 randomly selected
new brand batteries are installed in the same model radio. Here are the results for the
lifetime of the batteries (in hours):
Is there sufficient evidence to conclude that the purchasing manager is correct in hisconjecture that the new brand has a shorter average lifetime?
فتح الحزمة
افتح القفل للوصول البطاقات البالغ عددها 38 في هذه المجموعة.
فتح الحزمة
k this deck
31
The department of natural resources classifies a fish to be unsafe to eat if its
polychlorinated biphenol (PCB) concentration exceeds 5 parts per billion (ppb). A
random sample of 10 fish taken from a local lake resulted in the concentrations listed
below:
2. The department if natural resources is concerned that the mean PCB concentration for
fish from this lake exceeds 5 ppb.
a) What null and alternative hypotheses should the investigators use? In a few
sentences, justify your choice of the alternative hypothesis.
b) Using a graphic technique of your choice, show that the t-procedures are
appropriate to use with these data.
c) Using your hypotheses from part (a), carry out a hypothesis test using α= 0.05
and interpret the results.
d) In the context of this study, describe a Type I and a Type II error.
polychlorinated biphenol (PCB) concentration exceeds 5 parts per billion (ppb). A
random sample of 10 fish taken from a local lake resulted in the concentrations listed
below:
2.
The department if natural resources is concerned that the mean PCB concentration forfish from this lake exceeds 5 ppb.
a) What null and alternative hypotheses should the investigators use? In a few
sentences, justify your choice of the alternative hypothesis.
b) Using a graphic technique of your choice, show that the t-procedures are
appropriate to use with these data.
c) Using your hypotheses from part (a), carry out a hypothesis test using α= 0.05
and interpret the results.
d) In the context of this study, describe a Type I and a Type II error.
فتح الحزمة
افتح القفل للوصول البطاقات البالغ عددها 38 في هذه المجموعة.
فتح الحزمة
k this deck
32
T
فتح الحزمة
افتح القفل للوصول البطاقات البالغ عددها 38 في هذه المجموعة.
فتح الحزمة
k this deck
33
فتح الحزمة
افتح القفل للوصول البطاقات البالغ عددها 38 في هذه المجموعة.
فتح الحزمة
k this deck
34
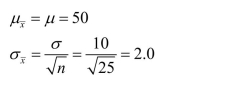
The State Fisheries Department wishes to stock the Styx River with fish, and would like the
species to not only survive but thrive. The "substrate" (pebble size at bottom) of a river is an
important determinant of the quality of spawning habitat. Unknown to the Fisheries
officials, the pebble diameters in the Styx River are approximately normally distributed with
a mean of 24 mm, and a standard deviation of 8 mm. Fisheries officials will select a random
sample of pebbles in an attempt to estimate the average pebble size. b) What is the approximate probability that a sample of n = 16 from this population would
result in a sample mean greater than 30 mm?
The graph below is a relative frequency histogram of the lengths of the gentle Hecate fish in the
Styx River, as recorded during a large fish tagging survey. You can assume that this histogram
represents the population of fish lengths. c) Suppose you were to take a random sample, n = 4, from this population of fish and
measure their lengths. Describe the shape, center, and spread of the sampling
distribution of x , as compared to the population distribution.
species to not only survive but thrive. The "substrate" (pebble size at bottom) of a river is an
important determinant of the quality of spawning habitat. Unknown to the Fisheries
officials, the pebble diameters in the Styx River are approximately normally distributed with
a mean of 24 mm, and a standard deviation of 8 mm. Fisheries officials will select a random
sample of pebbles in an attempt to estimate the average pebble size.
b) What is the approximate probability that a sample of n = 16 from this population wouldresult in a sample mean greater than 30 mm?
The graph below is a relative frequency histogram of the lengths of the gentle Hecate fish in the
Styx River, as recorded during a large fish tagging survey. You can assume that this histogram
represents the population of fish lengths.
c) Suppose you were to take a random sample, n = 4, from this population of fish andmeasure their lengths. Describe the shape, center, and spread of the sampling
distribution of x , as compared to the population distribution.
فتح الحزمة
افتح القفل للوصول البطاقات البالغ عددها 38 في هذه المجموعة.
فتح الحزمة
k this deck
35
A very large study of college students' study habits found that the time (in hours) that
freshmen study each week is approximately normal with mean 24 hours and standard
deviation 8 hours. Consider random samples of size 16 from the population of freshmen.
freshmen study each week is approximately normal with mean 24 hours and standard
deviation 8 hours. Consider random samples of size 16 from the population of freshmen.
فتح الحزمة
افتح القفل للوصول البطاقات البالغ عددها 38 في هذه المجموعة.
فتح الحزمة
k this deck
36
In a few sentences, describe the difference between statistical and practical
significance.
significance.
فتح الحزمة
افتح القفل للوصول البطاقات البالغ عددها 38 في هذه المجموعة.
فتح الحزمة
k this deck
37
In a few sentences, describe the difference between statistical and practical
significance.
significance.
فتح الحزمة
افتح القفل للوصول البطاقات البالغ عددها 38 في هذه المجموعة.
فتح الحزمة
k this deck
38
Describe in a few sentences how each of the following affects the power of a test:
فتح الحزمة
افتح القفل للوصول البطاقات البالغ عددها 38 في هذه المجموعة.
فتح الحزمة
k this deck
فتح الحزمة
افتح القفل للوصول البطاقات البالغ عددها 38 في هذه المجموعة.


