Deck 19: Exploratory Factor Analysis
ملء الشاشة (f)
سؤال
Use the data for the three groups of computer owners shown in the section Another Example to perform a discriminant analysis. From the analysis, determine the following:
1. What are the Fisher discriminant functions that can be used to classify each case
2. What is the overall success rate of classifying the cases in the sample
3. Overall, how successful will the classifications based on the Fisher functions be on another sample, based on the leave-one-out procedure
4. What is the predicted classification of each case shown below
سؤال
The file World95.sav is located in the SPSS subdirectory of C:\Program Files. It contains a string variable religion. Use Recode into Different Variables to make a new numeric variable RelCat consisting of the values 0 through 3 that have the correspondence shown below in the second window.
Perform a discriminant analysis to determine the dimensions that best allow religions 1-3 to be distinguished. The table below shows the variable names together with their labels that should be included as predictors in the analysis:
 Answer the following questions:
1. Based on the group centroids, which religions are best distinguished by each function
2. Based on the structure coefficients, what labels might be suitable for describing each dimension
Perform a discriminant analysis to determine the dimensions that best allow religions 1-3 to be distinguished. The table below shows the variable names together with their labels that should be included as predictors in the analysis:
Answer the following questions:1. Based on the group centroids, which religions are best distinguished by each function
2. Based on the structure coefficients, what labels might be suitable for describing each dimension
سؤال
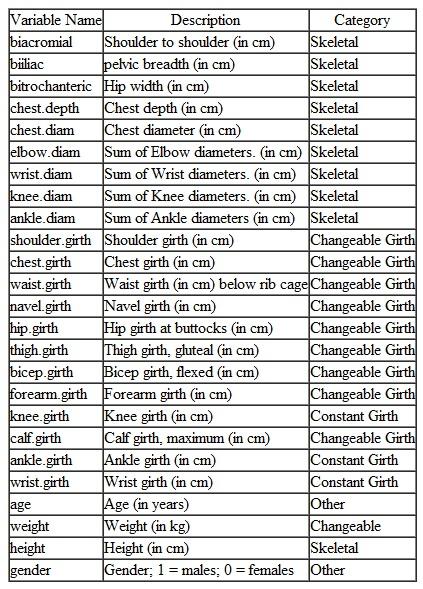
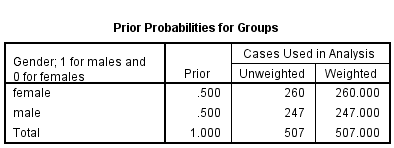
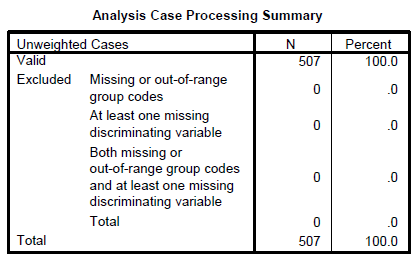
The file BodyDimensions.sav , described earlier in Exercise 1, contains measurements of various physical characteristics of healthy male and female adults. Use all the variables except age to determine how effectively cases can be classified according to their gender (0 = female, 1 = male). In performing the analysis, assume there is an equal proportion of males and females in the population. Report the following information:
1. Does the discriminant function significantly aid prediction of group membership
2. What is the overall percent correct classification rate using the classification functions
3. Using structure coefficients, what two variables correlate most strongly with the discriminant function Based on other information included in the output, which two variables independently contribute most to the discriminant function
4. Use just the variables obtained as answers to question 3 as predictors of gender. Based on the four predictors what are the answers to questions 1 and 2 above What equations should be used to determine a person's gender based on values of the four variables
Exercise 1
Heinz and Peterson measured the body characteristics of healthy, active adults. Ten of the measurements, including height, were of skeletal properties that could be used to define each person's body build. Twelve measurements were of girths that either were changeable (they could be affected, for example, by how much muscle or fat a person had) or constant. In addition, each person's weight was measured. Age and gender were recorded. The variables' names and each one's category are shown in the table below:
 These data are available on the publisher's website for this text at the address http://www.pearsonhighered.com/stern2e in the file BodyDimensions.sav. This dataset is adapted from data published in the article by Heinz, Grete, Peterson, Louis J., Johnson, Roger W., and Kerk, Carter J. (2003), "Exploring relationships in body dimensions", Journal of Statistics Education Volume 11, Number 2, www.amstat.org/publications/jse/v11n2/datasets.heinz.html. Full measurement descriptions are given in this article. Permission to use the data has been granted by the authors.
1. What is the equation that predicts a person's weight from the skeletal variables including the variable height
2. How well does the equation derived in question 1 explain variability in weight Is the relation statistically significant Provide supporting data.
3. Create a prediction equation for weight from the changeable girths and height. Does it predict weight more accurately than the above equation Which equation is a better guide for what would be a reasonable weight over the lifespan
4. Use a stepwise procedure to determine the best equation for predicting weight from the skeletal variables, including height, and the changeable girth variables. Specify how well the equation works in predicting weight.
1. Does the discriminant function significantly aid prediction of group membership
2. What is the overall percent correct classification rate using the classification functions
3. Using structure coefficients, what two variables correlate most strongly with the discriminant function Based on other information included in the output, which two variables independently contribute most to the discriminant function
4. Use just the variables obtained as answers to question 3 as predictors of gender. Based on the four predictors what are the answers to questions 1 and 2 above What equations should be used to determine a person's gender based on values of the four variables
Exercise 1
Heinz and Peterson measured the body characteristics of healthy, active adults. Ten of the measurements, including height, were of skeletal properties that could be used to define each person's body build. Twelve measurements were of girths that either were changeable (they could be affected, for example, by how much muscle or fat a person had) or constant. In addition, each person's weight was measured. Age and gender were recorded. The variables' names and each one's category are shown in the table below:
These data are available on the publisher's website for this text at the address http://www.pearsonhighered.com/stern2e in the file BodyDimensions.sav. This dataset is adapted from data published in the article by Heinz, Grete, Peterson, Louis J., Johnson, Roger W., and Kerk, Carter J. (2003), "Exploring relationships in body dimensions", Journal of Statistics Education Volume 11, Number 2, www.amstat.org/publications/jse/v11n2/datasets.heinz.html. Full measurement descriptions are given in this article. Permission to use the data has been granted by the authors.1. What is the equation that predicts a person's weight from the skeletal variables including the variable height
2. How well does the equation derived in question 1 explain variability in weight Is the relation statistically significant Provide supporting data.
3. Create a prediction equation for weight from the changeable girths and height. Does it predict weight more accurately than the above equation Which equation is a better guide for what would be a reasonable weight over the lifespan
4. Use a stepwise procedure to determine the best equation for predicting weight from the skeletal variables, including height, and the changeable girth variables. Specify how well the equation works in predicting weight.
سؤال
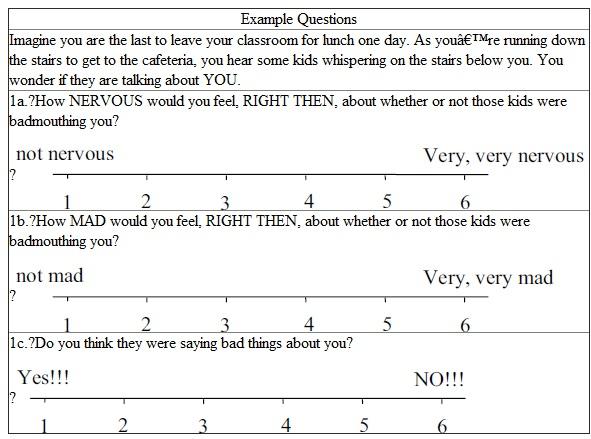
Data gathered by Patricia K. Kerig and Kurt K. Stellwagen at the University of North Carolina at Chapel Hill was obtained both from children diagnosed primarily with externalizing behavior disorders at a large psychiatric institution in North Carolina and a control sample of children. The 18-item questionnaire (Ayduk et al., 2000) included six questions that probed for anxious rejection sensitivity (see example question 1a in the table below), six that probed for angry rejection sensitivity (e.g., question 1b), and six that probed for a rejection sensitive attributional bias (e.g., question 1c). Perform the analyses described below using data in file ConductdvsControl.sav , available at the website for this text at the address http://www.pearsonhighered.com/stern2e. The data appear here by permission of Professors Kerig (now at Miami University) and Stellwagen (now at Eastern Washington University). Do three discriminant analyses. In the first, use the six questions that probed for anxious rejection sensitivity (variables crsq1_a - crsq6_a ) to predict group membership (variable Category with values 0 = control, 1 = externalizing behavior disorder). In the second discriminant analysis, use the six questions that probed for angry rejection sensitivity (variables crsq1_b - crsq6_b ) to predict group membership. In the third discriminant analysis, use the six questions that probed for rejection sensitive attributional bias (variables crsq1_c - crsq6_c ) to predict group membership. In conducting the analyses, have the program compute prior probabilities based on group sizes. For each analysis, answer these questions:
1. Does the discriminant function significantly aid prediction of group membership
2. What is the overall percent correct classification rate using the classification function
1. Does the discriminant function significantly aid prediction of group membership
2. What is the overall percent correct classification rate using the classification function

فتح الحزمة
قم بالتسجيل لفتح البطاقات في هذه المجموعة!
Unlock Deck
Unlock Deck
1/4
العب
ملء الشاشة (f)
Deck 19: Exploratory Factor Analysis
1
Use the data for the three groups of computer owners shown in the section Another Example to perform a discriminant analysis. From the analysis, determine the following:
1. What are the Fisher discriminant functions that can be used to classify each case
2. What is the overall success rate of classifying the cases in the sample
3. Overall, how successful will the classifications based on the Fisher functions be on another sample, based on the leave-one-out procedure
4. What is the predicted classification of each case shown below
1. What are the Fisher discriminant functions that can be used to classify each case
2. What is the overall success rate of classifying the cases in the sample
3. Overall, how successful will the classifications based on the Fisher functions be on another sample, based on the leave-one-out procedure
4. What is the predicted classification of each case shown below
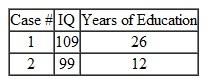
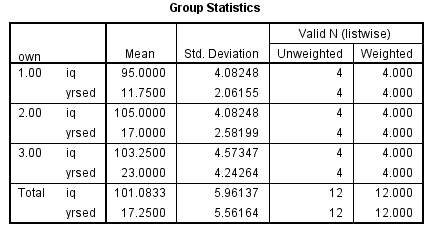
Using SPSS, the discriminant analysis for another example data is shown below:
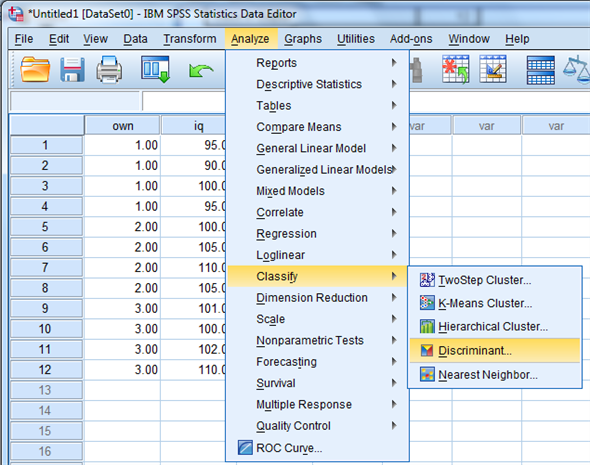
1) Select Analyze, Classify, Discriminant.
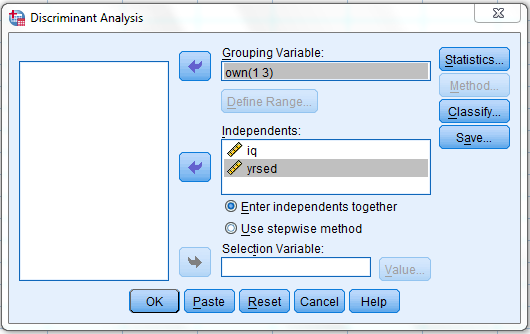
 2) When Discriminant Analysis dialog box appears, enter Own in Grouping variable text box, click Define range then bcontinue.
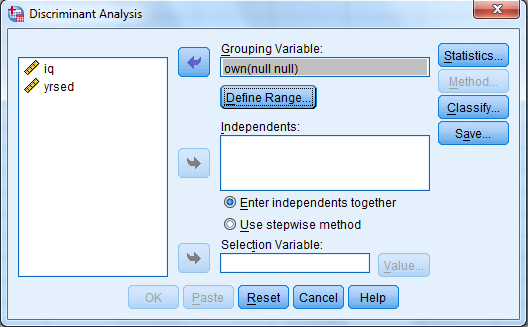
 Enter iq, yrsed in independent variable text box.
 3)
3)
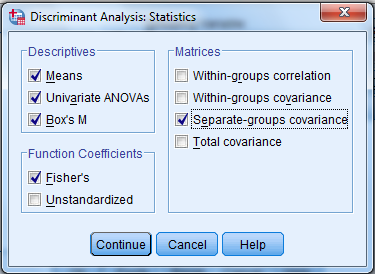
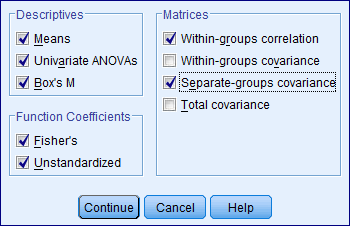
Click Statistics then continue.
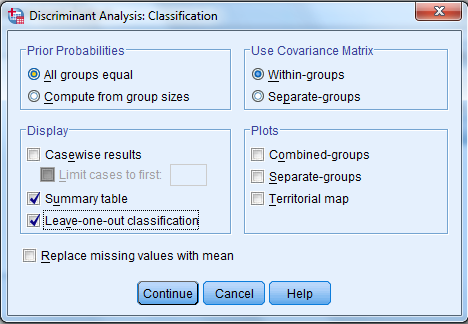
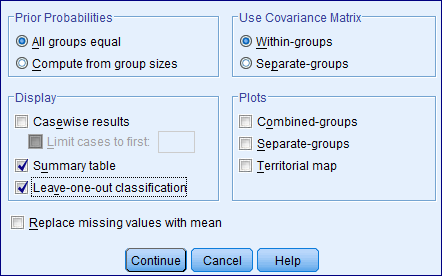
 4) Click Classify and select some options shown in the below widow and then continue.
 5) Click OK
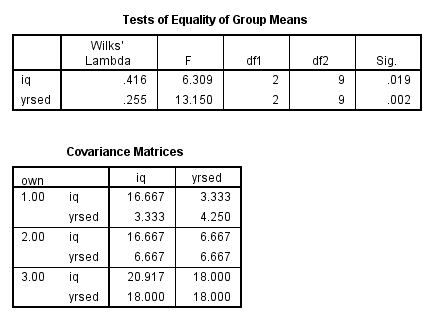
We get the following output:
 1)
1)
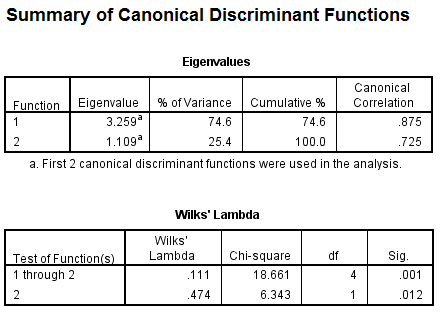
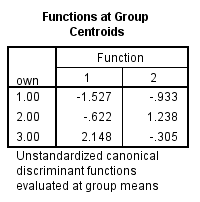
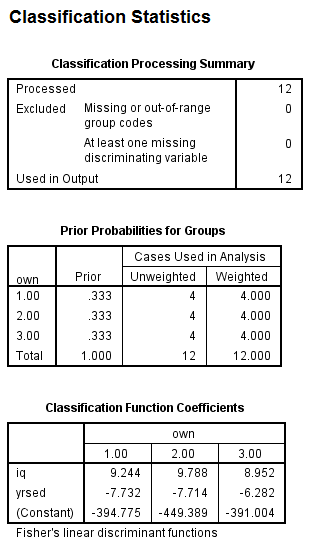
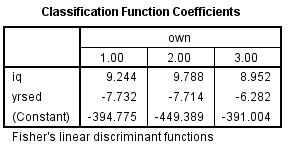
From the output, Fishers discriminant functions that can be used to classify each case is shown below:


 2)
2)
Consider the below output:
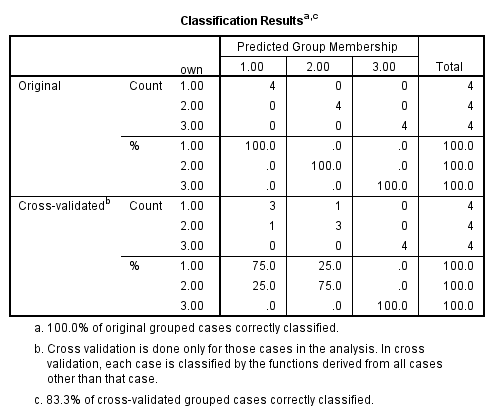
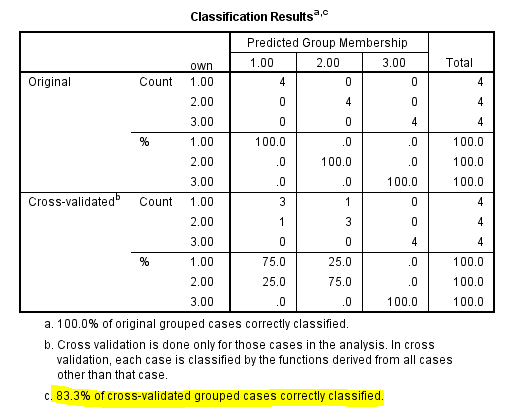 From the above output, it can be seen that overall success rate of classifying the cases in the sample is 83.3%
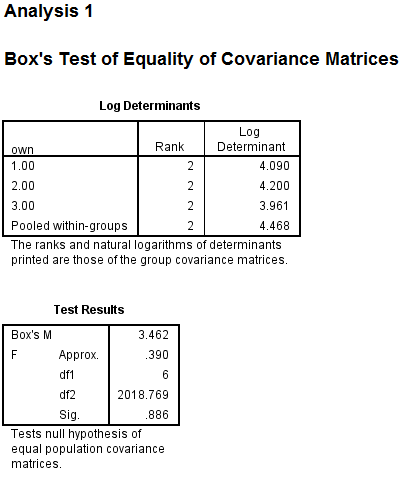
3)
Consider the below screen shoot:
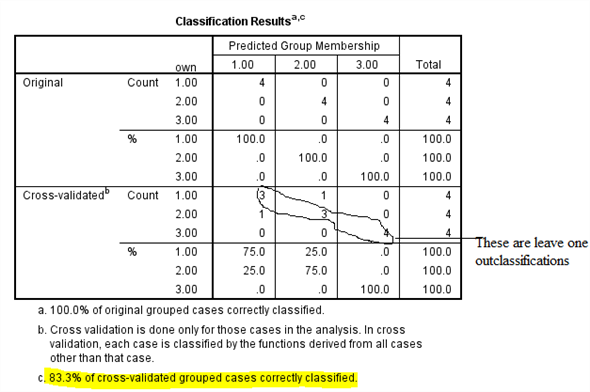 From the above output, it can be seen that overall success rate of classifying the cases in the sample is 83.3%
4)
The prediction classification for case 1 is,


 From the above results the largest value is corresponds to
 , so the case is classified as category 3 a renter.
The prediction classification for case 2 is,


 From the above results the largest value is corresponds to
 , so the case is classified as category 1 a non-owner.
1) Select Analyze, Classify, Discriminant.
2) When Discriminant Analysis dialog box appears, enter Own in Grouping variable text box, click Define range then bcontinue. Enter iq, yrsed in independent variable text box. 3) Click Statistics then continue.
4) Click Classify and select some options shown in the below widow and then continue. 5) Click OK We get the following output:
1) From the output, Fishers discriminant functions that can be used to classify each case is shown below:
2)Consider the below output:
From the above output, it can be seen that overall success rate of classifying the cases in the sample is 83.3% 3)
Consider the below screen shoot:
From the above output, it can be seen that overall success rate of classifying the cases in the sample is 83.3% 4)
The prediction classification for case 1 is,
From the above results the largest value is corresponds to , so the case is classified as category 3 a renter.The prediction classification for case 2 is,
From the above results the largest value is corresponds to , so the case is classified as category 1 a non-owner. 2
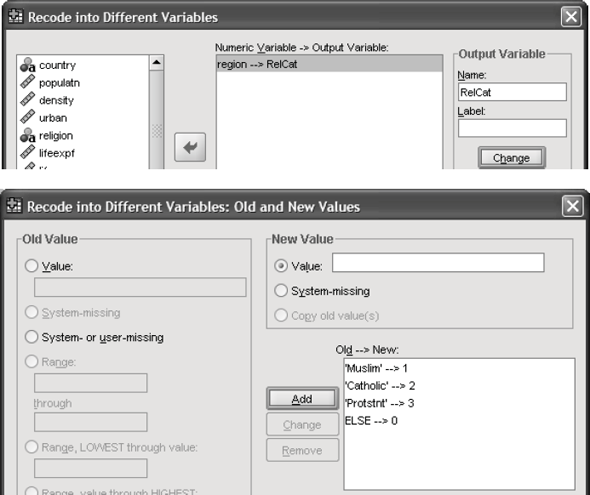
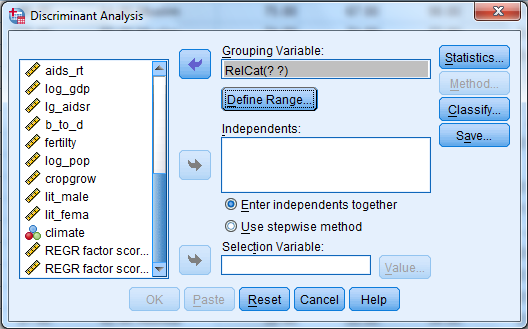
The file World95.sav is located in the SPSS subdirectory of C:\Program Files. It contains a string variable religion. Use Recode into Different Variables to make a new numeric variable RelCat consisting of the values 0 through 3 that have the correspondence shown below in the second window.
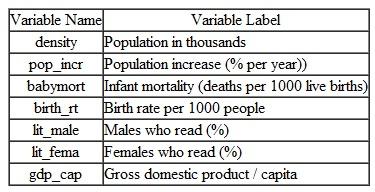
Perform a discriminant analysis to determine the dimensions that best allow religions 1-3 to be distinguished. The table below shows the variable names together with their labels that should be included as predictors in the analysis:
Answer the following questions:
1. Based on the group centroids, which religions are best distinguished by each function
2. Based on the structure coefficients, what labels might be suitable for describing each dimension
Perform a discriminant analysis to determine the dimensions that best allow religions 1-3 to be distinguished. The table below shows the variable names together with their labels that should be included as predictors in the analysis:
Answer the following questions:1. Based on the group centroids, which religions are best distinguished by each function
2. Based on the structure coefficients, what labels might be suitable for describing each dimension
Here we have a string variable religion. Use Recode into Different Variable to make a a new numeric variable RelCat consisting of the values 0 through 3.
The SPSS procedure is shown below:
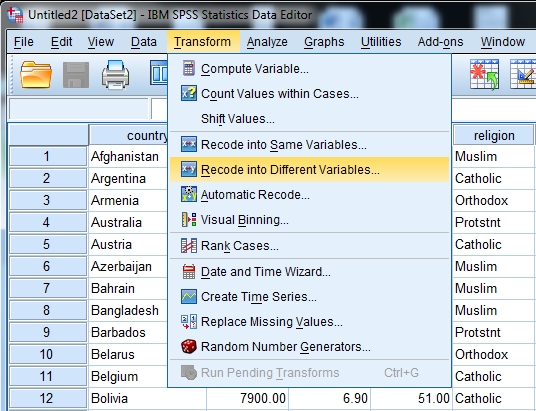
1) Select Transform, recording into different variables.
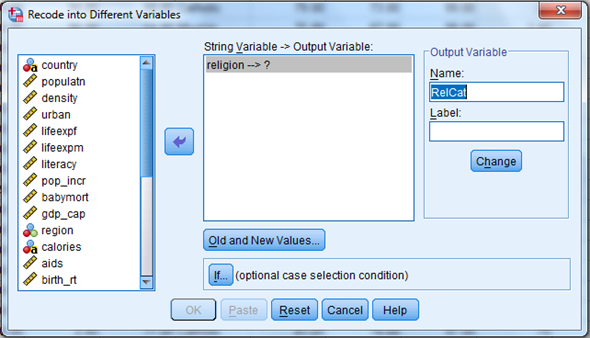
 2) Click the variables to be transferred and enter RelCat into Name text box.
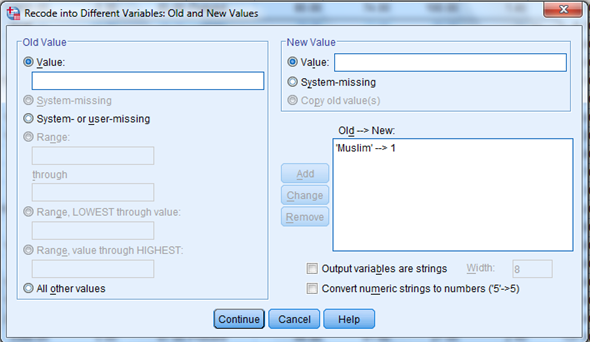
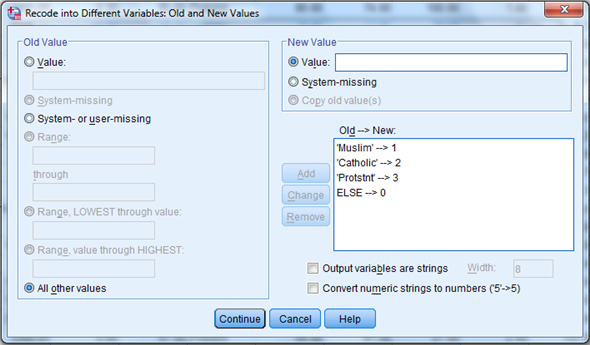
 3) Click old and new values button , old enter 'Muslim' in the value text box and 1 in the new value text box. Repeat this operation until we assign the old values into new values and click continue button.
 4)
4)
Click Continu, change then Ok.
We get the result of recode the variables news into newsfreq.
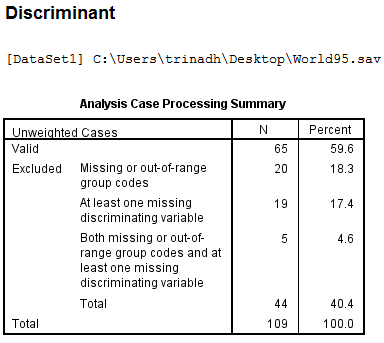
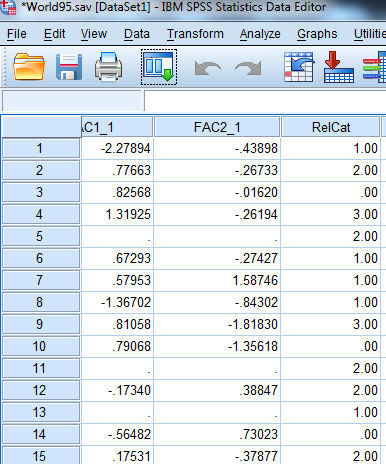 From the above output, we observe that the third column shows the recoded the variable religion into new numeric variable RelCat.
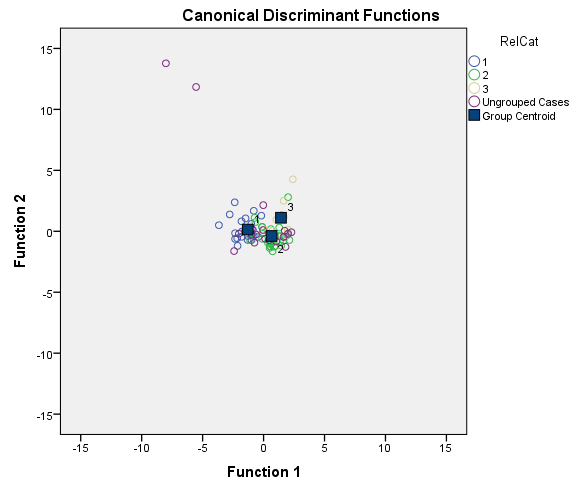
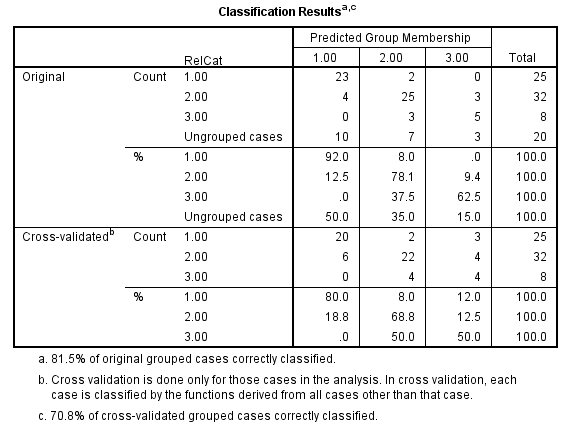
Now, we have to perform the discriminant analysis to determine the dimensions that best allow religions 1-3 to be distinguished.
The SPSS procedure is shown below:
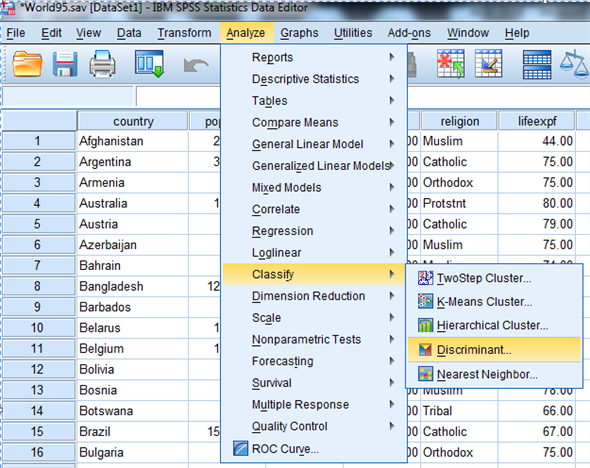
1) Select Analyze, Classify, Discriminant.
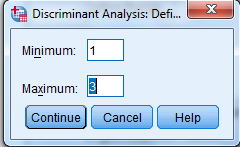
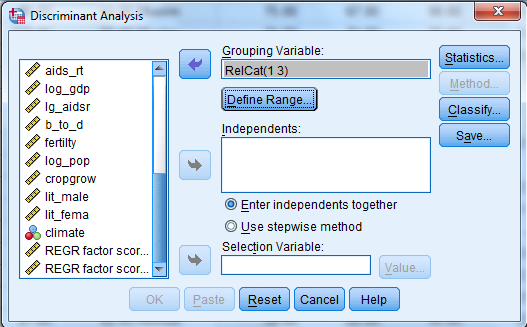
 2) When Discriminant Analysis dialog box appears, enter RelCat in Grouping variable text box, click Define range then continue.
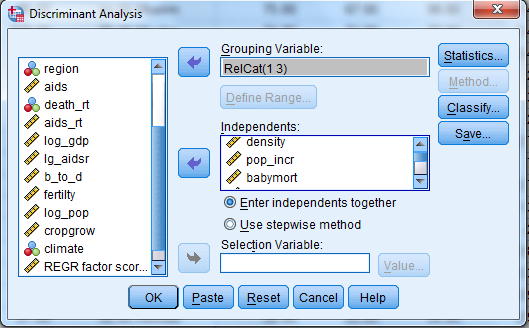
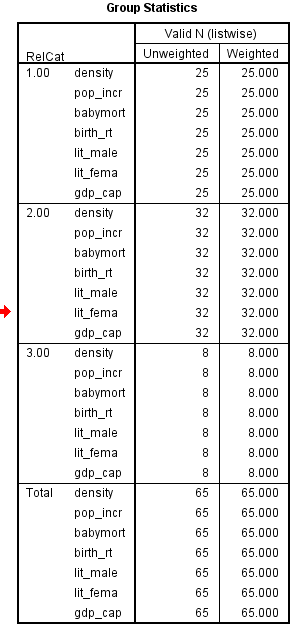
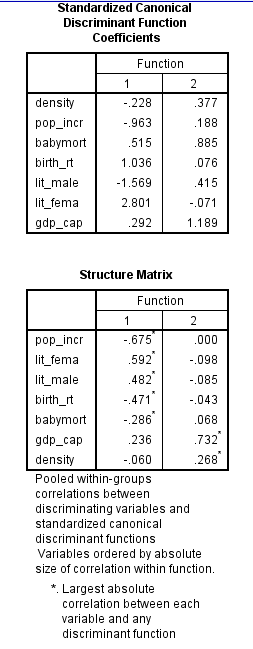
 3) Enter Density, pop_incr, babymort, birth_rt, lit_male, lit_fema, gdp_cap in independent variable text box.
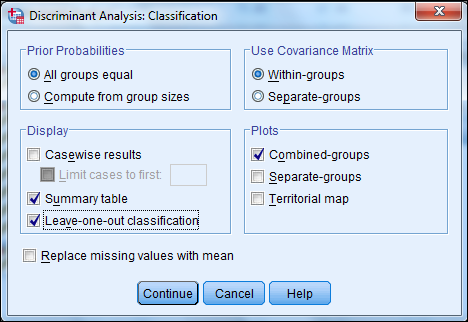
 4) Click Classify and select some options shown in the below widow and then continue.
 5) Click OK
Output:
 1)
1)
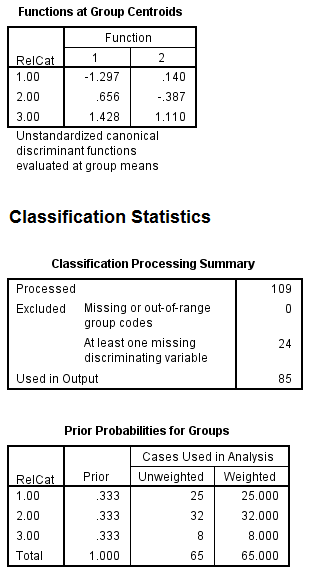
Based on the group centroids identify which religions are best distinguished by each function.
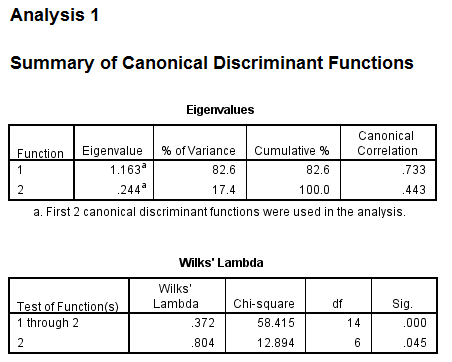
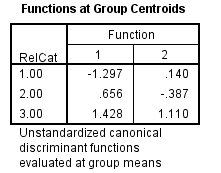 From the above output, it can be seen that the mean
 value of each group in the 2-dimensional space defined by the discriminant functions. The function 1 values of -1.297 for group1, 0.656 for group2 and 1.428 for group3. The function 2 values of 0.140 for group1, -0.387 for group2 and 1.110 for group3.
The religions Muslim and protstnt are best distinguished by function1 and the religion catholic is best distinguished by function2
2)
Based on the structure coefficients, identify what labels might be suitable for describing each dimension.
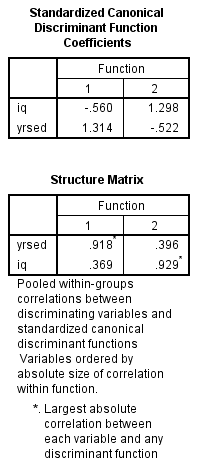
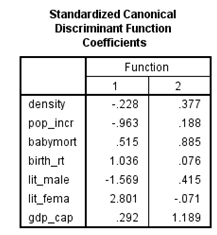 From the above output, it can be seen that the standardized canonical discriminant function coefficient is high for the variable lit_fema corresponding to function1, so the label Females who read label is suitable.
From the above output, it can be seen that the standardized canonical discriminant function coefficient is high for the variable gdp_ca corresponding to function2, so the label Gross domestic product/ capita is suitable.
The SPSS procedure is shown below:
1) Select Transform, recording into different variables.
2) Click the variables to be transferred and enter RelCat into Name text box. 3) Click old and new values button , old enter 'Muslim' in the value text box and 1 in the new value text box. Repeat this operation until we assign the old values into new values and click continue button. 4) Click Continu, change then Ok.
We get the result of recode the variables news into newsfreq.
From the above output, we observe that the third column shows the recoded the variable religion into new numeric variable RelCat. Now, we have to perform the discriminant analysis to determine the dimensions that best allow religions 1-3 to be distinguished.
The SPSS procedure is shown below:
1) Select Analyze, Classify, Discriminant.
2) When Discriminant Analysis dialog box appears, enter RelCat in Grouping variable text box, click Define range then continue. 3) Enter Density, pop_incr, babymort, birth_rt, lit_male, lit_fema, gdp_cap in independent variable text box. 4) Click Classify and select some options shown in the below widow and then continue. 5) Click OK Output:
1) Based on the group centroids identify which religions are best distinguished by each function.
From the above output, it can be seen that the mean value of each group in the 2-dimensional space defined by the discriminant functions. The function 1 values of -1.297 for group1, 0.656 for group2 and 1.428 for group3. The function 2 values of 0.140 for group1, -0.387 for group2 and 1.110 for group3.The religions Muslim and protstnt are best distinguished by function1 and the religion catholic is best distinguished by function2
2)
Based on the structure coefficients, identify what labels might be suitable for describing each dimension.
From the above output, it can be seen that the standardized canonical discriminant function coefficient is high for the variable lit_fema corresponding to function1, so the label Females who read label is suitable.From the above output, it can be seen that the standardized canonical discriminant function coefficient is high for the variable gdp_ca corresponding to function2, so the label Gross domestic product/ capita is suitable.
3
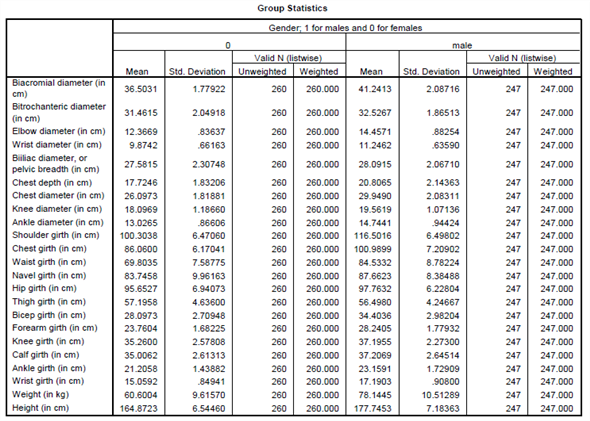
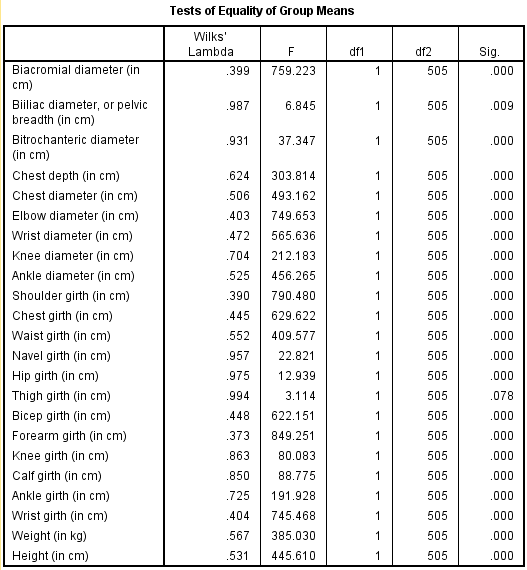
The file BodyDimensions.sav , described earlier in Exercise 1, contains measurements of various physical characteristics of healthy male and female adults. Use all the variables except age to determine how effectively cases can be classified according to their gender (0 = female, 1 = male). In performing the analysis, assume there is an equal proportion of males and females in the population. Report the following information:
1. Does the discriminant function significantly aid prediction of group membership
2. What is the overall percent correct classification rate using the classification functions
3. Using structure coefficients, what two variables correlate most strongly with the discriminant function Based on other information included in the output, which two variables independently contribute most to the discriminant function
4. Use just the variables obtained as answers to question 3 as predictors of gender. Based on the four predictors what are the answers to questions 1 and 2 above What equations should be used to determine a person's gender based on values of the four variables
Exercise 1
Heinz and Peterson measured the body characteristics of healthy, active adults. Ten of the measurements, including height, were of skeletal properties that could be used to define each person's body build. Twelve measurements were of girths that either were changeable (they could be affected, for example, by how much muscle or fat a person had) or constant. In addition, each person's weight was measured. Age and gender were recorded. The variables' names and each one's category are shown in the table below:
These data are available on the publisher's website for this text at the address http://www.pearsonhighered.com/stern2e in the file BodyDimensions.sav. This dataset is adapted from data published in the article by Heinz, Grete, Peterson, Louis J., Johnson, Roger W., and Kerk, Carter J. (2003), "Exploring relationships in body dimensions", Journal of Statistics Education Volume 11, Number 2, www.amstat.org/publications/jse/v11n2/datasets.heinz.html. Full measurement descriptions are given in this article. Permission to use the data has been granted by the authors.
1. What is the equation that predicts a person's weight from the skeletal variables including the variable height
2. How well does the equation derived in question 1 explain variability in weight Is the relation statistically significant Provide supporting data.
3. Create a prediction equation for weight from the changeable girths and height. Does it predict weight more accurately than the above equation Which equation is a better guide for what would be a reasonable weight over the lifespan
4. Use a stepwise procedure to determine the best equation for predicting weight from the skeletal variables, including height, and the changeable girth variables. Specify how well the equation works in predicting weight.
1. Does the discriminant function significantly aid prediction of group membership
2. What is the overall percent correct classification rate using the classification functions
3. Using structure coefficients, what two variables correlate most strongly with the discriminant function Based on other information included in the output, which two variables independently contribute most to the discriminant function
4. Use just the variables obtained as answers to question 3 as predictors of gender. Based on the four predictors what are the answers to questions 1 and 2 above What equations should be used to determine a person's gender based on values of the four variables
Exercise 1
Heinz and Peterson measured the body characteristics of healthy, active adults. Ten of the measurements, including height, were of skeletal properties that could be used to define each person's body build. Twelve measurements were of girths that either were changeable (they could be affected, for example, by how much muscle or fat a person had) or constant. In addition, each person's weight was measured. Age and gender were recorded. The variables' names and each one's category are shown in the table below:
These data are available on the publisher's website for this text at the address http://www.pearsonhighered.com/stern2e in the file BodyDimensions.sav. This dataset is adapted from data published in the article by Heinz, Grete, Peterson, Louis J., Johnson, Roger W., and Kerk, Carter J. (2003), "Exploring relationships in body dimensions", Journal of Statistics Education Volume 11, Number 2, www.amstat.org/publications/jse/v11n2/datasets.heinz.html. Full measurement descriptions are given in this article. Permission to use the data has been granted by the authors.1. What is the equation that predicts a person's weight from the skeletal variables including the variable height
2. How well does the equation derived in question 1 explain variability in weight Is the relation statistically significant Provide supporting data.
3. Create a prediction equation for weight from the changeable girths and height. Does it predict weight more accurately than the above equation Which equation is a better guide for what would be a reasonable weight over the lifespan
4. Use a stepwise procedure to determine the best equation for predicting weight from the skeletal variables, including height, and the changeable girth variables. Specify how well the equation works in predicting weight.
Perform discriminant analysis for the given data using SPSS.
The following are the steps to find the required results:
Step1: Type or import the data into the Minitab work sheet.
Step 2: Go to
 Step 3: Highlight the names of the predictor variables and transfer them to the independent field.
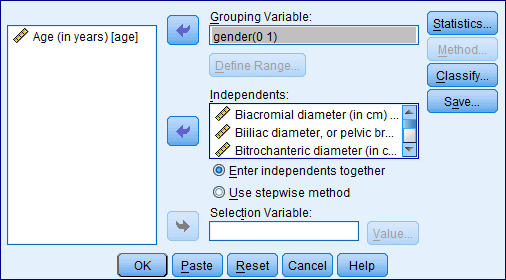
Highlight the name of the grouping variable and transfer it to the Grouping Variable ( gender ) filed.
Step 4: Click Define Range (0, 1).
 Click on continue then we get the following window.
 Step 5: Click on Statistics and specify the required results.
 Click on continue.
Step 6: Click on Classify and specify the required results.
 Click on continue.
Step 7: Click on save and specify the required results.
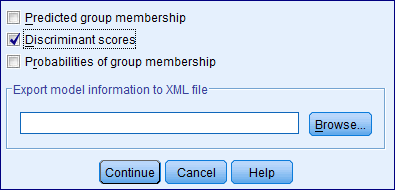 Click on continue
By following the above instructions we get the output as shown below:
 1)
1)
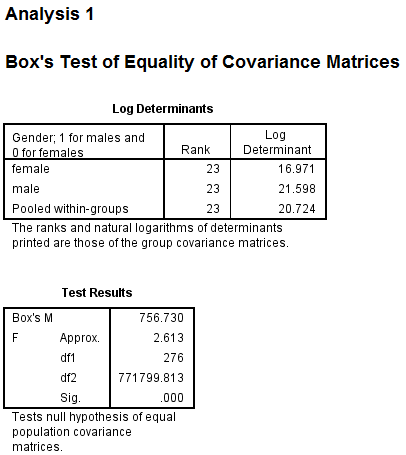
Under this test the null and alternative hypotheses are,
 The discriminant function in not significantly aid prediction of group membership
 The discriminant function in significantly aid prediction of group membership
Let us assume the level of significance
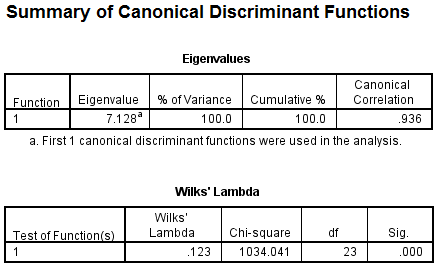
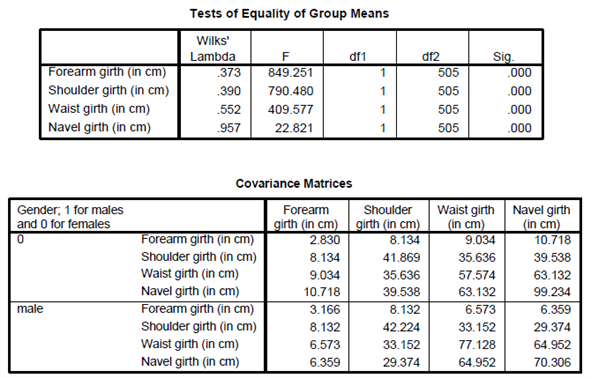
 From the above output the function has a Wilks' lambda = 0.12, and the corresponding
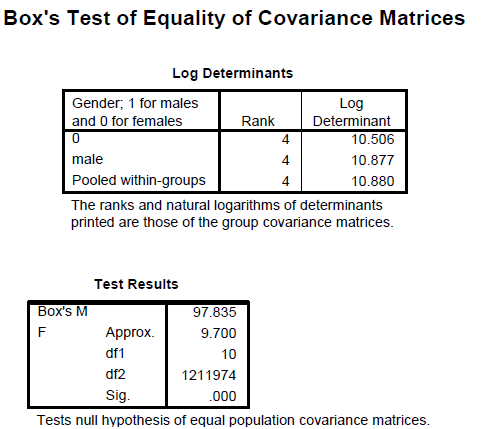
P -value is 0.000, since p.05 we reject the null hypothesis and conclude that the discriminant function in significantly aid prediction of group membership.
2)
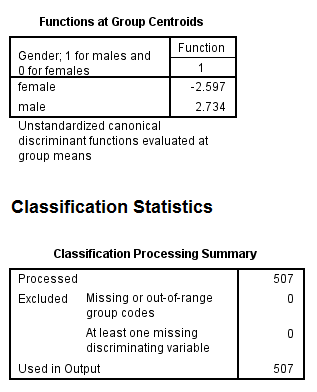
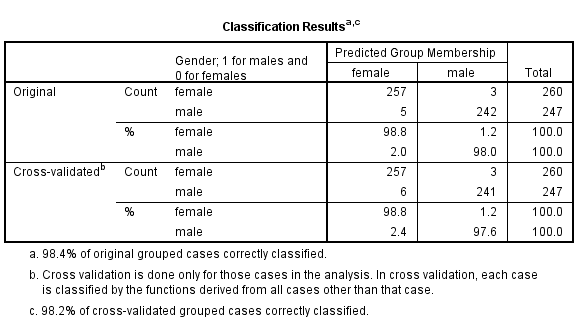
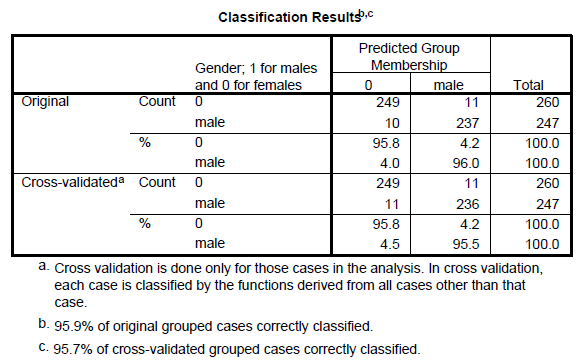
From the above classification results output, the discriminant function successfully predicted computer gender of 98% of the cases in the sample.
3)
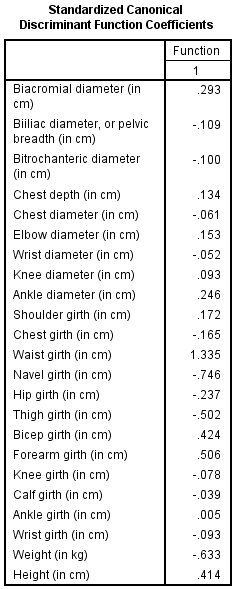
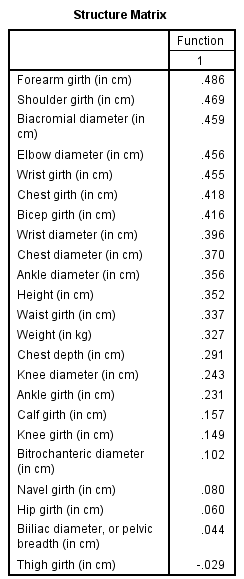
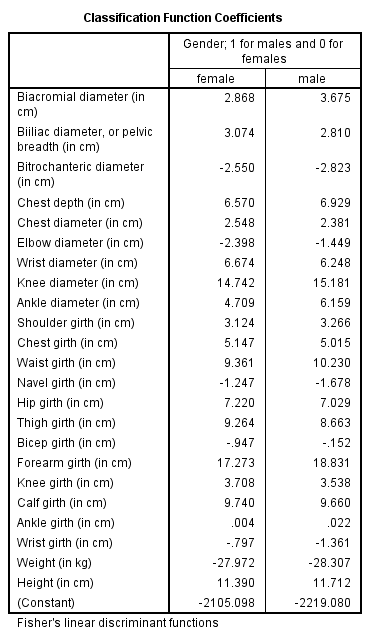
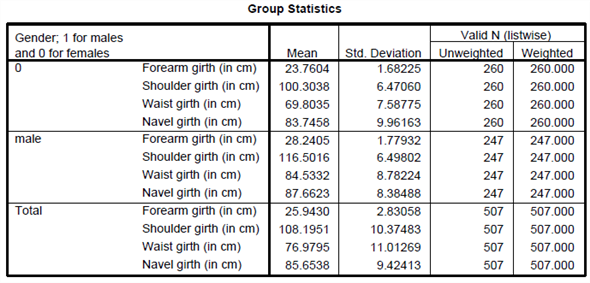
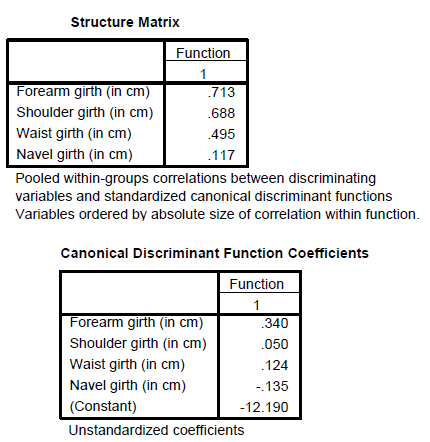
The two variables that were most strongly correlated with the discriminant function were forearm girth and shoulder girth. Based on the standardized discriminant function coefficients, waist girth and navel girth made the greatest independent contributions to discriminating between males and females.
4)
To answer question 4, a discriminant analysis was conducted using the predictors forearm girth, shoulder girth, waist girth and navel girth.
The analysis output is shown below:
 Under this test the null and alternative hypotheses are,
 The discriminant function in not significantly aid prediction of group membership
 The discriminant function in significantly aid prediction of group membership
Let us assume the level of significance
 From the above output the function has a Wilks'
 , and the corresponding
P -value is 0.000, since
 , reject the null hypothesis and conclude that the discriminant function in significantly aid prediction of group membership.
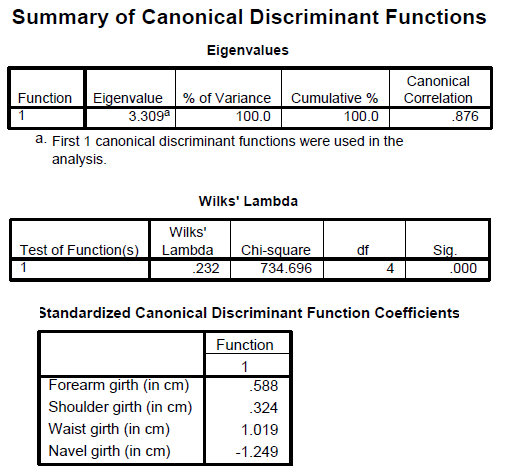
From the above classification results output, the discriminant function successfully predicted computer gender of 96% of the cases in the sample.
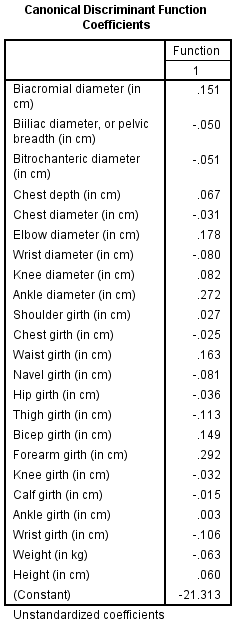
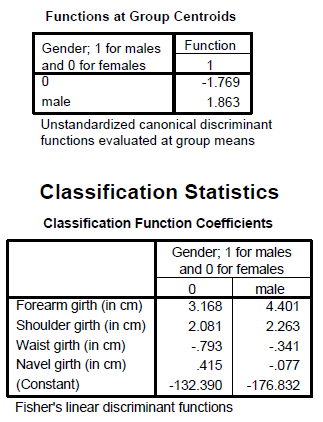
The Fisher functions could be used to predict a person's gender based on values of the four variables. The functions are:


The following are the steps to find the required results:
Step1: Type or import the data into the Minitab work sheet.
Step 2: Go to
Step 3: Highlight the names of the predictor variables and transfer them to the independent field.Highlight the name of the grouping variable and transfer it to the Grouping Variable ( gender ) filed.
Step 4: Click Define Range (0, 1).
Click on continue then we get the following window. Step 5: Click on Statistics and specify the required results. Click on continue.Step 6: Click on Classify and specify the required results.
Click on continue.Step 7: Click on save and specify the required results.
Click on continue By following the above instructions we get the output as shown below:
1)Under this test the null and alternative hypotheses are,
The discriminant function in not significantly aid prediction of group membership The discriminant function in significantly aid prediction of group membershipLet us assume the level of significance
From the above output the function has a Wilks' lambda = 0.12, and the corresponding P -value is 0.000, since p.05 we reject the null hypothesis and conclude that the discriminant function in significantly aid prediction of group membership.
2)
From the above classification results output, the discriminant function successfully predicted computer gender of 98% of the cases in the sample.
3)
The two variables that were most strongly correlated with the discriminant function were forearm girth and shoulder girth. Based on the standardized discriminant function coefficients, waist girth and navel girth made the greatest independent contributions to discriminating between males and females.
4)
To answer question 4, a discriminant analysis was conducted using the predictors forearm girth, shoulder girth, waist girth and navel girth.
The analysis output is shown below:
Under this test the null and alternative hypotheses are, The discriminant function in not significantly aid prediction of group membership The discriminant function in significantly aid prediction of group membershipLet us assume the level of significance
From the above output the function has a Wilks' , and the corresponding P -value is 0.000, since
, reject the null hypothesis and conclude that the discriminant function in significantly aid prediction of group membership.From the above classification results output, the discriminant function successfully predicted computer gender of 96% of the cases in the sample.
The Fisher functions could be used to predict a person's gender based on values of the four variables. The functions are:
4
Data gathered by Patricia K. Kerig and Kurt K. Stellwagen at the University of North Carolina at Chapel Hill was obtained both from children diagnosed primarily with externalizing behavior disorders at a large psychiatric institution in North Carolina and a control sample of children. The 18-item questionnaire (Ayduk et al., 2000) included six questions that probed for anxious rejection sensitivity (see example question 1a in the table below), six that probed for angry rejection sensitivity (e.g., question 1b), and six that probed for a rejection sensitive attributional bias (e.g., question 1c). Perform the analyses described below using data in file ConductdvsControl.sav , available at the website for this text at the address http://www.pearsonhighered.com/stern2e. The data appear here by permission of Professors Kerig (now at Miami University) and Stellwagen (now at Eastern Washington University). Do three discriminant analyses. In the first, use the six questions that probed for anxious rejection sensitivity (variables crsq1_a - crsq6_a ) to predict group membership (variable Category with values 0 = control, 1 = externalizing behavior disorder). In the second discriminant analysis, use the six questions that probed for angry rejection sensitivity (variables crsq1_b - crsq6_b ) to predict group membership. In the third discriminant analysis, use the six questions that probed for rejection sensitive attributional bias (variables crsq1_c - crsq6_c ) to predict group membership. In conducting the analyses, have the program compute prior probabilities based on group sizes. For each analysis, answer these questions:
1. Does the discriminant function significantly aid prediction of group membership
2. What is the overall percent correct classification rate using the classification function
1. Does the discriminant function significantly aid prediction of group membership
2. What is the overall percent correct classification rate using the classification function
فتح الحزمة
افتح القفل للوصول البطاقات البالغ عددها 4 في هذه المجموعة.
فتح الحزمة
k this deck
فتح الحزمة
افتح القفل للوصول البطاقات البالغ عددها 4 في هذه المجموعة.


