Deck 3: Functions and Graphs
ملء الشاشة (f)
سؤال
سؤال
سؤال
سؤال
Assuming that the graph shown has y-axis symmetry, sketch the complete graph. 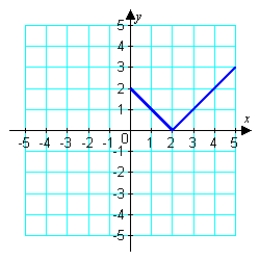
A)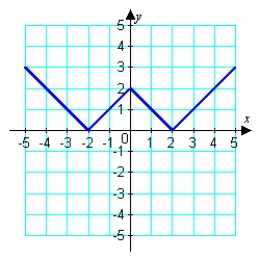
B)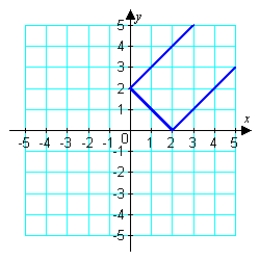
C)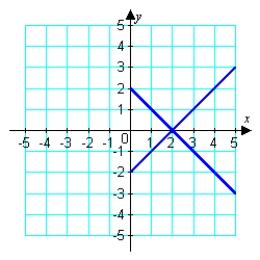
D)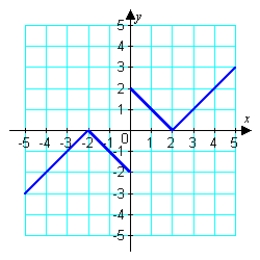
E)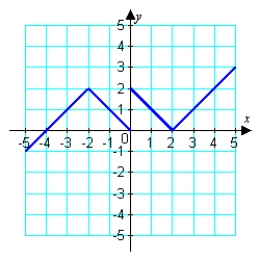
A)
B)
C)
D)
E)
سؤال
سؤال
سؤال
Estimate the slope of the line. 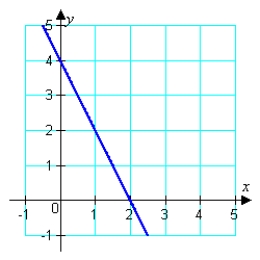
A)
B)
C)
D)
E)
A)
B)
C)
D)
E)
سؤال
Match the equation below with its graph. Graph I : 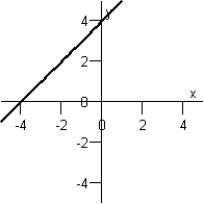 Graph IV :
 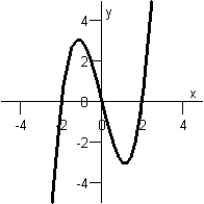 Graph II :
 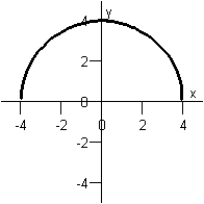 Graph V :
 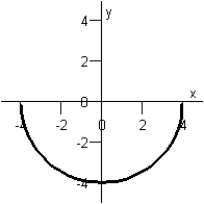 Graph III :
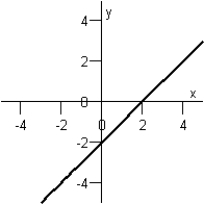
A)Graph IV
B)Graph III
C)Graph V
D)Graph II
E)Graph I
Graph IV : Graph II : Graph V : Graph III : A)Graph IV
B)Graph III
C)Graph V
D)Graph II
E)Graph I
سؤال
Sketch the graph of the equation below.
A)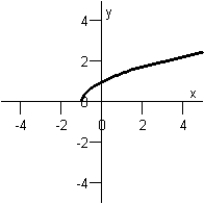
B)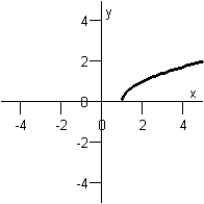
C)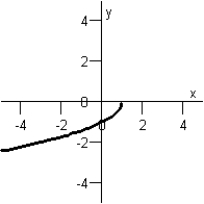
D)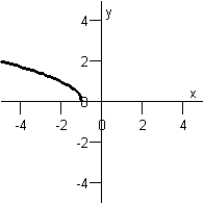
E)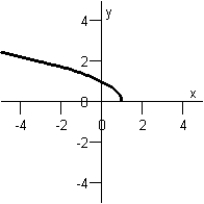
A)
B)
C)
D)
E)
سؤال
سؤال
Plot the points and find the slope of the line passing through the pair of points. (0, 4), (5, 2) 
A)slope:
B)slope:
C)slope:
D)slope:
E)slope:
A)slope:
B)slope:
C)slope:
D)slope:
E)slope:
سؤال
سؤال
سؤال
سؤال
سؤال
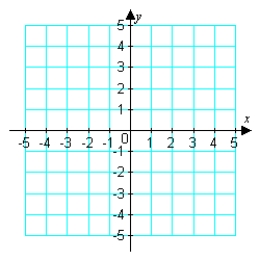
Plot the points below whose coordinates are given on a Cartesian coordinate system.
A)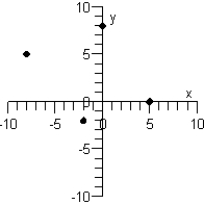
B)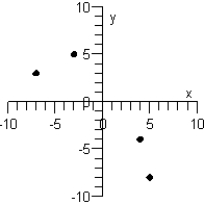
C)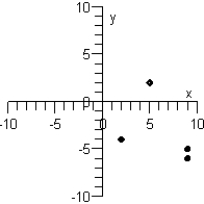
D)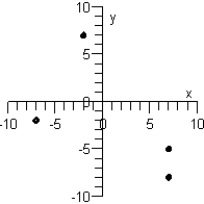
E)
A)
B)
C)
D)
E)
سؤال
Sketch the graph of the equation below.
A)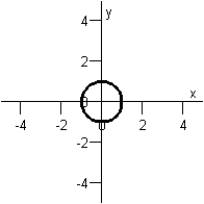
B)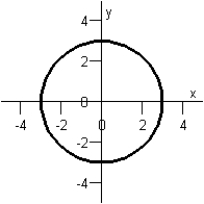
C)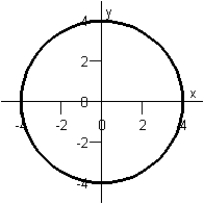
D)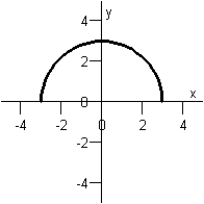
E)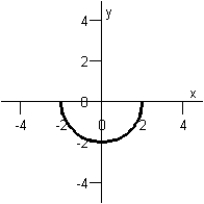
A)
B)
C)
D)
E)
سؤال
Graph the following equation by plotting points that satisfy the equation.
A)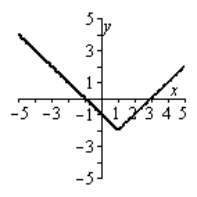
B)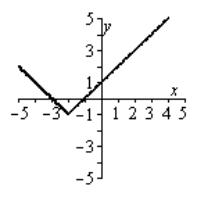
C)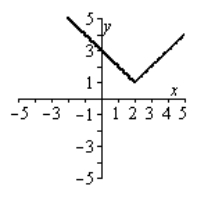
D)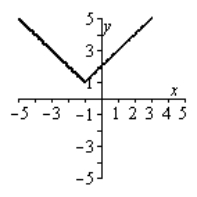
E)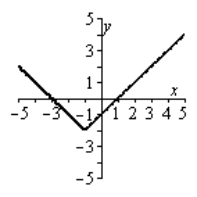
A)
B)
C)
D)
E)
سؤال
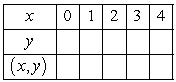
After completing the table, use the resulting solution points to sketch the graph of the equation  .
. 
. سؤال
سؤال
سؤال
سؤال
سؤال
سؤال
سؤال
سؤال
سؤال
سؤال
سؤال
سؤال
Which of the following graphs below can be approximated by a linear model? I 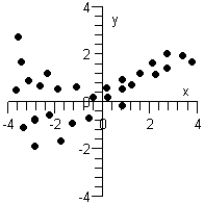 II
II 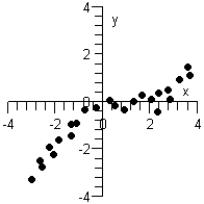 III
III 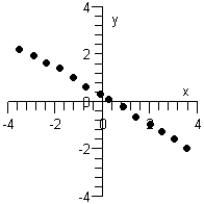
A)None can be modeled linearly.
B)Only graph III can be modeled linearly.
C)Only graphs I and II can be modeled linearly.
D)Only graphs I and III can be modeled linearly.
E)Graphs I, II, and III can be modeled linearly.
II III A)None can be modeled linearly.
B)Only graph III can be modeled linearly.
C)Only graphs I and II can be modeled linearly.
D)Only graphs I and III can be modeled linearly.
E)Graphs I, II, and III can be modeled linearly.
سؤال
سؤال
سؤال
سؤال
سؤال
Graph y as a function of x by finding the slope and y-intercept of the line below.
A)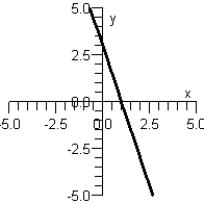
B)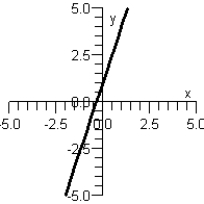
C)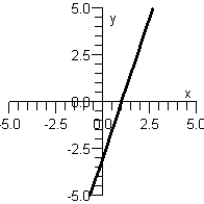
D)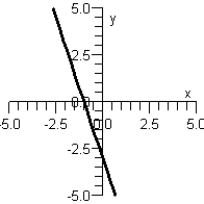
E)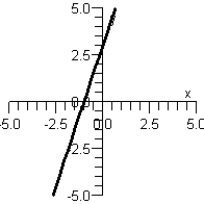
A)
B)
C)
D)
E)
سؤال
سؤال
سؤال
سؤال
Plot the points and find the slope of the line passing through the pair of points. (1, 0), (-2, 0) 
A)slope: 0
B)slope: 1
C)slope: -3
D)slope:
E)slope: undefined
A)slope: 0
B)slope: 1
C)slope: -3
D)slope:
E)slope: undefined
سؤال
سؤال
Sketch the graph of the function below.
A)
B)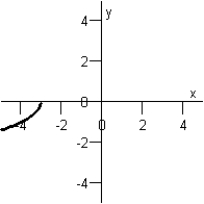
C)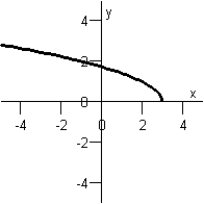
D)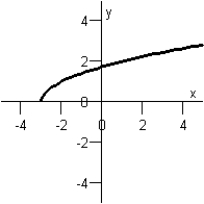
E)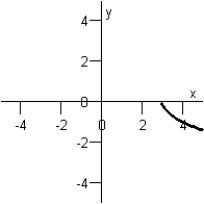
A)
B)
C)
D)
E)
سؤال
سؤال
سؤال
سؤال
Use the graph of the function to find the domain and range of f. 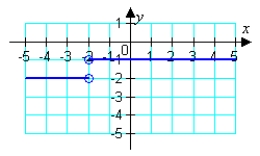
A) domain :
range :
B)
C)
D) domain : all real numbers
range:
E) domain :
range :
A) domain :
range :
B)
C)
D) domain : all real numbers
range:
E) domain :
range :
سؤال
سؤال
سؤال
سؤال
سؤال
سؤال
An open box is to be made from a square piece of cardboard having dimensions 22 inches by 22 inches by cutting out squares of area from each corner as shown in the figure below. If the volume of the box is given by state the domain of V . 
A)
B)
C)
D)
E)all real numbers
A)
B)
C)
D)
E)all real numbers
سؤال
Use the vertical line test to determine if the following graph is the graph of a function. 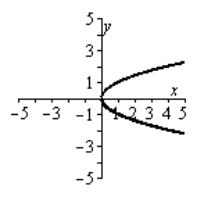
A)function
B)not a function
A)function
B)not a function
سؤال
سؤال
Which graph represents the function?
A)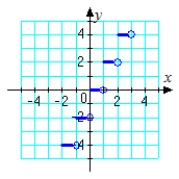
B)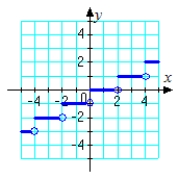
C)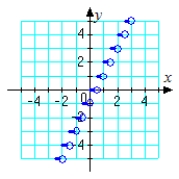
D)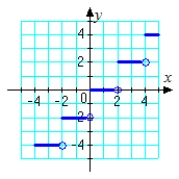
E)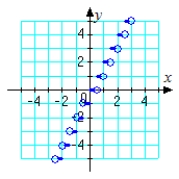
A)
B)
C)
D)
E)
سؤال
An open box is to be made from a square piece of cardboard having dimensions 32 inches by 32 inches by cutting out squares of area from each corner as shown in the figure below. Express the volume V of the box as a function of x. 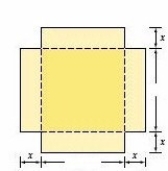
A)
B)
C)
D)
E)
A)
B)
C)
D)
E)
سؤال
سؤال
سؤال
سؤال
سؤال
Use the graph of to write an equation for the function whose graph is shown. 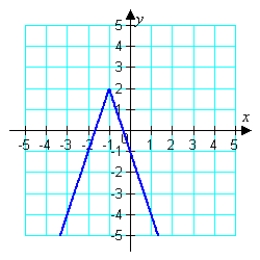
A)
B)
C)
D)
E)
A)
B)
C)
D)
E)
سؤال
Use a graphing utility to graph the function, approximate the relative minimum or maximum of the function, and estimate the open intervals on which the function is increasing or decreasing.
A) Decreasing on Increasing on Relative minimum:
B) Decreasing on Increasing on Relative maximum:
C) Decreasing on Increasing on Relative minimum: Relative maximum:
D)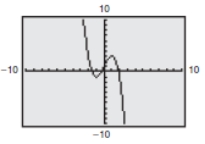 Decreasing on Increasing on Relative minimum: Relative maximum:
E)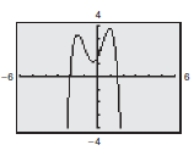 Decreasing on Increasing on Relative minimum: Relative maximum:
A)
Decreasing on Increasing on Relative minimum: B)
Decreasing on Increasing on Relative maximum: C)
Decreasing on Increasing on Relative minimum: Relative maximum: D)
Decreasing on Increasing on Relative minimum: Relative maximum: E)
Decreasing on Increasing on Relative minimum: Relative maximum: سؤال
The cost of sending an overnight package from New York to Atlanta is $9.80 for up to, but not including, the first pound and $3.50 for each additional pound (or portion of a pound). A model for the total cost of sending the package is where is the weight of the package (in pounds). Sketch the graph of this function. Note that the function is the greatest integer function.
A)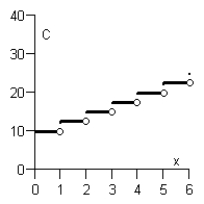
B)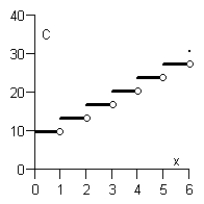
C)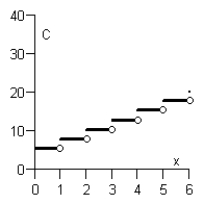
D)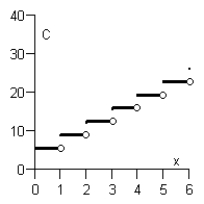
E)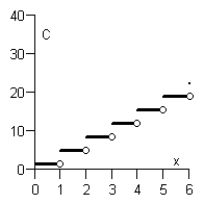
A)
B)
C)
D)
E)
سؤال
Use the graph of to write equations for the functions whose graphs are shown. 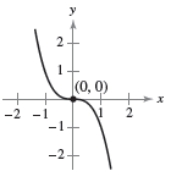
A)
B)
C)
D)
E)
A)
B)
C)
D)
E)
سؤال
سؤال
Describe the sequence of transformations from to . Then sketch the graph of by hand. Verify with a graphing utility.
A)Shifted 5 units downward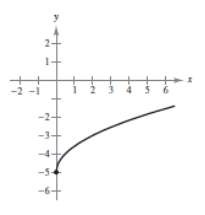
B)Shifted 1 unit upward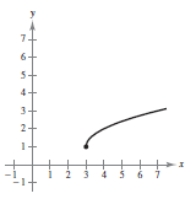
C)Shifted 4 units to the left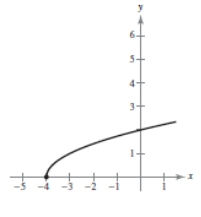
D)Shifts 3 units to the right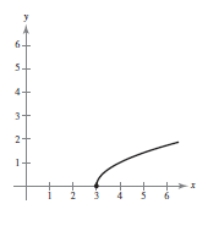
E)4 units to the left and 2 units upward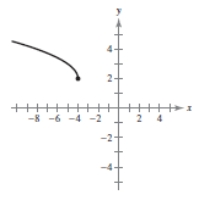
A)Shifted 5 units downward
B)Shifted 1 unit upward
C)Shifted 4 units to the left
D)Shifts 3 units to the right
E)4 units to the left and 2 units upward
سؤال
سؤال
Describe the sequence of transformations from to . Then sketch the graph of by hand. Verify with a graphing utility.
A)Vertical shifts down 3 units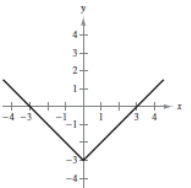
B)Vertical shifts 2 units upward
C)Horizontal shift 1 unit to the right
D)Horizontal shifts 4 units to the left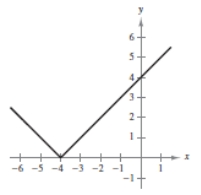
E)Vertical shifts 3 units upward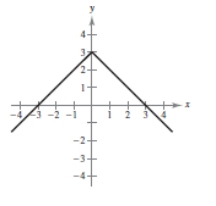
A)Vertical shifts down 3 units
B)Vertical shifts 2 units upward
C)Horizontal shift 1 unit to the right
D)Horizontal shifts 4 units to the left
E)Vertical shifts 3 units upward
سؤال
Use the graph of to sketch the graph of . 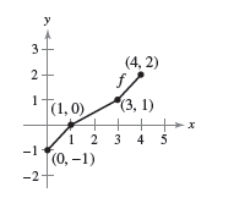
A)Horizontal shift 2 units to the right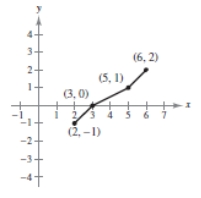
B)Reflection in the x-axis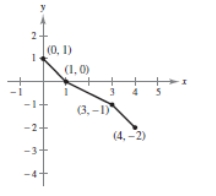
C)Vertical shift 2 units upward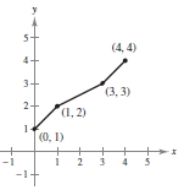
D)Horizontal shift 3 units to the left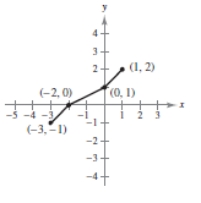
E)Stretching by 2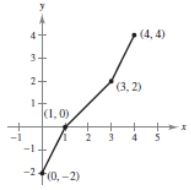
A)Horizontal shift 2 units to the right
B)Reflection in the x-axis
C)Vertical shift 2 units upward
D)Horizontal shift 3 units to the left
E)Stretching by 2
سؤال
Use the graph of to write an equation for the function whose graphs is shown below. 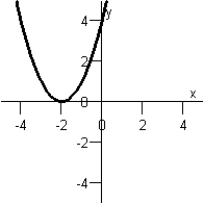
A)
B)
C)
D)
E)
A)
B)
C)
D)
E)
سؤال
سؤال
Use a graphing utility to graph the function and determine whether the function is even, odd, or neither.
A)Neither even nor odd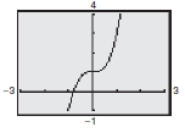
B)Odd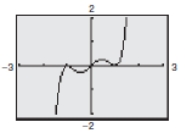
C)Even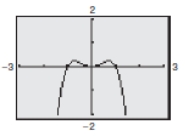
D)Neither even nor odd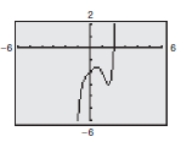
E)Even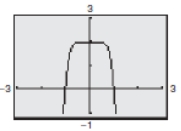
A)Neither even nor odd
B)Odd
C)Even
D)Neither even nor odd
E)Even
سؤال
سؤال
سؤال
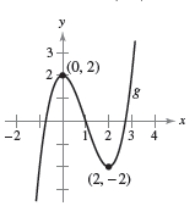
Describe the increasing, decreasing, and constant behavior of the function. Find the point or points where the behavior of the function changes. 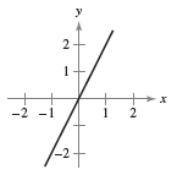
A)Increasing on No change in the graph's behaviour
B)Decreasing on Incresing on The graph's behaviour changes at the point
C)Increasing on and Decresing on The graph's behaviour changes at the points and
D)Decreasing on Increasing on The graph's behaviour changes at the points and
E)Decreasing on Incresing on The graph's behaviour changes at the point
سؤال
Use the graph of to write an equation for the function . 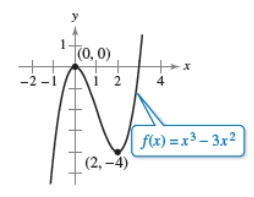
A)The graph is shifted 2 units upward, so
B)The graph is reflected in the x-axis and shifted 1 unit upward, so
C)The graph is shifted 1 unit to the left,so
D)The graph is shifted 2 unit to the left, so
E)The graph is shifted 1 unit to the right
A)The graph is shifted 2 units upward, so
B)The graph is reflected in the x-axis and shifted 1 unit upward, so
C)The graph is shifted 1 unit to the left,so
D)The graph is shifted 2 unit to the left, so
E)The graph is shifted 1 unit to the right
سؤال
Identify the transformation shown in the graph and identify the associated common function. Write the equation of the graphed function. 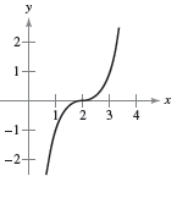
A)Common function: Transformation: horizontal shift 2 units to the rightEquation:
B)Common function: Transformation: multiplied by shrinkingEquation:
C)Common function: Transformation: reflection about the x-axisEquation:
D)Common function: Transformation: is 7.Equation:
E)Common function: Transformation: reflection about the x-axis and a vertical shift 1 unit upwardEquation:
سؤال
Sketch the graph of the function.
A)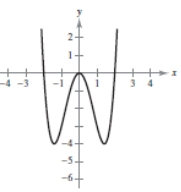
B)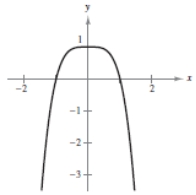
C)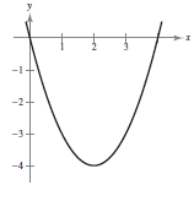
D)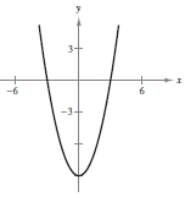
E)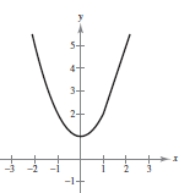
A)
B)
C)
D)
E)
سؤال
Evaluate the function at each specified value of the independent variable.  a) b) c) d)
A)2, 2, -3, -4
B)2, 3, -3, -4
C)2, 2, -2, -4
D)2, 2.5, 2.5, 4
E)2, 2.5, -2.5, -4
a) b) c) d) A)2, 2, -3, -4
B)2, 3, -3, -4
C)2, 2, -2, -4
D)2, 2.5, 2.5, 4
E)2, 2.5, -2.5, -4
سؤال
Sketch the graph of the function. 
A)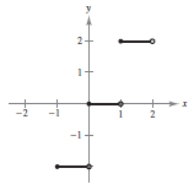
B)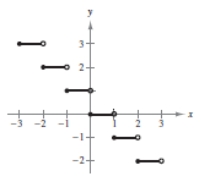
C)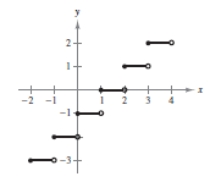
D)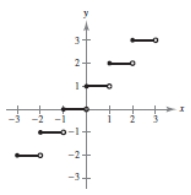
E)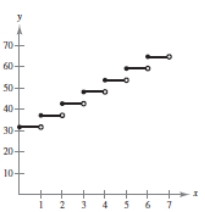
A)
B)
C)
D)
E)

فتح الحزمة
قم بالتسجيل لفتح البطاقات في هذه المجموعة!
Unlock Deck
Unlock Deck
1/96
العب
ملء الشاشة (f)
Deck 3: Functions and Graphs
1
The population (in millions of people) of North America from 1980 to 2050 can be modeled by where represents the year, with corresponding to 2050. Find the y-intercept of the graph of the model. What does it represent in the given situation?
A) It represents the population (in millions of people)of North America in 2020.
B) It represents the population (in millions of people)of North America in 2030.
C) It represents the population (in millions of people)of North America in 2000.
D) It represents the population (in millions of people)of North America in 2010.
E) It represents the population (in millions of people)of North America in 1990.
It represents the population (in millions of people)of North America in 2010.
2
Find an equation of a circle that satisfies the following condition. Write your answer in standard form. Center: ; passing through
A)
B)
C)
D)
E)
A)
B)
C)
D)
E)
3
Find the midpoint of the line segment joining the points. (0, 9), (4, -3)
A)(-2, -3)
B)(3, 2)
C)(6, -2)
D)(-2, 6)
E)(2, 3)
A)(-2, -3)
B)(3, 2)
C)(6, -2)
D)(-2, 6)
E)(2, 3)
(2, 3)
4
Assuming that the graph shown has y-axis symmetry, sketch the complete graph.
A)
B)
C)
D)
E)
A)
B)
C)
D)
E)
فتح الحزمة
افتح القفل للوصول البطاقات البالغ عددها 96 في هذه المجموعة.
فتح الحزمة
k this deck
5
Find the x- and y-intercepts of the graph of the equation below.
A)
B)
C)
D)
E)
A)
B)
C)
D)
E)
فتح الحزمة
افتح القفل للوصول البطاقات البالغ عددها 96 في هذه المجموعة.
فتح الحزمة
k this deck
6
Write the standard form of the equation of the circle whose diameter has endpoints of and .
A)
B)
C)
D)
E)
A)
B)
C)
D)
E)
فتح الحزمة
افتح القفل للوصول البطاقات البالغ عددها 96 في هذه المجموعة.
فتح الحزمة
k this deck
7
Estimate the slope of the line.
A)
B)
C)
D)
E)
A)
B)
C)
D)
E)
فتح الحزمة
افتح القفل للوصول البطاقات البالغ عددها 96 في هذه المجموعة.
فتح الحزمة
k this deck
8
Match the equation below with its graph. Graph I : Graph IV : Graph II : Graph V : Graph III :
A)Graph IV
B)Graph III
C)Graph V
D)Graph II
E)Graph I
Graph IV : Graph II : Graph V : Graph III : A)Graph IV
B)Graph III
C)Graph V
D)Graph II
E)Graph I
فتح الحزمة
افتح القفل للوصول البطاقات البالغ عددها 96 في هذه المجموعة.
فتح الحزمة
k this deck
9
Sketch the graph of the equation below.
A)
B)
C)
D)
E)
A)
B)
C)
D)
E)
فتح الحزمة
افتح القفل للوصول البطاقات البالغ عددها 96 في هذه المجموعة.
فتح الحزمة
k this deck
10
Find the x- and y-intercepts of the graph of the following equation.
A)x-int: ; y-int:
B)x-int: ; y-int:
C)x-int: ; y-int:
D)x-int: ; y-int:
E)x-int: ; y-int:
A)x-int: ; y-int:
B)x-int: ; y-int:
C)x-int: ; y-int:
D)x-int: ; y-int:
E)x-int: ; y-int:
فتح الحزمة
افتح القفل للوصول البطاقات البالغ عددها 96 في هذه المجموعة.
فتح الحزمة
k this deck
11
Plot the points and find the slope of the line passing through the pair of points. (0, 4), (5, 2)
A)slope:
B)slope:
C)slope:
D)slope:
E)slope:
A)slope:
B)slope:
C)slope:
D)slope:
E)slope:
فتح الحزمة
افتح القفل للوصول البطاقات البالغ عددها 96 في هذه المجموعة.
فتح الحزمة
k this deck
12
Find the slope of the line that passes through the points and
A)-9
B)-1
C)1
D)0
E)undefined
A)-9
B)-1
C)1
D)0
E)undefined
فتح الحزمة
افتح القفل للوصول البطاقات البالغ عددها 96 في هذه المجموعة.
فتح الحزمة
k this deck
13
Find the distance between the points. Round to the nearest hundredth, if necessary. (-6, 2), (7, -4)
A)2.24
B)6.08
C)14.32
D)13.15
E)13.6
A)2.24
B)6.08
C)14.32
D)13.15
E)13.6
فتح الحزمة
افتح القفل للوصول البطاقات البالغ عددها 96 في هذه المجموعة.
فتح الحزمة
k this deck
14
Given , use the algebraic tests to determine symmetry with respect to both axes and the origin.
A)y-axis symmetry only
B)x-axis symmetry only
C)origin symmetry only
D)x-axis, y-axis, and origin symmetry
E)no symmetry
A)y-axis symmetry only
B)x-axis symmetry only
C)origin symmetry only
D)x-axis, y-axis, and origin symmetry
E)no symmetry
فتح الحزمة
افتح القفل للوصول البطاقات البالغ عددها 96 في هذه المجموعة.
فتح الحزمة
k this deck
15
Find such that the distance between the point and is 15.
A)
B)
C)
D)
E)
A)
B)
C)
D)
E)
فتح الحزمة
افتح القفل للوصول البطاقات البالغ عددها 96 في هذه المجموعة.
فتح الحزمة
k this deck
16
Plot the points below whose coordinates are given on a Cartesian coordinate system.
A)
B)
C)
D)
E)
A)
B)
C)
D)
E)
فتح الحزمة
افتح القفل للوصول البطاقات البالغ عددها 96 في هذه المجموعة.
فتح الحزمة
k this deck
17
Sketch the graph of the equation below.
A)
B)
C)
D)
E)
A)
B)
C)
D)
E)
فتح الحزمة
افتح القفل للوصول البطاقات البالغ عددها 96 في هذه المجموعة.
فتح الحزمة
k this deck
18
Graph the following equation by plotting points that satisfy the equation.
A)
B)
C)
D)
E)
A)
B)
C)
D)
E)
فتح الحزمة
افتح القفل للوصول البطاقات البالغ عددها 96 في هذه المجموعة.
فتح الحزمة
k this deck
19
After completing the table, use the resulting solution points to sketch the graph of the equation .
. فتح الحزمة
افتح القفل للوصول البطاقات البالغ عددها 96 في هذه المجموعة.
فتح الحزمة
k this deck
20
Given , use the algebraic tests to determine symmetry with respect to both axes and the origin.
A)y-axis symmetry only
B)x-axis symmetry only
C)origin symmetry only
D)x-axis, y-axis, and origin symmetry
E)no symmetry
A)y-axis symmetry only
B)x-axis symmetry only
C)origin symmetry only
D)x-axis, y-axis, and origin symmetry
E)no symmetry
فتح الحزمة
افتح القفل للوصول البطاقات البالغ عددها 96 في هذه المجموعة.
فتح الحزمة
k this deck
21
Determine whether lines L1 and L2 passing through the pairs of points are parallel, perpendicular, or neither. L1 : (-5, -9), (-7, 2)
L2 : (-8, 1), (-19, -1)
A)parallel
B)perpendicular
C)neither
L2 : (-8, 1), (-19, -1)
A)parallel
B)perpendicular
C)neither
فتح الحزمة
افتح القفل للوصول البطاقات البالغ عددها 96 في هذه المجموعة.
فتح الحزمة
k this deck
22
Suppose the average remaining lifetime for women in a given country is given in the following table. Compute the linear regression equation for these data, where x is the age, in years, and A is the remaining lifetime, in years. Round parameters to the nearest hundredth.
A)
B)
C)
D)
E)
A)
B)
C)
D)
E)
فتح الحزمة
افتح القفل للوصول البطاقات البالغ عددها 96 في هذه المجموعة.
فتح الحزمة
k this deck
23
Use the point on the line and the slope of the line to determine whether any of the three additional points lies on the line. Point Slope
I:
II:
III:
A)Only points II and III lie on the line.
B)Only point II lies on the line.
C)Only point III lies on the line.
D)Only points I and II lie on the line.
E)Only points I and III lie on the line.
I:
II:
III:
A)Only points II and III lie on the line.
B)Only point II lies on the line.
C)Only point III lies on the line.
D)Only points I and II lie on the line.
E)Only points I and III lie on the line.
فتح الحزمة
افتح القفل للوصول البطاقات البالغ عددها 96 في هذه المجموعة.
فتح الحزمة
k this deck
24
Use the intercept form to find the equation of the line with the given intercepts. The intercept form of the equation of a line with intercepts (a, 0) and (0, b) is
-intercept: -intercept:
A)x - 4y = 1
B)
C)
D)4x - y = 4
E)x - 4y = -4
-intercept: -intercept:
A)x - 4y = 1
B)
C)
D)4x - y = 4
E)x - 4y = -4
فتح الحزمة
افتح القفل للوصول البطاقات البالغ عددها 96 في هذه المجموعة.
فتح الحزمة
k this deck
25
Write the equation that expresses the relationship between the variables described below, then use the given data to solve for the variation of constant. "y varies directly as , and when "
A) ;
B) ;
C) ;
D) ;
E) ;
A) ;
B) ;
C) ;
D) ;
E) ;
فتح الحزمة
افتح القفل للوصول البطاقات البالغ عددها 96 في هذه المجموعة.
فتح الحزمة
k this deck
26
Find the slope and y-intercept of the equation of the line. -3y - 9x = -12
A)slope: 9; y-intercept: -12
B)slope: -12; y-intercept: 9
C)slope: 9; y-intercept: -3
D)slope: 4; y-intercept: -3
E)slope: -3; y-intercept: 4
A)slope: 9; y-intercept: -12
B)slope: -12; y-intercept: 9
C)slope: 9; y-intercept: -3
D)slope: 4; y-intercept: -3
E)slope: -3; y-intercept: 4
فتح الحزمة
افتح القفل للوصول البطاقات البالغ عددها 96 في هذه المجموعة.
فتح الحزمة
k this deck
27
Find the slope and y-intercept of the equation of the line.
A)slope: ; y-intercept: -4
B)slope: ; y-intercept: 3
C)slope: 3; y-intercept: -4
D)slope: -4; y-intercept: 3
E)slope: 3; y-intercept: 4
A)slope: ; y-intercept: -4
B)slope: ; y-intercept: 3
C)slope: 3; y-intercept: -4
D)slope: -4; y-intercept: 3
E)slope: 3; y-intercept: 4
فتح الحزمة
افتح القفل للوصول البطاقات البالغ عددها 96 في هذه المجموعة.
فتح الحزمة
k this deck
28
Assume that y is directly proportional to x. If and , determine a linear model that relates y and x.
A)
B)
C)
D)
E)
A)
B)
C)
D)
E)
فتح الحزمة
افتح القفل للوصول البطاقات البالغ عددها 96 في هذه المجموعة.
فتح الحزمة
k this deck
29
After opening the parachute, the descent of a parachutist follows a linear model. At 3:31 P.M., the height of the parachutist is 2800 feet. At 3:32 P.M., the height is 1600 feet. Use a linear equation that gives the height of the parachutist in terms of the time to find the time when the parachutist will reach the ground.
A)3:33:40 P.M.
B)3:33:20 P.M.
C)3:32:10 P.M.
D)3:34:00 P.M.
E)3:33:50 P.M.
A)3:33:40 P.M.
B)3:33:20 P.M.
C)3:32:10 P.M.
D)3:34:00 P.M.
E)3:33:50 P.M.
فتح الحزمة
افتح القفل للوصول البطاقات البالغ عددها 96 في هذه المجموعة.
فتح الحزمة
k this deck
30
Find the slope of the line that passes through the points
A)
B)
C)
D)
E)
A)
B)
C)
D)
E)
فتح الحزمة
افتح القفل للوصول البطاقات البالغ عددها 96 في هذه المجموعة.
فتح الحزمة
k this deck
31
Which of the following graphs below can be approximated by a linear model? I II III
A)None can be modeled linearly.
B)Only graph III can be modeled linearly.
C)Only graphs I and II can be modeled linearly.
D)Only graphs I and III can be modeled linearly.
E)Graphs I, II, and III can be modeled linearly.
II III A)None can be modeled linearly.
B)Only graph III can be modeled linearly.
C)Only graphs I and II can be modeled linearly.
D)Only graphs I and III can be modeled linearly.
E)Graphs I, II, and III can be modeled linearly.
فتح الحزمة
افتح القفل للوصول البطاقات البالغ عددها 96 في هذه المجموعة.
فتح الحزمة
k this deck
32
A car was purchased for $42,000. Assuming the car depreciates at a rate of $5040 per year (straight-line depreciation) for the first 5 years, write the value v of the car as a function of the time t (measured in years) for
A)
B)
C)
D)
E)
A)
B)
C)
D)
E)
فتح الحزمة
افتح القفل للوصول البطاقات البالغ عددها 96 في هذه المجموعة.
فتح الحزمة
k this deck
33
The sales tax on an item with a retail price of $612 is $61.20. Create a mathematical model that gives the retail price, y, in terms of the sales tax, x, and use it to determine the retail price of an item that has a sales tax of $70.38.
A)
B)
C)
D)
E)
A)
B)
C)
D)
E)
فتح الحزمة
افتح القفل للوصول البطاقات البالغ عددها 96 في هذه المجموعة.
فتح الحزمة
k this deck
34
The simple interest on an investment is directly proportional to the amount of the investment. By investing $8750 in a certain certificate of deposit, you obtained an interest payment of $210.00 after 1 year. Determine a mathematical model that gives the interest, I, for this CD after 1 year in terms of the amount invested, P.
A)
B)
C)
D)
E)
A)
B)
C)
D)
E)
فتح الحزمة
افتح القفل للوصول البطاقات البالغ عددها 96 في هذه المجموعة.
فتح الحزمة
k this deck
35
Determine whether lines L1 and L2 passing through the pairs of points are parallel, perpendicular, or neither. L1 : (-8, 0), (4, -3)
L2 : (0, 1), (-4, 2)
A)parallel
B)perpendicular
C)neither
L2 : (0, 1), (-4, 2)
A)parallel
B)perpendicular
C)neither
فتح الحزمة
افتح القفل للوصول البطاقات البالغ عددها 96 في هذه المجموعة.
فتح الحزمة
k this deck
36
Graph y as a function of x by finding the slope and y-intercept of the line below.
A)
B)
C)
D)
E)
A)
B)
C)
D)
E)
فتح الحزمة
افتح القفل للوصول البطاقات البالغ عددها 96 في هذه المجموعة.
فتح الحزمة
k this deck
37
Determine whether lines L1 and L2 passing through the pairs of points are parallel, perpendicular, or neither. L1 : (1, 9), (-4, 8)
L2 : (8, -7), (7, -1)
A)parallel
B)perpendicular
C)neither
L2 : (8, -7), (7, -1)
A)parallel
B)perpendicular
C)neither
فتح الحزمة
افتح القفل للوصول البطاقات البالغ عددها 96 في هذه المجموعة.
فتح الحزمة
k this deck
38
Determine if lines and are parallel, perpendicular, or neither.
A)parallel
B)neither
C)perpendicular
A)parallel
B)neither
C)perpendicular
فتح الحزمة
افتح القفل للوصول البطاقات البالغ عددها 96 في هذه المجموعة.
فتح الحزمة
k this deck
39
The table below shows the velocities, in feet per second, of a ball that is thrown horizontally from the top of a 50 foot building and the distances, in feet, that it lands from the base of the building. Compute the linear regression equation for these data.
A)
B)
C)
D)
E)
A)
B)
C)
D)
E)
فتح الحزمة
افتح القفل للوصول البطاقات البالغ عددها 96 في هذه المجموعة.
فتح الحزمة
k this deck
40
Plot the points and find the slope of the line passing through the pair of points. (1, 0), (-2, 0)
A)slope: 0
B)slope: 1
C)slope: -3
D)slope:
E)slope: undefined
A)slope: 0
B)slope: 1
C)slope: -3
D)slope:
E)slope: undefined
فتح الحزمة
افتح القفل للوصول البطاقات البالغ عددها 96 في هذه المجموعة.
فتح الحزمة
k this deck
41
The marketing department of a company estimates that the demand for a product is given by where is the price per unit and is the number of units. The cost of producing units is given by and the profit for producing and selling units is given by Sketch the graph of the profit function and estimate the number of units that would produce a maximum profit.
A)690,000 units
B)650,000 units
C)610,000 units
D)710,000 units
E)580,000 units
A)690,000 units
B)650,000 units
C)610,000 units
D)710,000 units
E)580,000 units
فتح الحزمة
افتح القفل للوصول البطاقات البالغ عددها 96 في هذه المجموعة.
فتح الحزمة
k this deck
42
Sketch the graph of the function below.
A)
B)
C)
D)
E)
A)
B)
C)
D)
E)
فتح الحزمة
افتح القفل للوصول البطاقات البالغ عددها 96 في هذه المجموعة.
فتح الحزمة
k this deck
43
Which set of ordered pairs represents a function from P to Q? P = {5, 10, 15, 20} Q = {-2, 0, 2}
A){(5, -2), (10, 0), (10, 2), (15, 0), (20, -2)}
B){(15, -2), (15, 0), (15, 2)}
C){(15, 0), (10, -2), (5, 0), (10, 2), (15, -2)}
D){(10, 0), (15, 2), (20, 0)}
E){(5, 2), (15, 0), (5, -2), (15, 2)}
A){(5, -2), (10, 0), (10, 2), (15, 0), (20, -2)}
B){(15, -2), (15, 0), (15, 2)}
C){(15, 0), (10, -2), (5, 0), (10, 2), (15, -2)}
D){(10, 0), (15, 2), (20, 0)}
E){(5, 2), (15, 0), (5, -2), (15, 2)}
فتح الحزمة
افتح القفل للوصول البطاقات البالغ عددها 96 في هذه المجموعة.
فتح الحزمة
k this deck
44
Find all real values of x such that f (x) = 0.
A)
B)
C)
D)
E)
A)
B)
C)
D)
E)
فتح الحزمة
افتح القفل للوصول البطاقات البالغ عددها 96 في هذه المجموعة.
فتح الحزمة
k this deck
45
The national defense budget expenses (in billions of dollars) for veterans in the United States from 1990 to 2005 can be approximated by the model where represents the year, with corresponding to 1990. Use the model to find total veteran expenses in 1995.
A)$61.816 billion
B)$37.550 billion
C)$37.364 billion
D)$32.894 billion
E)$44.736 billion
A)$61.816 billion
B)$37.550 billion
C)$37.364 billion
D)$32.894 billion
E)$44.736 billion
فتح الحزمة
افتح القفل للوصول البطاقات البالغ عددها 96 في هذه المجموعة.
فتح الحزمة
k this deck
46
Use the graph of the function to find the domain and range of f.
A) domain :
range :
B)
C)
D) domain : all real numbers
range:
E) domain :
range :
A) domain :
range :
B)
C)
D) domain : all real numbers
range:
E) domain :
range :
فتح الحزمة
افتح القفل للوصول البطاقات البالغ عددها 96 في هذه المجموعة.
فتح الحزمة
k this deck
47
Find the domain of the function.
A)all real numbers
B)all real numbers ,
C)all real numbers
D)y = -9, y = 0
E)y = -9
A)all real numbers
B)all real numbers ,
C)all real numbers
D)y = -9, y = 0
E)y = -9
فتح الحزمة
افتح القفل للوصول البطاقات البالغ عددها 96 في هذه المجموعة.
فتح الحزمة
k this deck
48
Use a graphing utility to graph the function and approximate (to two decimal places) any relative minimum or relative maximum values. f (x) = x3 - x2 - 2x - 1
A)relative maximum: (-0.55, -0.37)relative minimum: (1.22, -3.11)
B)relative maximum: (1.22, -3.11)relative minimum: (-0.55, -0.37)
C)relative maximum: (-0.37, -0.55)relative minimum: (-3.11, 1.22)
D)relative maximum: (-3.11, 1.22)relative minimum: (-0.37, -0.55)
E)relative maximum: (-3.11, -34.62)relative minimum: (-0.37, -0.45)
فتح الحزمة
افتح القفل للوصول البطاقات البالغ عددها 96 في هذه المجموعة.
فتح الحزمة
k this deck
49
The inventor of a new game believes that the variable cost of producing the game is $3.75 per unit and the fixed costs are $5000. The inventor sells each game for $8.99. Let be the number of games sold. Write the average cost per unit as a function of where is defined as the total cost of producing games.
A)
B)
C)
D)
E)
A)
B)
C)
D)
E)
فتح الحزمة
افتح القفل للوصول البطاقات البالغ عددها 96 في هذه المجموعة.
فتح الحزمة
k this deck
50
Find all real values of x such that f (x) = 0.
A)
B)
C)
D)
E)
A)
B)
C)
D)
E)
فتح الحزمة
افتح القفل للوصول البطاقات البالغ عددها 96 في هذه المجموعة.
فتح الحزمة
k this deck
51
Suppose the average remaining lifetime for women in a given country is given in the following table. Find the linear regression equation for these data, whose parameters are rounded to the nearest hundredth, where x is the age, in years, and A is the remaining lifetime, in years. Use the regression equation to estimate the remaining lifetime for a 31-year old woman.
A)42.29 years
B)50.75 years
C)46.99 years
D)55.45 years
E)52.63 years
A)42.29 years
B)50.75 years
C)46.99 years
D)55.45 years
E)52.63 years
فتح الحزمة
افتح القفل للوصول البطاقات البالغ عددها 96 في هذه المجموعة.
فتح الحزمة
k this deck
52
An open box is to be made from a square piece of cardboard having dimensions 22 inches by 22 inches by cutting out squares of area from each corner as shown in the figure below. If the volume of the box is given by state the domain of V .
A)
B)
C)
D)
E)all real numbers
A)
B)
C)
D)
E)all real numbers
فتح الحزمة
افتح القفل للوصول البطاقات البالغ عددها 96 في هذه المجموعة.
فتح الحزمة
k this deck
53
Use the vertical line test to determine if the following graph is the graph of a function.
A)function
B)not a function
A)function
B)not a function
فتح الحزمة
افتح القفل للوصول البطاقات البالغ عددها 96 في هذه المجموعة.
فتح الحزمة
k this deck
54
Given find
A)192
B)-19
C)187
D)-43
E)197
A)192
B)-19
C)187
D)-43
E)197
فتح الحزمة
افتح القفل للوصول البطاقات البالغ عددها 96 في هذه المجموعة.
فتح الحزمة
k this deck
55
Which graph represents the function?
A)
B)
C)
D)
E)
A)
B)
C)
D)
E)
فتح الحزمة
افتح القفل للوصول البطاقات البالغ عددها 96 في هذه المجموعة.
فتح الحزمة
k this deck
56
An open box is to be made from a square piece of cardboard having dimensions 32 inches by 32 inches by cutting out squares of area from each corner as shown in the figure below. Express the volume V of the box as a function of x.
A)
B)
C)
D)
E)
A)
B)
C)
D)
E)
فتح الحزمة
افتح القفل للوصول البطاقات البالغ عددها 96 في هذه المجموعة.
فتح الحزمة
k this deck
57
Given find
A)
B)
C)
D)
E)
A)
B)
C)
D)
E)
فتح الحزمة
افتح القفل للوصول البطاقات البالغ عددها 96 في هذه المجموعة.
فتح الحزمة
k this deck
58
Given find
A)33
B)15
C)51
D)54
E)57
A)33
B)15
C)51
D)54
E)57
فتح الحزمة
افتح القفل للوصول البطاقات البالغ عددها 96 في هذه المجموعة.
فتح الحزمة
k this deck
59
Find the domain of the function.
A)-1 w 1
B)w -1 or w 1
C)w 0
D)w 1
E)all real numbers
A)-1 w 1
B)w -1 or w 1
C)w 0
D)w 1
E)all real numbers
فتح الحزمة
افتح القفل للوصول البطاقات البالغ عددها 96 في هذه المجموعة.
فتح الحزمة
k this deck
60
Evaluate the function at the specified value of the independent variable and simplify. g (s) = -6s + 3; g (-0.2)
A)1.2s - 18
B)-1.8
C)4.2
D)-0.2s + 3
E)-0.2s - 3
A)1.2s - 18
B)-1.8
C)4.2
D)-0.2s + 3
E)-0.2s - 3
فتح الحزمة
افتح القفل للوصول البطاقات البالغ عددها 96 في هذه المجموعة.
فتح الحزمة
k this deck
61
Use the graph of to write an equation for the function whose graph is shown.
A)
B)
C)
D)
E)
A)
B)
C)
D)
E)
فتح الحزمة
افتح القفل للوصول البطاقات البالغ عددها 96 في هذه المجموعة.
فتح الحزمة
k this deck
62
Use a graphing utility to graph the function, approximate the relative minimum or maximum of the function, and estimate the open intervals on which the function is increasing or decreasing.
A) Decreasing on Increasing on Relative minimum:
B) Decreasing on Increasing on Relative maximum:
C) Decreasing on Increasing on Relative minimum: Relative maximum:
D) Decreasing on Increasing on Relative minimum: Relative maximum:
E) Decreasing on Increasing on Relative minimum: Relative maximum:
A)
Decreasing on Increasing on Relative minimum: B)
Decreasing on Increasing on Relative maximum: C)
Decreasing on Increasing on Relative minimum: Relative maximum: D)
Decreasing on Increasing on Relative minimum: Relative maximum: E)
Decreasing on Increasing on Relative minimum: Relative maximum: فتح الحزمة
افتح القفل للوصول البطاقات البالغ عددها 96 في هذه المجموعة.
فتح الحزمة
k this deck
63
The cost of sending an overnight package from New York to Atlanta is $9.80 for up to, but not including, the first pound and $3.50 for each additional pound (or portion of a pound). A model for the total cost of sending the package is where is the weight of the package (in pounds). Sketch the graph of this function. Note that the function is the greatest integer function.
A)
B)
C)
D)
E)
A)
B)
C)
D)
E)
فتح الحزمة
افتح القفل للوصول البطاقات البالغ عددها 96 في هذه المجموعة.
فتح الحزمة
k this deck
64
Use the graph of to write equations for the functions whose graphs are shown.
A)
B)
C)
D)
E)
A)
B)
C)
D)
E)
فتح الحزمة
افتح القفل للوصول البطاقات البالغ عددها 96 في هذه المجموعة.
فتح الحزمة
k this deck
65
Describe the sequence of transformation from to if
A)Shifted seven units to the right and six units upwards.
B)Shifted seven units to the left and six units upwards.
C)Shifted six units to the right and seven units upwards.
D)Shifted six units to the left and seven units upwards.
E)Shifted six units to the right and seven units downwards.
A)Shifted seven units to the right and six units upwards.
B)Shifted seven units to the left and six units upwards.
C)Shifted six units to the right and seven units upwards.
D)Shifted six units to the left and seven units upwards.
E)Shifted six units to the right and seven units downwards.
فتح الحزمة
افتح القفل للوصول البطاقات البالغ عددها 96 في هذه المجموعة.
فتح الحزمة
k this deck
66
Describe the sequence of transformations from to . Then sketch the graph of by hand. Verify with a graphing utility.
A)Shifted 5 units downward
B)Shifted 1 unit upward
C)Shifted 4 units to the left
D)Shifts 3 units to the right
E)4 units to the left and 2 units upward
A)Shifted 5 units downward
B)Shifted 1 unit upward
C)Shifted 4 units to the left
D)Shifts 3 units to the right
E)4 units to the left and 2 units upward
فتح الحزمة
افتح القفل للوصول البطاقات البالغ عددها 96 في هذه المجموعة.
فتح الحزمة
k this deck
67
Consider the graph of Use your knowledge of rigid and nonrigid transformations to write an equation for the following descriptions. The graph of is reflected in the x-axis, shifted eight units to the right, and shifted nine unit downward.
A)
B)
C)
D)
E)
A)
B)
C)
D)
E)
فتح الحزمة
افتح القفل للوصول البطاقات البالغ عددها 96 في هذه المجموعة.
فتح الحزمة
k this deck
68
Describe the sequence of transformations from to . Then sketch the graph of by hand. Verify with a graphing utility.
A)Vertical shifts down 3 units
B)Vertical shifts 2 units upward
C)Horizontal shift 1 unit to the right
D)Horizontal shifts 4 units to the left
E)Vertical shifts 3 units upward
A)Vertical shifts down 3 units
B)Vertical shifts 2 units upward
C)Horizontal shift 1 unit to the right
D)Horizontal shifts 4 units to the left
E)Vertical shifts 3 units upward
فتح الحزمة
افتح القفل للوصول البطاقات البالغ عددها 96 في هذه المجموعة.
فتح الحزمة
k this deck
69
Use the graph of to sketch the graph of .
A)Horizontal shift 2 units to the right
B)Reflection in the x-axis
C)Vertical shift 2 units upward
D)Horizontal shift 3 units to the left
E)Stretching by 2
A)Horizontal shift 2 units to the right
B)Reflection in the x-axis
C)Vertical shift 2 units upward
D)Horizontal shift 3 units to the left
E)Stretching by 2
فتح الحزمة
افتح القفل للوصول البطاقات البالغ عددها 96 في هذه المجموعة.
فتح الحزمة
k this deck
70
Use the graph of to write an equation for the function whose graphs is shown below.
A)
B)
C)
D)
E)
A)
B)
C)
D)
E)
فتح الحزمة
افتح القفل للوصول البطاقات البالغ عددها 96 في هذه المجموعة.
فتح الحزمة
k this deck
71
Consider the graph of Use your knowledge of rigid and nonrigid transformations to write an equation for the following descriptions. The graph of is shifted four units to the right.
A)
B)
C)
D)
E)
A)
B)
C)
D)
E)
فتح الحزمة
افتح القفل للوصول البطاقات البالغ عددها 96 في هذه المجموعة.
فتح الحزمة
k this deck
72
Use a graphing utility to graph the function and determine whether the function is even, odd, or neither.
A)Neither even nor odd
B)Odd
C)Even
D)Neither even nor odd
E)Even
A)Neither even nor odd
B)Odd
C)Even
D)Neither even nor odd
E)Even
فتح الحزمة
افتح القفل للوصول البطاقات البالغ عددها 96 في هذه المجموعة.
فتح الحزمة
k this deck
73
The weekly profit (in hundreds of dollars) for a business from a product is given by the model where is the amount (in hundreds of dollars) spent on advertising. Rewrite the profit equation so that measures advertising expenditures in dollars.
A)
B)
C)
D)
E)
A)
B)
C)
D)
E)
فتح الحزمة
افتح القفل للوصول البطاقات البالغ عددها 96 في هذه المجموعة.
فتح الحزمة
k this deck
74
Decide whether the function is even, odd, or neither.
A)Odd
B)Even
C)Neither even nor odd
A)Odd
B)Even
C)Neither even nor odd
فتح الحزمة
افتح القفل للوصول البطاقات البالغ عددها 96 في هذه المجموعة.
فتح الحزمة
k this deck
75
Describe the increasing, decreasing, and constant behavior of the function. Find the point or points where the behavior of the function changes.
A)Increasing on No change in the graph's behaviour
B)Decreasing on Incresing on The graph's behaviour changes at the point
C)Increasing on and Decresing on The graph's behaviour changes at the points and
D)Decreasing on Increasing on The graph's behaviour changes at the points and
E)Decreasing on Incresing on The graph's behaviour changes at the point
فتح الحزمة
افتح القفل للوصول البطاقات البالغ عددها 96 في هذه المجموعة.
فتح الحزمة
k this deck
76
Use the graph of to write an equation for the function .
A)The graph is shifted 2 units upward, so
B)The graph is reflected in the x-axis and shifted 1 unit upward, so
C)The graph is shifted 1 unit to the left,so
D)The graph is shifted 2 unit to the left, so
E)The graph is shifted 1 unit to the right
A)The graph is shifted 2 units upward, so
B)The graph is reflected in the x-axis and shifted 1 unit upward, so
C)The graph is shifted 1 unit to the left,so
D)The graph is shifted 2 unit to the left, so
E)The graph is shifted 1 unit to the right
فتح الحزمة
افتح القفل للوصول البطاقات البالغ عددها 96 في هذه المجموعة.
فتح الحزمة
k this deck
77
Identify the transformation shown in the graph and identify the associated common function. Write the equation of the graphed function.
A)Common function: Transformation: horizontal shift 2 units to the rightEquation:
B)Common function: Transformation: multiplied by shrinkingEquation:
C)Common function: Transformation: reflection about the x-axisEquation:
D)Common function: Transformation: is 7.Equation:
E)Common function: Transformation: reflection about the x-axis and a vertical shift 1 unit upwardEquation:
فتح الحزمة
افتح القفل للوصول البطاقات البالغ عددها 96 في هذه المجموعة.
فتح الحزمة
k this deck
78
Sketch the graph of the function.
A)
B)
C)
D)
E)
A)
B)
C)
D)
E)
فتح الحزمة
افتح القفل للوصول البطاقات البالغ عددها 96 في هذه المجموعة.
فتح الحزمة
k this deck
79
Evaluate the function at each specified value of the independent variable. a) b) c) d)
A)2, 2, -3, -4
B)2, 3, -3, -4
C)2, 2, -2, -4
D)2, 2.5, 2.5, 4
E)2, 2.5, -2.5, -4
a) b) c) d) A)2, 2, -3, -4
B)2, 3, -3, -4
C)2, 2, -2, -4
D)2, 2.5, 2.5, 4
E)2, 2.5, -2.5, -4
فتح الحزمة
افتح القفل للوصول البطاقات البالغ عددها 96 في هذه المجموعة.
فتح الحزمة
k this deck
80
Sketch the graph of the function.
A)
B)
C)
D)
E)
A)
B)
C)
D)
E)
فتح الحزمة
افتح القفل للوصول البطاقات البالغ عددها 96 في هذه المجموعة.
فتح الحزمة
k this deck
فتح الحزمة
افتح القفل للوصول البطاقات البالغ عددها 96 في هذه المجموعة.


