Deck 6: Statistical Methods in Quality Management
ملء الشاشة (f)
سؤال
سؤال
سؤال
سؤال
سؤال
سؤال
سؤال
سؤال
سؤال
سؤال
سؤال
سؤال
سؤال
سؤال
سؤال
سؤال
سؤال
سؤال
سؤال
سؤال
سؤال
سؤال
سؤال
سؤال
سؤال
سؤال
سؤال
سؤال
سؤال
سؤال
سؤال
سؤال
سؤال
سؤال
سؤال
سؤال
سؤال
سؤال
سؤال
سؤال
سؤال
سؤال
سؤال
Sizzleking Burrito House is a small regional chain of quick service restaurants in the Midwest. They specialize in four types of burritos: chicken, beef, pork, and a bean-based vegetarian item. The burritos are made-to-order, so customers can add rice, cheese, guacamole, tomato, lettuce, and salsa to fill out the wrap. The burrito is then placed in a paper wrapper to ensure ease of handling and sanitary delivery to the customer.
Lately, one of the store managers, Juan Niceley, has been hearing customer complaints, ranging from such comments as: "The tortilla wrap (bread) is too thin, it's breaking"; or "The food is not hot"; "Every time I get a burrito it seems to be a different size"; and "I got the wrong ingredients on my burrito." Juan knew that he needed to systematically survey his customers. Many complaints were submitted through the corporate website. Juan's district manager was most concerned with the comment on size. To be competitive, it is important that customers receive consistent food and service.
Juan knew Professor Evalind at the local university, who taught an MBA class in quality management. He told Juan that he was always looking for projects for his student teams. Juan decided to ask the professor if he would have a team of students design a customer survey, instruct his workforce on how to weigh and record burrito weights, gather customer comments, analyze the data, and make recommendations on what should be done to improve the operations of Sizzleking Burrito House.
The student team developed a survey using the questions in Table 6.3, based on a 5-point Likert scale [5 = excellent, or strongly agree; 1 = poor or strongly disagree] for the first 10 questions. The last two questions were coded as a 1, 2, 3, or 4. They administered the questionnaire to 25 random customers and gathered data on 150 burrito weights in samples of 3, each. See spreadsheet Ch06-Sizzleking Case.xlsx for the data.
TABLE 6.3 Customer Survey Questions
![Sizzleking Burrito House is a small regional chain of quick service restaurants in the Midwest. They specialize in four types of burritos: chicken, beef, pork, and a bean-based vegetarian item. The burritos are made-to-order, so customers can add rice, cheese, guacamole, tomato, lettuce, and salsa to fill out the wrap. The burrito is then placed in a paper wrapper to ensure ease of handling and sanitary delivery to the customer. Lately, one of the store managers, Juan Niceley, has been hearing customer complaints, ranging from such comments as: The tortilla wrap (bread) is too thin, it's breaking; or The food is not hot; Every time I get a burrito it seems to be a different size; and I got the wrong ingredients on my burrito. Juan knew that he needed to systematically survey his customers. Many complaints were submitted through the corporate website. Juan's district manager was most concerned with the comment on size. To be competitive, it is important that customers receive consistent food and service. Juan knew Professor Evalind at the local university, who taught an MBA class in quality management. He told Juan that he was always looking for projects for his student teams. Juan decided to ask the professor if he would have a team of students design a customer survey, instruct his workforce on how to weigh and record burrito weights, gather customer comments, analyze the data, and make recommendations on what should be done to improve the operations of Sizzleking Burrito House. The student team developed a survey using the questions in Table 6.3, based on a 5-point Likert scale [5 = excellent, or strongly agree; 1 = poor or strongly disagree] for the first 10 questions. The last two questions were coded as a 1, 2, 3, or 4. They administered the questionnaire to 25 random customers and gathered data on 150 burrito weights in samples of 3, each. See spreadsheet Ch06-Sizzleking Case.xlsx for the data. TABLE 6.3 Customer Survey Questions What conclusions do you reach when you calculate descriptive statistics for the answers to each of the survey questions in the database?<div style=padding-top: 35px>](https://d2lvgg3v3hfg70.cloudfront.net/SM2938/11eba022_d62e_1b12_8829_fb412027b493_SM2938_00.jpg)
What conclusions do you reach when you calculate descriptive statistics for the answers to each of the survey questions in the database?
Lately, one of the store managers, Juan Niceley, has been hearing customer complaints, ranging from such comments as: "The tortilla wrap (bread) is too thin, it's breaking"; or "The food is not hot"; "Every time I get a burrito it seems to be a different size"; and "I got the wrong ingredients on my burrito." Juan knew that he needed to systematically survey his customers. Many complaints were submitted through the corporate website. Juan's district manager was most concerned with the comment on size. To be competitive, it is important that customers receive consistent food and service.
Juan knew Professor Evalind at the local university, who taught an MBA class in quality management. He told Juan that he was always looking for projects for his student teams. Juan decided to ask the professor if he would have a team of students design a customer survey, instruct his workforce on how to weigh and record burrito weights, gather customer comments, analyze the data, and make recommendations on what should be done to improve the operations of Sizzleking Burrito House.
The student team developed a survey using the questions in Table 6.3, based on a 5-point Likert scale [5 = excellent, or strongly agree; 1 = poor or strongly disagree] for the first 10 questions. The last two questions were coded as a 1, 2, 3, or 4. They administered the questionnaire to 25 random customers and gathered data on 150 burrito weights in samples of 3, each. See spreadsheet Ch06-Sizzleking Case.xlsx for the data.
TABLE 6.3 Customer Survey Questions
What conclusions do you reach when you calculate descriptive statistics for the answers to each of the survey questions in the database?
سؤال
سؤال
سؤال
Many one-tenth scale remote control (RC) model car racing enthusiasts believe that spending more money on high-quality batteries, using expensive gold-plated connectors, and storing batteries at low temperatures will improve battery life performance in a race. To test this hypothesis, an electrical test circuit was constructed to measure battery discharge under different configurations. Each factor (battery type, connector type, and temperature) was evaluated at two levels, resulting in 2 3 = 8 experimental conditions, shown in Table 6.5.
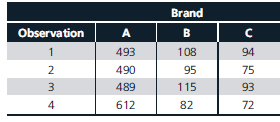
Model race car enthusiasts are also interested in determining whether any significant differences exist between various brands of batteries. Understanding possible differences in battery performance could be a first step in examining whether connection or temperature has an effect on performance. Table 6.6 shows discharge times for three different brands of batteries, gathered through a measurement process.
TABLE 6.5 Experimental Design for Testing Battery Performance
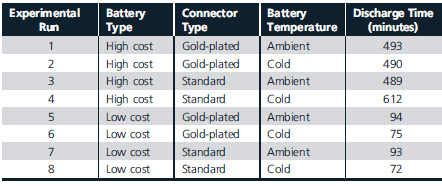
TABLE 6.6 Battery Discharge Time Data by Brand
Use the data in Table 6.5 to find the main effects, interactions, and interaction plots for the three factors (use the Excel template 2x3 Factorial Experiment.xlsx on the Student Companion Site). Thoroughly explain your results.
Model race car enthusiasts are also interested in determining whether any significant differences exist between various brands of batteries. Understanding possible differences in battery performance could be a first step in examining whether connection or temperature has an effect on performance. Table 6.6 shows discharge times for three different brands of batteries, gathered through a measurement process.
TABLE 6.5 Experimental Design for Testing Battery Performance
TABLE 6.6 Battery Discharge Time Data by Brand
Use the data in Table 6.5 to find the main effects, interactions, and interaction plots for the three factors (use the Excel template 2x3 Factorial Experiment.xlsx on the Student Companion Site). Thoroughly explain your results.
سؤال
سؤال
Note: Data sets for many problems in this chapter are available in the Excel workbook C06Data.xlsx on the Student Companion Site. Click on the appropriate worksheet tab as noted in the problem (e.g., Prob. 6-1) to access the data. In addition, the spreadsheet templates illustrated in the chapter are also available to aid in solving many of these problems.
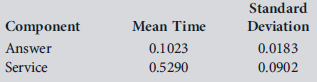
Tessler Electric utility requires service operators to answer telephone calls from customers in an average time of 0.1 minute or less. A sample of 25 actual operator times was drawn, and the results are given in the following table. In addition, operators are expected to determine customer needs and either respond to them or refer the customer to the proper department within 0.5 minute. Another sample of 25 times was taken for this job component and is also given in the table. If these variables can be considered to be independent, are the average times taken to perform each component statistically different from the standards?
Tessler Electric utility requires service operators to answer telephone calls from customers in an average time of 0.1 minute or less. A sample of 25 actual operator times was drawn, and the results are given in the following table. In addition, operators are expected to determine customer needs and either respond to them or refer the customer to the proper department within 0.5 minute. Another sample of 25 times was taken for this job component and is also given in the table. If these variables can be considered to be independent, are the average times taken to perform each component statistically different from the standards?
سؤال
سؤال
سؤال

فتح الحزمة
قم بالتسجيل لفتح البطاقات في هذه المجموعة!
Unlock Deck
Unlock Deck
1/51
العب
ملء الشاشة (f)
Deck 6: Statistical Methods in Quality Management
1
Using one sheet of paper, design and build a helicopter. Some methods of making a paper helicopter can be found at: http://www.exploratorium.edu/science_explorer/roto-copter.html and http://www.faa.gov/education/student_resources/kids_corner/ages_13/paper_helicopter/
Use design of experiments to evaluate and identify the best design that keeps the helicopter airborne for as long as possible.
Use design of experiments to evaluate and identify the best design that keeps the helicopter airborne for as long as possible.
Not Answer
2
Note: Data sets for many problems in this chapter are available in the Excel workbook C06Data.xlsx on the Student Companion Site. Click on the appropriate worksheet tab as noted in the problem (e.g., Prob. 6-1) to access the data. In addition, the spreadsheet templates illustrated in the chapter are also available to aid in solving many of these problems.
Genjeteye, Inc. makes aircraft engines. The mean time to failure has been found to be 100,000 hours and is exponentially distributed.
a. What is the failure rate, ? , per hour?
b. What is the cumulative probability of failure after 10,000 hours or fewer? Between 10,000 and 15,000 hours?
c. If Genjeteye wishes to provide a warranty that no more than 5 percent of the units will fail, how many hours of operation without failure should the company guarantee?
Calculating the probability using exponential distribution:
It is given that, G makes aircraft engines. The mean failure time has been found to be 100,000 hours and is exponentially distributed.a.Calculating the failure rate per hour:
 Hence, is
 .
.
b.Calculating cumulative probability:
It is given that; identify the cumulative probability of failure after 10,000 hours or fewer and between 10,000 and 150,000 hours.
 Excel calculation:

 Excel calculation:
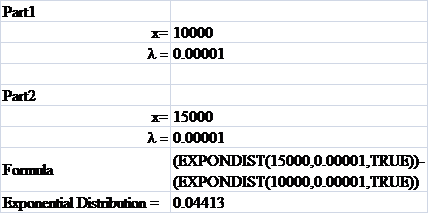 c.Calculating cumulative probability:
It is given that, G wish to provide warranty that no more than 5 percent of units will fail.

 Hence,
 hours is taken for the operation without failure.
It is given that, G makes aircraft engines. The mean failure time has been found to be 100,000 hours and is exponentially distributed.a.Calculating the failure rate per hour:
Hence, is .b.Calculating cumulative probability:
It is given that; identify the cumulative probability of failure after 10,000 hours or fewer and between 10,000 and 150,000 hours.
Excel calculation: Excel calculation: c.Calculating cumulative probability: It is given that, G wish to provide warranty that no more than 5 percent of units will fail.
Hence, hours is taken for the operation without failure. 3
Note: Data sets for many problems in this chapter are available in the Excel workbook C06Data.xlsx on the Student Companion Site. Click on the appropriate worksheet tab as noted in the problem (e.g., Prob. 6-1) to access the data. In addition, the spreadsheet templates illustrated in the chapter are also available to aid in solving many of these problems.
A quality manager at Newvis Pharmaceutical Company is monitoring a process that fills vials with a liquid medication designed to prevent glaucoma in the eyes of the user. The company wants to ensure that each vial contains at least 60 mL (2.03 fluid oz.) of the product. A sample of 25 vials is tested, and a mean of 63 mL and a sample standard deviation of 10 mL are found. The quality manager wishes to test the null hypothesis that vials contain less than or equal to 60 mL using an ? = 0.05 significance level (rejecting this hypothesis provides evidence that the vials contain the required amount). Conduct the test and explain your results.
A quality manager at Newvis Pharmaceutical Company is monitoring a process that fills vials with a liquid medication designed to prevent glaucoma in the eyes of the user. The company wants to ensure that each vial contains at least 60 mL (2.03 fluid oz.) of the product. A sample of 25 vials is tested, and a mean of 63 mL and a sample standard deviation of 10 mL are found. The quality manager wishes to test the null hypothesis that vials contain less than or equal to 60 mL using an ? = 0.05 significance level (rejecting this hypothesis provides evidence that the vials contain the required amount). Conduct the test and explain your results.
Statistical analysis:
It is given that N wants to ensure that each vial contains at least 60 mille of product. Company takes 25 vial samples as test. The mean sample is 63 mille and sample standard deviation is 10 mille. Test the hypothesis at 5 percent level.
Employ "t" test to analysis to identify the service time:
Null hypothesis (H 0 ) : Mean fill volume
 Alternative hypothesis (H 1 ) : Mean fill volume

 Assume that one-tailed distribution with
 .
.
 Hence, the calculated value is
 .
.
Table value
 :
:
 Excel function to calculate table value:
 Hence, the calculated value 1.5 is less than the table value 1.711. So null hypothesis (H 0 ) is accepted and alternative hypothesis (H 1 ) is rejected. It is concluded that the mean fill volumeµ is ? 0.10.
It is given that N wants to ensure that each vial contains at least 60 mille of product. Company takes 25 vial samples as test. The mean sample is 63 mille and sample standard deviation is 10 mille. Test the hypothesis at 5 percent level.
Employ "t" test to analysis to identify the service time:
Null hypothesis (H 0 ) : Mean fill volume
Alternative hypothesis (H 1 ) : Mean fill volume Assume that one-tailed distribution with . Hence, the calculated value is .Table value
: Excel function to calculate table value: Hence, the calculated value 1.5 is less than the table value 1.711. So null hypothesis (H 0 ) is accepted and alternative hypothesis (H 1 ) is rejected. It is concluded that the mean fill volumeµ is ? 0.10. 4
Explain the difference between an experiment, an outcome, and a sample space.
فتح الحزمة
افتح القفل للوصول البطاقات البالغ عددها 51 في هذه المجموعة.
فتح الحزمة
k this deck
5
Explain the difference between a population and a sample.
فتح الحزمة
افتح القفل للوصول البطاقات البالغ عددها 51 في هذه المجموعة.
فتح الحزمة
k this deck
6
Describe some applications of hypothesis testing that might be applied to the topics in Chapters 3, 4, and 5.
فتح الحزمة
افتح القفل للوصول البطاقات البالغ عددها 51 في هذه المجموعة.
فتح الحزمة
k this deck
7
The Turkuman Rug Company buys medium grade carpet in 100-foot rolls. The average number of defects per roll is 1.8. Assuming that these data follow a Poisson distribution, use the Poisson spreadsheet template to answer the following questions.
a. What is the probability of finding exactly 7 defects in a carpet roll chosen at random?
b. What is the probability of finding 4 or fewer defects in a carpet roll?
a. What is the probability of finding exactly 7 defects in a carpet roll chosen at random?
b. What is the probability of finding 4 or fewer defects in a carpet roll?
فتح الحزمة
افتح القفل للوصول البطاقات البالغ عددها 51 في هذه المجموعة.
فتح الحزمة
k this deck
8
Note: Data sets for many problems in this chapter are available in the Excel workbook C06Data.xlsx on the Student Companion Site. Click on the appropriate worksheet tab as noted in the problem (e.g., Prob. 6-1) to access the data. In addition, the spreadsheet templates illustrated in the chapter are also available to aid in solving many of these problems.
Use the data for Twenty-first Century Laundry for the weights of loads of clothes processed through their washing department in a week. (See Prob. 6-11 in C06Data workbook.)
a. Apply the Excel Descriptive Statistics tool to compute the mean, standard deviation, and other relevant statistics, and interpret the results in a meaningful fashion.
b. Use the Frequency Distribution and Histogram Excel template to construct a frequency distribution and histogram for the data. From what type of distribution might you suspect the data are drawn? Experiment with the number of cells to create a visually appealing histogram and use the Excel Histogram tool to verify the results.
فتح الحزمة
افتح القفل للوصول البطاقات البالغ عددها 51 في هذه المجموعة.
فتح الحزمة
k this deck
9
The quality manager at Newvis Pharmaceutical Company is certifying a new process that must produce 90 percent (or better) good product before certification can be completed. A sample of 49 containers from the process line are tested, and 87 percent are found to be good. Formulate the appropriate hypotheses and test them using an ? = 0.05 significance level. Explain your results.
فتح الحزمة
افتح القفل للوصول البطاقات البالغ عددها 51 في هذه المجموعة.
فتح الحزمة
k this deck
10
State the four rules for calculating probabilities of events.
فتح الحزمة
افتح القفل للوصول البطاقات البالغ عددها 51 في هذه المجموعة.
فتح الحزمة
k this deck
11
List the common types of statistical measures of location and explain how to compute them.
فتح الحزمة
افتح القفل للوصول البطاقات البالغ عددها 51 في هذه المجموعة.
فتح الحزمة
k this deck
12
Explain the hypothesis that is tested in analysis of variance.
فتح الحزمة
افتح القفل للوصول البطاقات البالغ عددها 51 في هذه المجموعة.
فتح الحزمة
k this deck
13
Southwestern Punch was made by Frutayuda, Inc. and sold in 12-ounce cans to benefit victims of Hurricane Zero. The mean number of ounces placed in a can by an automatic fill pump is 11.7 with a standard deviation of 0.18 ounce. Assuming a normal distribution, determine the probability that the filling pump will cause an overflow in a can, that is, the probability that more than 12 ounces will be released by the pump and overflow the can.
فتح الحزمة
افتح القفل للوصول البطاقات البالغ عددها 51 في هذه المجموعة.
فتح الحزمة
k this deck
14
Note: Data sets for many problems in this chapter are available in the Excel workbook C06Data.xlsx on the Student Companion Site. Click on the appropriate worksheet tab as noted in the problem (e.g., Prob. 6-1) to access the data. In addition, the spreadsheet templates illustrated in the chapter are also available to aid in solving many of these problems.
The times for carrying out a blood test at River-creek Labs for 100 tests, found in the Prob. 6-12 , in the C06Data Excel workbook, were studied in order to better understand the process. Apply the Descriptive Statistics tool to compute summary statistics and explain the results. Also, construct a frequency distribution and histogram, for the data taken from set. From what type of distribution might you suspect the data are drawn?
The times for carrying out a blood test at River-creek Labs for 100 tests, found in the Prob. 6-12 , in the C06Data Excel workbook, were studied in order to better understand the process. Apply the Descriptive Statistics tool to compute summary statistics and explain the results. Also, construct a frequency distribution and histogram, for the data taken from set. From what type of distribution might you suspect the data are drawn?
فتح الحزمة
افتح القفل للوصول البطاقات البالغ عددها 51 في هذه المجموعة.
فتح الحزمة
k this deck
15
Note: Data sets for many problems in this chapter are available in the Excel workbook C06Data.xlsx on the Student Companion Site. Click on the appropriate worksheet tab as noted in the problem (e.g., Prob. 6-1) to access the data. In addition, the spreadsheet templates illustrated in the chapter are also available to aid in solving many of these problems.
Rabbitfoot Community Bank makes a large number of home equity loans each year. The vice president of loan administration wishes to determine if their time for paperwork processing is lower than the average time of their top competitor. A sample of 30 loans taken at Rabbitfoot Bank yielded a mean of 38.10 minutes and a standard deviation of 2.58 minutes (see the data in the Ch06Data Excel workbook). Data obtained from competitor of 36 applications indicates that the average time for processing an application is 39.48 minutes, with a standard deviation of 2.48 minutes.
a. Verify the calculation of the mean, standard deviation, and variance for each set of data using the Descriptive Statistics tool.
b. Test the null hypothesis that his bank's processing time is greater than or equal to the competitor's average, versus the alternative hypothesis that the bank's time is less than the competitor at the 5 percent significance level. Use the z-Test: Two Sample Assuming Equal Variances from the Data Analysis menu in Excel.
فتح الحزمة
افتح القفل للوصول البطاقات البالغ عددها 51 في هذه المجموعة.
فتح الحزمة
k this deck
16
Explain the multiplication rule of probability. How does independence of events affect the multiplication rule?
فتح الحزمة
افتح القفل للوصول البطاقات البالغ عددها 51 في هذه المجموعة.
فتح الحزمة
k this deck
17
List the common types of statistical measures of dispersion and explain how to compute them.
فتح الحزمة
افتح القفل للوصول البطاقات البالغ عددها 51 في هذه المجموعة.
فتح الحزمة
k this deck
18
Describe some applications of regression and correlation that might be applied to the topics in Chapters 3, 4, and 5.
فتح الحزمة
افتح القفل للوصول البطاقات البالغ عددها 51 في هذه المجموعة.
فتح الحزمة
k this deck
19
Los Alamos Green Tea is sold in 500 milliliter bottles. The standard deviation for the filling process is 7 milliliters. What must the target mean for the process be to ensure that the probability of overfilling more than 500 ml in a bottle is at most 1 percent?
فتح الحزمة
افتح القفل للوصول البطاقات البالغ عددها 51 في هذه المجموعة.
فتح الحزمة
k this deck
20
Note: Data sets for many problems in this chapter are available in the Excel workbook C06Data.xlsx on the Student Companion Site. Click on the appropriate worksheet tab as noted in the problem (e.g., Prob. 6-1) to access the data. In addition, the spreadsheet templates illustrated in the chapter are also available to aid in solving many of these problems.
The data for Prob. 6-13 found in C06Data Excel workbook shows the weight of a set of castings (in kilograms) being made in the Fillmore Metalwork foundry. Construct an Excel spreadsheet to compute the mean and standard deviation using formulas (6.15) and (6.19). Verify your results using Excel functions.
The data for Prob. 6-13 found in C06Data Excel workbook shows the weight of a set of castings (in kilograms) being made in the Fillmore Metalwork foundry. Construct an Excel spreadsheet to compute the mean and standard deviation using formulas (6.15) and (6.19). Verify your results using Excel functions.
فتح الحزمة
افتح القفل للوصول البطاقات البالغ عددها 51 في هذه المجموعة.
فتح الحزمة
k this deck
21
Note: Data sets for many problems in this chapter are available in the Excel workbook C06Data.xlsx on the Student Companion Site. Click on the appropriate worksheet tab as noted in the problem (e.g., Prob. 6-1) to access the data. In addition, the spreadsheet templates illustrated in the chapter are also available to aid in solving many of these problems.
Softswell, a software developer, is trying to determine if any of three potential subcontractors has better programmers in order to outsource a development project. The three subcontractors agreed to test 5 programmers, using a standardized test provided by Softswell, as provided in the data in the Ch06Data Excel workbook. Use the single factor ANOVA Excel tool to determine if there is a significant difference between the scores of programmers at the three contractors at the 5 percent level.
Softswell, a software developer, is trying to determine if any of three potential subcontractors has better programmers in order to outsource a development project. The three subcontractors agreed to test 5 programmers, using a standardized test provided by Softswell, as provided in the data in the Ch06Data Excel workbook. Use the single factor ANOVA Excel tool to determine if there is a significant difference between the scores of programmers at the three contractors at the 5 percent level.
فتح الحزمة
افتح القفل للوصول البطاقات البالغ عددها 51 في هذه المجموعة.
فتح الحزمة
k this deck
22
List the most important types of probability distributions used in quality management.
فتح الحزمة
افتح القفل للوصول البطاقات البالغ عددها 51 في هذه المجموعة.
فتح الحزمة
k this deck
23
Explain how to compute a proportion.
فتح الحزمة
افتح القفل للوصول البطاقات البالغ عددها 51 في هذه المجموعة.
فتح الحزمة
k this deck
24
What is the purpose of design of experiments?
فتح الحزمة
افتح القفل للوصول البطاقات البالغ عددها 51 في هذه المجموعة.
فتح الحزمة
k this deck
25
Kiwi Oil is sold in 950 milliliter (ml) cans. The mean volume of oil placed in a can is 920 ml with a standard deviation of 12 ml. Assuming a normal distribution of the data, what is the probability that the filling machine will cause an overflow in a can, that is, the probability that more than 950 ml will be placed in the can?
فتح الحزمة
افتح القفل للوصول البطاقات البالغ عددها 51 في هذه المجموعة.
فتح الحزمة
k this deck
26
Note: Data sets for many problems in this chapter are available in the Excel workbook C06Data.xlsx on the Student Companion Site. Click on the appropriate worksheet tab as noted in the problem (e.g., Prob. 6-1) to access the data. In addition, the spreadsheet templates illustrated in the chapter are also available to aid in solving many of these problems.
A warehouse manager at Dockhousing, Inc. maintains a large inventory of video games. The company's database states that the mean value of the games in inventory is $50, with a standard deviation of $5. The manager is concerned about pilfering the more expensive games by the warehouse employees. She picked a random sample of 100 games and found the mean value to be $48.50. Assuming a normal distribution, what is the probability that the sample mean would be $48.50 or less if all the inventory can actually be accounted for? What conclusions would you reach?
A warehouse manager at Dockhousing, Inc. maintains a large inventory of video games. The company's database states that the mean value of the games in inventory is $50, with a standard deviation of $5. The manager is concerned about pilfering the more expensive games by the warehouse employees. She picked a random sample of 100 games and found the mean value to be $48.50. Assuming a normal distribution, what is the probability that the sample mean would be $48.50 or less if all the inventory can actually be accounted for? What conclusions would you reach?
فتح الحزمة
افتح القفل للوصول البطاقات البالغ عددها 51 في هذه المجموعة.
فتح الحزمة
k this deck
27
Note: Data sets for many problems in this chapter are available in the Excel workbook C06Data.xlsx on the Student Companion Site. Click on the appropriate worksheet tab as noted in the problem (e.g., Prob. 6-1) to access the data. In addition, the spreadsheet templates illustrated in the chapter are also available to aid in solving many of these problems.
At White Clay Pottery a kiln is used to bake ceramic pottery. The production manager wishes to determine the relationship between temperature and brittleness, so he takes measurements of the brittleness of test items versus the temperature of the oven. (See the data in the Ch06Data Excel workbook.) Use the Excel Regression tool to determine the regression equation and the R 2 value. Explain the output. If the oven is heated to 875°C, what would you predict that the brittleness measure will be?
At White Clay Pottery a kiln is used to bake ceramic pottery. The production manager wishes to determine the relationship between temperature and brittleness, so he takes measurements of the brittleness of test items versus the temperature of the oven. (See the data in the Ch06Data Excel workbook.) Use the Excel Regression tool to determine the regression equation and the R 2 value. Explain the output. If the oven is heated to 875°C, what would you predict that the brittleness measure will be?
فتح الحزمة
افتح القفل للوصول البطاقات البالغ عددها 51 في هذه المجموعة.
فتح الحزمة
k this deck
28
How do discrete probability distributions differ from continuous probability distributions?
فتح الحزمة
افتح القفل للوصول البطاقات البالغ عددها 51 في هذه المجموعة.
فتح الحزمة
k this deck
29
Explain the difference between the standard deviation and the standard error of the mean. How are they related?
فتح الحزمة
افتح القفل للوصول البطاقات البالغ عددها 51 في هذه المجموعة.
فتح الحزمة
k this deck
30
Describe a factorial experiment. Provide some examples of factorial experiments that you might use to solve some type of quality-related problem.
فتح الحزمة
افتح القفل للوصول البطاقات البالغ عددها 51 في هذه المجموعة.
فتح الحزمة
k this deck
31
Note: Data sets for many problems in this chapter are available in the Excel workbook C06Data.xlsx on the Student Companion Site. Click on the appropriate worksheet tab as noted in the problem (e.g., Prob. 6-1) to access the data. In addition, the spreadsheet templates illustrated in the chapter are also available to aid in solving many of these problems.
A new production process at Fabufirst, Inc. has two in-line stages. The probability of defective components being produced in stage 1 is 15 percent and 10 percent in stage 2. Assembled units that have defective components only from stage 1 OR only from stage 2 are considered repairable. However items that have defective components from both stage 1 and stage 2 (completely defective) must be scrapped.
a. Use a probability tree diagram and calculate the probabilities that the Fabufirst assembled units are: (i) defective in stage 1 and defective in stage 2 (are completely defective); (ii) defective in stage 1 and are not defective in stage 2 (called Repairable I); (iii) not defective in stage 1 but are defective in stage 2 (called Repairable II); and (iv) not defective in stage 1 and are not defective in stage 2 (completely good). What is the probability of producing repairable assembled units?
b. Explain the results in terms of the multiplication and the addition rules for probability.
فتح الحزمة
افتح القفل للوصول البطاقات البالغ عددها 51 في هذه المجموعة.
فتح الحزمة
k this deck
32
Wayback Cleaning Co. has found that standard size offices have a standard deviation of 5 minutes for their cleaning time. The operations manager knows that 95 percent of the offices require more than 120 person-minutes to clean. However, she wishes to find out the average cleaning time for the offices. Can you calculate that for her?
فتح الحزمة
افتح القفل للوصول البطاقات البالغ عددها 51 في هذه المجموعة.
فتح الحزمة
k this deck
33
The distribution center manager at Internet distributor CyberAuto Warehouse wants to find a confidence interval for the average time required for an associate to fill an order for shipment. A sample of 16 orders is taken and the mean time was found to be 8.5 minutes, with a standard deviation of 2.8 minutes. Compute 95 percent and 99 percent confidence intervals. Which one is larger? Explain why.
فتح الحزمة
افتح القفل للوصول البطاقات البالغ عددها 51 في هذه المجموعة.
فتح الحزمة
k this deck
34
Note: Data sets for many problems in this chapter are available in the Excel workbook C06Data.xlsx on the Student Companion Site. Click on the appropriate worksheet tab as noted in the problem (e.g., Prob. 6-1) to access the data. In addition, the spreadsheet templates illustrated in the chapter are also available to aid in solving many of these problems.
The process engineer at Sival Electronics was trying to determine whether three suppliers would be equally capable of supplying the mounting boards for the new "gold plated" components that she was testing. The table found in the worksheet Prob. 6-23 in the Excel workbook C06Data shows the coded defect levels for the suppliers, according to the finishes that were tested. Lower defect levels are preferable to higher levels. Using ANOVA, analyze these results. What conclusion can be reached?
The process engineer at Sival Electronics was trying to determine whether three suppliers would be equally capable of supplying the mounting boards for the new "gold plated" components that she was testing. The table found in the worksheet Prob. 6-23 in the Excel workbook C06Data shows the coded defect levels for the suppliers, according to the finishes that were tested. Lower defect levels are preferable to higher levels. Using ANOVA, analyze these results. What conclusion can be reached?
فتح الحزمة
افتح القفل للوصول البطاقات البالغ عددها 51 في هذه المجموعة.
فتح الحزمة
k this deck
35
Devise an experiment similar to the battery performance test case (see the Battery Experiment case that follows) to test different levels of some factor and conduct a statistical analysis of the results. Write up your experiment and results in a report along with the conclusions that you reach from the analysis. You might wish to consult the following paper: "101 Ways to Design an Experiment, or Some Ideas About Teaching Design of Experiments" by William G. Hunter, Technical Report No. 413 dated June 1975 at http://curiouscat.com/bill/101doe.cfm for some ideas.
فتح الحزمة
افتح القفل للوصول البطاقات البالغ عددها 51 في هذه المجموعة.
فتح الحزمة
k this deck
36
List and explain the three basic elements of statistical methodology.
فتح الحزمة
افتح القفل للوصول البطاقات البالغ عددها 51 في هذه المجموعة.
فتح الحزمة
k this deck
37
State the meaning of the central limit theorem in your own words. How important is it to the development and use of statistical quality control techniques?
فتح الحزمة
افتح القفل للوصول البطاقات البالغ عددها 51 في هذه المجموعة.
فتح الحزمة
k this deck
38
Note: Data sets for many problems in this chapter are available in the Excel workbook C06Data.xlsx on the Student Companion Site. Click on the appropriate worksheet tab as noted in the problem (e.g., Prob. 6-1) to access the data. In addition, the spreadsheet templates illustrated in the chapter are also available to aid in solving many of these problems.
A quality analyst at Paintfast Manufacturing Co. wants to determine if a new paint formulation, used to paint parts for a customer's assembly operation will dry fast enough to meet the customer's needs. The customer would prefer to obtain a high level of "dryability" at low temperatures, even if it requires a higher level of drying agent. He hypothesizes that a high level of drying agent will result in high dryability, high temperature-alone-will result in a moderately high level of dryability, and low temperature or a low level of drying agent will result in a low level of dryability. He hopes that the main and interaction effects with the temperature, which is expensive (because an oven would need to be used), will be minimal. The data found in the worksheet Prob. 6-24 in the Excel workbook C06Data were gathered in testing all combinations. What recommendation would you make?
A quality analyst at Paintfast Manufacturing Co. wants to determine if a new paint formulation, used to paint parts for a customer's assembly operation will dry fast enough to meet the customer's needs. The customer would prefer to obtain a high level of "dryability" at low temperatures, even if it requires a higher level of drying agent. He hypothesizes that a high level of drying agent will result in high dryability, high temperature-alone-will result in a moderately high level of dryability, and low temperature or a low level of drying agent will result in a low level of dryability. He hopes that the main and interaction effects with the temperature, which is expensive (because an oven would need to be used), will be minimal. The data found in the worksheet Prob. 6-24 in the Excel workbook C06Data were gathered in testing all combinations. What recommendation would you make?
فتح الحزمة
افتح القفل للوصول البطاقات البالغ عددها 51 في هذه المجموعة.
فتح الحزمة
k this deck
39
What is the science of statistics? Why is it important in quality management?
فتح الحزمة
افتح القفل للوصول البطاقات البالغ عددها 51 في هذه المجموعة.
فتح الحزمة
k this deck
40
Note: Data sets for many problems in this chapter are available in the Excel workbook C06Data.xlsx on the Student Companion Site. Click on the appropriate worksheet tab as noted in the problem (e.g., Prob. 6-1) to access the data. In addition, the spreadsheet templates illustrated in the chapter are also available to aid in solving many of these problems.
The mean time to pour and process 5 cubic yards of concrete by the Piedra Cretebuilders Co. is 15.5 minutes. If 2 percent of the projects with 5 yards of concrete require more than 15.75 minutes, what is the standard deviation of the time for such projects?
The mean time to pour and process 5 cubic yards of concrete by the Piedra Cretebuilders Co. is 15.5 minutes. If 2 percent of the projects with 5 yards of concrete require more than 15.75 minutes, what is the standard deviation of the time for such projects?
فتح الحزمة
افتح القفل للوصول البطاقات البالغ عددها 51 في هذه المجموعة.
فتح الحزمة
k this deck
41
Note: Data sets for many problems in this chapter are available in the Excel workbook C06Data.xlsx on the Student Companion Site. Click on the appropriate worksheet tab as noted in the problem (e.g., Prob. 6-1) to access the data. In addition, the spreadsheet templates illustrated in the chapter are also available to aid in solving many of these problems.
A new product is being tested by Zed Electronics to determine if it will continue to operate in a stable fashion under a variety of conditions. A sample of 400 items were tested, and 60 failed the test. Determine a 90 percent confidence interval for the population proportion.
A new product is being tested by Zed Electronics to determine if it will continue to operate in a stable fashion under a variety of conditions. A sample of 400 items were tested, and 60 failed the test. Determine a 90 percent confidence interval for the population proportion.
فتح الحزمة
افتح القفل للوصول البطاقات البالغ عددها 51 في هذه المجموعة.
فتح الحزمة
k this deck
42
Note: Data sets for many problems in this chapter are available in the Excel workbook C06Data.xlsx on the Student Companion Site. Click on the appropriate worksheet tab as noted in the problem (e.g., Prob. 6-1) to access the data. In addition, the spreadsheet templates illustrated in the chapter are also available to aid in solving many of these problems.
The process engineer at Sival Electronics is also trying to determine whether a newer, more costly design involving a gold alloy in a computer chip is more effective than the present, less expensive silicon design. She wants to obtain an effective output voltage at both high and low temperatures, when tested with high and low signal strength. She hypothesizes that high signal strength will result in higher voltage output, low temperature will result in higher output, and the gold alloy will result in higher output than the silicon material. She hopes that the main and interaction effects with the expensive gold will be minimal. The data found in the worksheet Prob. 6-25 in the Excel workbook C06Data were gathered in testing of all combinations. What recommendation would you make?
The process engineer at Sival Electronics is also trying to determine whether a newer, more costly design involving a gold alloy in a computer chip is more effective than the present, less expensive silicon design. She wants to obtain an effective output voltage at both high and low temperatures, when tested with high and low signal strength. She hypothesizes that high signal strength will result in higher voltage output, low temperature will result in higher output, and the gold alloy will result in higher output than the silicon material. She hopes that the main and interaction effects with the expensive gold will be minimal. The data found in the worksheet Prob. 6-25 in the Excel workbook C06Data were gathered in testing of all combinations. What recommendation would you make?
فتح الحزمة
افتح القفل للوصول البطاقات البالغ عددها 51 في هذه المجموعة.
فتح الحزمة
k this deck
43
Sizzleking Burrito House is a small regional chain of quick service restaurants in the Midwest. They specialize in four types of burritos: chicken, beef, pork, and a bean-based vegetarian item. The burritos are made-to-order, so customers can add rice, cheese, guacamole, tomato, lettuce, and salsa to fill out the wrap. The burrito is then placed in a paper wrapper to ensure ease of handling and sanitary delivery to the customer.
Lately, one of the store managers, Juan Niceley, has been hearing customer complaints, ranging from such comments as: "The tortilla wrap (bread) is too thin, it's breaking"; or "The food is not hot"; "Every time I get a burrito it seems to be a different size"; and "I got the wrong ingredients on my burrito." Juan knew that he needed to systematically survey his customers. Many complaints were submitted through the corporate website. Juan's district manager was most concerned with the comment on size. To be competitive, it is important that customers receive consistent food and service.
Juan knew Professor Evalind at the local university, who taught an MBA class in quality management. He told Juan that he was always looking for projects for his student teams. Juan decided to ask the professor if he would have a team of students design a customer survey, instruct his workforce on how to weigh and record burrito weights, gather customer comments, analyze the data, and make recommendations on what should be done to improve the operations of Sizzleking Burrito House.
The student team developed a survey using the questions in Table 6.3, based on a 5-point Likert scale [5 = excellent, or strongly agree; 1 = poor or strongly disagree] for the first 10 questions. The last two questions were coded as a 1, 2, 3, or 4. They administered the questionnaire to 25 random customers and gathered data on 150 burrito weights in samples of 3, each. See spreadsheet Ch06-Sizzleking Case.xlsx for the data.
TABLE 6.3 Customer Survey Questions
What conclusions do you reach when you calculate descriptive statistics for the answers to each of the survey questions in the database?
فتح الحزمة
افتح القفل للوصول البطاقات البالغ عددها 51 في هذه المجموعة.
فتح الحزمة
k this deck
44
Describe the common types of sampling schemes.
فتح الحزمة
افتح القفل للوصول البطاقات البالغ عددها 51 في هذه المجموعة.
فتح الحزمة
k this deck
45
What are some of the descriptive statistical tools available in Microsoft Excel, and how can they be used?
فتح الحزمة
افتح القفل للوصول البطاقات البالغ عددها 51 في هذه المجموعة.
فتح الحزمة
k this deck
46
Many one-tenth scale remote control (RC) model car racing enthusiasts believe that spending more money on high-quality batteries, using expensive gold-plated connectors, and storing batteries at low temperatures will improve battery life performance in a race. To test this hypothesis, an electrical test circuit was constructed to measure battery discharge under different configurations. Each factor (battery type, connector type, and temperature) was evaluated at two levels, resulting in 2 3 = 8 experimental conditions, shown in Table 6.5.
Model race car enthusiasts are also interested in determining whether any significant differences exist between various brands of batteries. Understanding possible differences in battery performance could be a first step in examining whether connection or temperature has an effect on performance. Table 6.6 shows discharge times for three different brands of batteries, gathered through a measurement process.
TABLE 6.5 Experimental Design for Testing Battery Performance
TABLE 6.6 Battery Discharge Time Data by Brand
Use the data in Table 6.5 to find the main effects, interactions, and interaction plots for the three factors (use the Excel template 2x3 Factorial Experiment.xlsx on the Student Companion Site). Thoroughly explain your results.
فتح الحزمة
افتح القفل للوصول البطاقات البالغ عددها 51 في هذه المجموعة.
فتح الحزمة
k this deck
47
The dimension of a machined part has a nominal specification of 11.9 cm. The process that produces the part can be controlled to have a mean value equal to this specification, but has a standard deviation of 0.05 cm. What is the probability that a part will have a dimension
a. exceeding 12 cm?
b. between 11.9 and 11.95 cm?
c. less than 11.83 cm?
a. exceeding 12 cm?
b. between 11.9 and 11.95 cm?
c. less than 11.83 cm?
فتح الحزمة
افتح القفل للوصول البطاقات البالغ عددها 51 في هذه المجموعة.
فتح الحزمة
k this deck
48
Note: Data sets for many problems in this chapter are available in the Excel workbook C06Data.xlsx on the Student Companion Site. Click on the appropriate worksheet tab as noted in the problem (e.g., Prob. 6-1) to access the data. In addition, the spreadsheet templates illustrated in the chapter are also available to aid in solving many of these problems.
Tessler Electric utility requires service operators to answer telephone calls from customers in an average time of 0.1 minute or less. A sample of 25 actual operator times was drawn, and the results are given in the following table. In addition, operators are expected to determine customer needs and either respond to them or refer the customer to the proper department within 0.5 minute. Another sample of 25 times was taken for this job component and is also given in the table. If these variables can be considered to be independent, are the average times taken to perform each component statistically different from the standards?
Tessler Electric utility requires service operators to answer telephone calls from customers in an average time of 0.1 minute or less. A sample of 25 actual operator times was drawn, and the results are given in the following table. In addition, operators are expected to determine customer needs and either respond to them or refer the customer to the proper department within 0.5 minute. Another sample of 25 times was taken for this job component and is also given in the table. If these variables can be considered to be independent, are the average times taken to perform each component statistically different from the standards?
فتح الحزمة
افتح القفل للوصول البطاقات البالغ عددها 51 في هذه المجموعة.
فتح الحزمة
k this deck
49
Auditors at the Numeros Verdes Partners, P.S.C. took a sample of 200 accounts payable bills, as shown in the table found in the Excel worksheet Prob. 6-2 in the Excel workbook C06Data.xlsx.
a. Find the proportion of the accounts payable in the sample that are classified as overdue by using the Excel COUNTIF function.
b. If an auditor takes a random sample of only 10 accounts from this population, assuming that they follow a binomial distribution, what is the probability that: (i) exactly 5 bills will be overdue? (ii) 4 or fewer bills will be overdue? (iii) 6 or more bills will be overdue? Use the binomial probability distribution formula and verify your result using Excel Binomial spreadsheet template.
فتح الحزمة
افتح القفل للوصول البطاقات البالغ عددها 51 في هذه المجموعة.
فتح الحزمة
k this deck
50
What is the difference between sampling error and systematic error? Why are these important to understand?
فتح الحزمة
افتح القفل للوصول البطاقات البالغ عددها 51 في هذه المجموعة.
فتح الحزمة
k this deck
51
What is a confidence interval? What value do they have?
فتح الحزمة
افتح القفل للوصول البطاقات البالغ عددها 51 في هذه المجموعة.
فتح الحزمة
k this deck
فتح الحزمة
افتح القفل للوصول البطاقات البالغ عددها 51 في هذه المجموعة.


