Deck 16: Quality Control and SPC
ملء الشاشة (f)
سؤال
سؤال
سؤال
سؤال
سؤال
سؤال
سؤال
سؤال
سؤال
سؤال
سؤال
سؤال
سؤال
سؤال
سؤال
سؤال
A cell phone manufacturer has been experiencing physical quality control problems. The back case of phones does not always fit and snap into place on the phone body. The dimensions of the case have constantly been in statistical process control (SPC). To monitor process control, the company uses -charts. Seven samples, each containing three phone cases, were selected from different batches. The data is presented in Table 1 below.
Table 1: Cell Phone Plastic Case Widths in Centimeters Data*
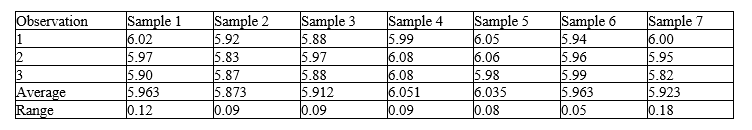
*The sample averages and ranges help avoid simple math errors and quicken the time to complete the SPC analysis.
If
for the
-chart is 1.023, the lower control limit for the
-chart (LCL
) will be:
A) less than or equal to 3.0.
B) greater than 3.0 but less than or equal to 4.0.
C) greater than 4.0 but less than or equal to 5.0.
D) greater than 5.0.
Table 1: Cell Phone Plastic Case Widths in Centimeters Data*
*The sample averages and ranges help avoid simple math errors and quicken the time to complete the SPC analysis.
If
for the
-chart is 1.023, the lower control limit for the
-chart (LCL
) will be:
A) less than or equal to 3.0.
B) greater than 3.0 but less than or equal to 4.0.
C) greater than 4.0 but less than or equal to 5.0.
D) greater than 5.0.
سؤال
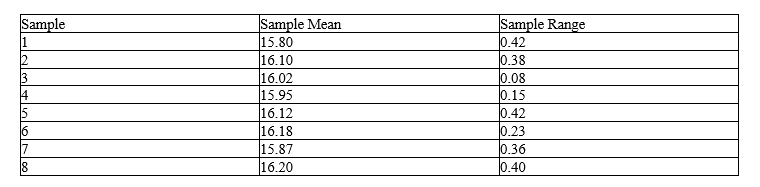
A detergent company periodically tests its products for variations in the fill weight. To do this, the company uses -charts. Eight samples, each containing six detergent boxes, were selected from different batches. Historical data for fill weight (in ounces) of the eight samples is presented below.
 If A2>for the
-chart is 0.483, the upper control limit for the
-chart (UCL
) will be:
A) less than or equal to 14.
B) more than 14 but less than or equal to 16.
C) more than 16 but less than or equal to 18.
D) more than 18.
If A2>for the-chart is 0.483, the upper control limit for the
-chart (UCL
) will be:
A) less than or equal to 14.
B) more than 14 but less than or equal to 16.
C) more than 16 but less than or equal to 18.
D) more than 18.
سؤال
سؤال
سؤال
سؤال
سؤال
سؤال
سؤال
سؤال

فتح الحزمة
قم بالتسجيل لفتح البطاقات في هذه المجموعة!
Unlock Deck
Unlock Deck
1/25
العب
ملء الشاشة (f)
Deck 16: Quality Control and SPC
1
The value of the process capability index, (Cp), depends on the mean of the process.
False
2
The relationship between the natural variation and specifications is quantified by a measure known as the _____.
A) net promoter score
B) process capability index
C) net detractor score
D) process design index
A) net promoter score
B) process capability index
C) net detractor score
D) process design index
process capability index
3
Which of the following is true of control charts
A) Control charts can only be used for processes that have a very high sigma level.
B) The use of small sample sizes in control charts increases the chances that a process may have changed during the sampling interval.
C) Conventional statistical process control charts have the lowest frequency of false alarms.
D) Standard control charts are not effective when the rate of defects is extremely low.
Standard control charts are not effective when the rate of defects is extremely low.
4
A bottling machine fills water bottles with an average of 12.000 ounces of water. The standard deviation is 0.002 ounces. If the design specification for the fill weight of the bottles is 12.000 ounces plus or minus 0.015 ounces, calculate the process capability index of the machine.
A) Less than or equal to 1
B) More than 1 but less than or equal to 2
C) More than 2 but less than or equal to 3
D) More than 4
A) Less than or equal to 1
B) More than 1 but less than or equal to 2
C) More than 2 but less than or equal to 3
D) More than 4
فتح الحزمة
افتح القفل للوصول البطاقات البالغ عددها 25 في هذه المجموعة.
فتح الحزمة
k this deck
5
The task of__________is to ensure that a good or service conforms to specifications and meets customer requirements by monitoring and measuring processes and making any necessary adjustments to maintain a specified level of performance.
A) job design
B) visual control
C) quality control
D) forecasting
A) job design
B) visual control
C) quality control
D) forecasting
فتح الحزمة
افتح القفل للوصول البطاقات البالغ عددها 25 في هذه المجموعة.
فتح الحزمة
k this deck
6
In the context of the net promoter score (NPS), scores of 7 or 8 are associated with__________, customers who are satisfied but may switch to competitors.
A) detractors
B) passives
C) promoters
D) proponents
A) detractors
B) passives
C) promoters
D) proponents
فتح الحزمة
افتح القفل للوصول البطاقات البالغ عددها 25 في هذه المجموعة.
فتح الحزمة
k this deck
7
Keeping special cause variation from occurring is the essence of statistical quality control.
فتح الحزمة
افتح القفل للوصول البطاقات البالغ عددها 25 في هذه المجموعة.
فتح الحزمة
k this deck
8
Which of the following is true of common cause variation
A) It can be controlled and described using nonstatistical methods.
B) It appears at random, and individual sources cannot be identified or explained.
C) It accounts for about 10 to 15 percent of the observed variation in a process.
D) It arises from external sources that are not inherent in a process.
فتح الحزمة
افتح القفل للوصول البطاقات البالغ عددها 25 في هذه المجموعة.
فتح الحزمة
k this deck
9
The 1:10:100 Rule states that if a defect is first detected during the production process, it might cost $1 to fix.
فتح الحزمة
افتح القفل للوصول البطاقات البالغ عددها 25 في هذه المجموعة.
فتح الحزمة
k this deck
10
The time taken for guests to check out at a hotel front desk was measured over the course of several weeks. The management believes that the target time for checking out guests should be between 2 and 3 minutes with a target of 2.5 minutes. The data gathered for the actual process had a mean time of 2.75 minutes with a standard deviation of 0.45 minutes. The process capability index will be:
A) less than or equal to 1.
B) more than 3 but less than or equal to 5.
C) more than 4 but less than or equal to 5.
D) more than 5.
A) less than or equal to 1.
B) more than 3 but less than or equal to 5.
C) more than 4 but less than or equal to 5.
D) more than 5.
فتح الحزمة
افتح القفل للوصول البطاقات البالغ عددها 25 في هذه المجموعة.
فتح الحزمة
k this deck
11
In the context of designing control charts, which of the following is true of a sample size
A) A large sample allows small changes in process characteristics to be detected with higher probability than a small sample size.
B) A small sample is used to detect process shifts of two standard deviations or smaller.
C) A large sample size is desirable to keep the cost associated with sampling low.
D) A small sample size provides greater degrees of statistical accuracy in estimating the true state of control than a large sample size.
فتح الحزمة
افتح القفل للوصول البطاقات البالغ عددها 25 في هذه المجموعة.
فتح الحزمة
k this deck
12
In the context of quality control practices in manufacturing, if supplier documentation is done properly, incoming inspection can be completely eliminated.
فتح الحزمة
افتح القفل للوصول البطاقات البالغ عددها 25 في هذه المجموعة.
فتح الحزمة
k this deck
13
The lower and upper specification limits for a mustard filling machine are 10.50 and 12.00 ounces, respectively. The standard deviation is 0.05. The process capability index of the machine will be:
A) less than or equal to 3.
B) more than 3 but less than or equal to 5.
C) more than 4 but less than or equal to 5.
D) more than 5.
A) less than or equal to 3.
B) more than 3 but less than or equal to 5.
C) more than 4 but less than or equal to 5.
D) more than 5.
فتح الحزمة
افتح القفل للوصول البطاقات البالغ عددها 25 في هذه المجموعة.
فتح الحزمة
k this deck
14
In the context of the net promoter score (NPS), scores of 6 or below represent__________, unhappy customers who may spread negative comments.
A) detractors
B) passives
C) promoters
D) campaigners
A) detractors
B) passives
C) promoters
D) campaigners
فتح الحزمة
افتح القفل للوصول البطاقات البالغ عددها 25 في هذه المجموعة.
فتح الحزمة
k this deck
15
In the context of statistical process control and variation, if no special causes affect the output of a process, we say that the process is__________.
A) inconsistent
B) out of control
C) in control
D) overadjusted
A) inconsistent
B) out of control
C) in control
D) overadjusted
فتح الحزمة
افتح القفل للوصول البطاقات البالغ عددها 25 في هذه المجموعة.
فتح الحزمة
k this deck
16
A cell phone manufacturer has been experiencing physical quality control problems. The back case of phones does not always fit and snap into place on the phone body. The dimensions of the case have constantly been in statistical process control (SPC). To monitor process control, the company uses -charts. Seven samples, each containing three phone cases, were selected from different batches. The data is presented in Table 1 below.
Table 1: Cell Phone Plastic Case Widths in Centimeters Data*
*The sample averages and ranges help avoid simple math errors and quicken the time to complete the SPC analysis.
If
for the
-chart is 1.023, the lower control limit for the
-chart (LCL
) will be:
A) less than or equal to 3.0.
B) greater than 3.0 but less than or equal to 4.0.
C) greater than 4.0 but less than or equal to 5.0.
D) greater than 5.0.
فتح الحزمة
افتح القفل للوصول البطاقات البالغ عددها 25 في هذه المجموعة.
فتح الحزمة
k this deck
17
A detergent company periodically tests its products for variations in the fill weight. To do this, the company uses -charts. Eight samples, each containing six detergent boxes, were selected from different batches. Historical data for fill weight (in ounces) of the eight samples is presented below.
If A2>for the
-chart is 0.483, the upper control limit for the
-chart (UCL
) will be:
A) less than or equal to 14.
B) more than 14 but less than or equal to 16.
C) more than 16 but less than or equal to 18.
D) more than 18.
If A2>for the-chart is 0.483, the upper control limit for the
-chart (UCL
) will be:
A) less than or equal to 14.
B) more than 14 but less than or equal to 16.
C) more than 16 but less than or equal to 18.
D) more than 18.
فتح الحزمة
افتح القفل للوصول البطاقات البالغ عددها 25 في هذه المجموعة.
فتح الحزمة
k this deck
18
Customer waiting time and order lead time are examples of__________.
A) discrete metrics
B) countable metrics
C) isolated metrics
D) continuous metrics
A) discrete metrics
B) countable metrics
C) isolated metrics
D) continuous metrics
فتح الحزمة
افتح القفل للوصول البطاقات البالغ عددها 25 في هذه المجموعة.
فتح الحزمة
k this deck
19
In-process control is typically performed by people who run the back-end processes.
فتح الحزمة
افتح القفل للوصول البطاقات البالغ عددها 25 في هذه المجموعة.
فتح الحزمة
k this deck
20
An operator wants to determine the standard deviation for a machine she operates. To do this, she wants to create a p-chart. Over a month's time, she collects 30 samples of 75 observations each and records the number of errors. The average proportion defective is found to be 0.024. Which of the following is the standard deviation ( ) of the machine
A) Less than or equal to 0.1
B) More than 0.1 but less than or equal to 0.5
C) More than 0.5 but less than or equal to 1.0
D) More than 1.0
A) Less than or equal to 0.1
B) More than 0.1 but less than or equal to 0.5
C) More than 0.5 but less than or equal to 1.0
D) More than 1.0
فتح الحزمة
افتح القفل للوصول البطاقات البالغ عددها 25 في هذه المجموعة.
فتح الحزمة
k this deck
21
Which of the following is true of special cause variation
A) It cannot be explained or understood.
B) It occurs sporadically and can be prevented.
C) It cannot be detected using statistical methods.
D) It accounts for about 80 to 95 percent of the observed variation in a process.
A) It cannot be explained or understood.
B) It occurs sporadically and can be prevented.
C) It cannot be detected using statistical methods.
D) It accounts for about 80 to 95 percent of the observed variation in a process.
فتح الحزمة
افتح القفل للوصول البطاقات البالغ عددها 25 في هذه المجموعة.
فتح الحزمة
k this deck
22
Which of the following is the upper control limit for a c-chart (UCL c) with the average number of nonconformances per unit equal to 7
A) More than 11 but less than or equal to 12
B) More than 12 but less than or equal to 13
C) More than 13 but less than or equal to 14
D) More than 14 but less than or equal to 15
A) More than 11 but less than or equal to 12
B) More than 12 but less than or equal to 13
C) More than 13 but less than or equal to 14
D) More than 14 but less than or equal to 15
فتح الحزمة
افتح القفل للوصول البطاقات البالغ عددها 25 في هذه المجموعة.
فتح الحزمة
k this deck
23
If a process has a process capability index value (C p) of less than 1, it means that:
A) a significant percentage of output will not conform to the design specifications.
B) both the lower and upper specification limits are met.
C) the observed variation is the same as the design specification width.
D) the process is very capable of meeting the upper specification limit.
A) a significant percentage of output will not conform to the design specifications.
B) both the lower and upper specification limits are met.
C) the observed variation is the same as the design specification width.
D) the process is very capable of meeting the upper specification limit.
فتح الحزمة
افتح القفل للوصول البطاقات البالغ عددها 25 في هذه المجموعة.
فتح الحزمة
k this deck
24
Jim, a quality control manager at an apparel manufacturing company, studies and monitors quality using R-charts. He discovers a quality problem with the construction of zippers. Jim proposes that 25 samples of eight observations each be collected on a daily basis. He plans to prepare an R-chart to monitor the variation in the size of the zippers. The data collected shows that the mean length of the zippers is 15 inches and the average range is 0.5 inches. If D 3 for the R-chart is 0.136, the lower control limit (LCL R) for the R-chart will be:
A) less than or equal to 1.
B) more than 1 but less than or equal to 2.
C) more than 2 but less than or equal to 3.
D) more than 4.
A) less than or equal to 1.
B) more than 1 but less than or equal to 2.
C) more than 2 but less than or equal to 3.
D) more than 4.
فتح الحزمة
افتح القفل للوصول البطاقات البالغ عددها 25 في هذه المجموعة.
فتح الحزمة
k this deck
25
A salon and spa chain periodically analyzes its service times to check for variation in service processes. To do this, it uses R-charts. Seven samples, each containing observed service time with three different customers, were collected. The average mean and the average range of the service times are found to be 9.924 and 0.957, respectively. If D 4 for the R-chart is 1.924, the upper control limit ( ) for the R-chart will be:
A) less than or equal to 1.0.
B) greater than 1.0 but less than or equal to 1.5.
C) greater than 1.5 but less than or equal to 2.0.
D) greater than 2.0 but less than or equal to 2.5.
A) less than or equal to 1.0.
B) greater than 1.0 but less than or equal to 1.5.
C) greater than 1.5 but less than or equal to 2.0.
D) greater than 2.0 but less than or equal to 2.5.
فتح الحزمة
افتح القفل للوصول البطاقات البالغ عددها 25 في هذه المجموعة.
فتح الحزمة
k this deck
فتح الحزمة
افتح القفل للوصول البطاقات البالغ عددها 25 في هذه المجموعة.


