Deck 9: Spreadsheet Models
ملء الشاشة (f)
سؤال
The Cobb-Douglas production function is a classic model from economics used to model output as a function of capital and labor. It has the form
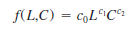
where c 0 , c 1, and c 2 are constants. The variable L represents the units of input of labor, and the variable C represents the units of input of capital.
a. In this example, assume c 0 5 5, c 1 5 0.25, and c 2 5 0.75. Assume each unit of labor costs $25 and each unit of capital costs $75. With $75,000 available in the budget, develop an optimization model to determine how the budgeted amount should be allocated between capital and labor in order to maximize output.
b. Find the optimal solution to the model you formulated in part a. ( Hint: When using Excel Solver, use the Multistart option with bounds 0 # L # 3000 and 0 # C # 1000.)
سؤال
As discussed in Section 10.4, the Markowitz Model uses the variance of the portfolio as the measure of risk. However, variance includes deviations both below and above the mean return. Semivariance includes only deviations below the mean and is considered by many to be a better measure of risk.
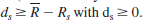
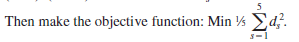
a. Develop a model that minimizes semivariance for the Hauck Financial data given in the file HauckData with a required return of 10 percent. ( Hint: Modify model (10.8)-(10.17). Define a variable d s for each
scenario and let
 .
.
b. Solve the model you developed in part a with a required expected return of 10 percent.
a. Develop a model that minimizes semivariance for the Hauck Financial data given in the file HauckData with a required return of 10 percent. ( Hint: Modify model (10.8)-(10.17). Define a variable d s for each
scenario and let
. b. Solve the model you developed in part a with a required expected return of 10 percent.
سؤال
Let S represent the amount of steel produced (in tons). Steel production is related to the amount of labor used ( L ) and the amount of capital used ( C ) by the following function:
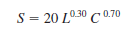
In this formula L represents the units of labor input and C the units of capital input. Each unit of labor costs $50, and each unit of capital costs $100.
a. Formulate an optimization problem that will determine how much labor and capital are needed to produce 50,000 tons of steel at minimum cost.
b. Solve the optimization problem you formulated in part a. ( Hint: When using Excel Solver, start with an initial L. 0 and C 0.)
سؤال
سؤال
The profit function for two products is:

where x 1 represents units of production of product 1, and x 2 represents units of production of product 2.
Producing one unit of product 1 requires 4 labor-hours, and producing one unit of product 2 requires 6 labor-hours. Currently, 24 labor-hours are available. The cost of labor-hours is already factored into the profit function, but it is possible to schedule overtime at a premium of $5 per hour.
a. Formulate an optimization problem that can be used to find the optimal production quantity of products 1 and 2 and the optimal number of overtime hours to schedule.
b. Solve the optimization model you formulated in part a. How much should be produced and how many overtime hours should be scheduled
سؤال
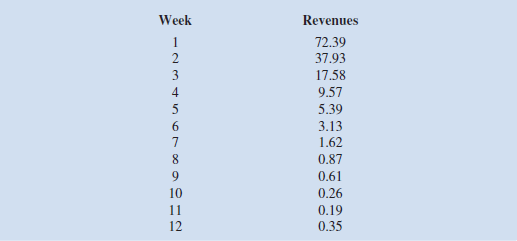
The weekly box office revenues (in $ millions) for the summer blockbuster movie discussed in Section 10.5 follow. Use these data in the Bass forecasting model given by equations (10.19)-(10.21) to estimate the parameters p, q , and m.
The Bass forecasting model is a good example of a difficult-to-solve nonlinear program, and the answer you get may be a local optimum that is not nearly as good as the result given in Table 10.4. Solve the model using Excel Solver with the Multistart option, and see whether you can duplicate the results in Table 10.4.
The Bass forecasting model is a good example of a difficult-to-solve nonlinear program, and the answer you get may be a local optimum that is not nearly as good as the result given in Table 10.4. Solve the model using Excel Solver with the Multistart option, and see whether you can duplicate the results in Table 10.4.
سؤال
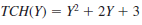
Jim's Camera shop sells two high-end cameras, the Sky Eagle and Horizon. The demand for these two cameras are as follows: D S 5 demand for the Sky Eagle, P S is the selling price of the Sky Eagle, D H is the demand for the Horizon, and P H is the selling price of the
Horizon.
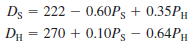
The store wishes to determine the selling price that maximizes revenue for these two products. Develop the revenue function for these two models, and find the revenue maximizing prices.
Horizon.
The store wishes to determine the selling price that maximizes revenue for these two products. Develop the revenue function for these two models, and find the revenue maximizing prices.
سؤال
Heller Manufacturing has two production facilities that manufacture baseball gloves. Production costs at the two facilities differ because of varying labor rates, local property taxes, type of equipment, capacity, and so on. The Dayton plant has weekly costs that can be expressed as a function of the number of gloves produced:
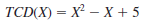
where X is the weekly production volume in thousands of units, and TCD ( X ) is the cost in thousands of dollars. The Hamilton plant's weekly production costs are given by
where Y is the weekly production volume in thousands of units, and TCH ( Y ) is the cost in thousands of dollars. Heller Manufacturing would like to produce 8000 gloves per week at the lowest possible cost.
a. Formulate a mathematical model that can be used to determine the optimal number of gloves to produce each week at each facility.
b. Solve the optimization model to determine the optimal number of gloves to produce at each facility.
سؤال
Many forecasting models use parameters that are estimated using nonlinear optimization. A good example is the Bass model introduced in this chapter. Another example is the exponential smoothing forecasting model discussed in Chapter 5. The exponential smoothing model is common in practice and is described in further detail in Chapter 5. For
instance, the basic exponential smoothing model for forecasting sales is
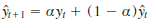
Where
This model is used recursively; the forecast for time period t 1 1 is based on the forecast for period t,
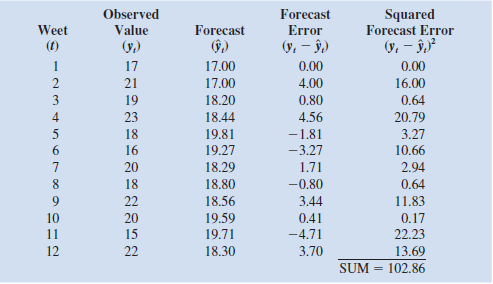
 , the observed value of sales in period t , y t , and the smoothing parameter _. The use of this model to forecast sales for 12 months is illustrated in the following table with the smoothing constant _ 5 0.3. The forecast errors,
 , are calculated in the fourth column. The value of _ is often chosen by minimizing the sum of squared forecast errors. The last column of the table shows the square of the forecast error and the sum of squared forecast errors. In using exponential smoothing models, one tries to choose the value of _ that provides the best forecasts.
a. The file ExpSmooth contains the observed data shown here. Construct this table using the formula above. Note that we set the forecast in period 1 to the observed in period 1 to get started
 = 17 then the formula above for
 is used starting in period 2. Make sure to have a single cell corresponding to _ in your spreadsheet model. After confirming the values in the table below with _ 5 0.3, try different values of _ to see if you can get a smaller sum of squared forecast errors.
b. Use Excel Solver to find the value of _ that minimizes the sum of squared forecast errors.
instance, the basic exponential smoothing model for forecasting sales is
Where
This model is used recursively; the forecast for time period t 1 1 is based on the forecast for period t,
, the observed value of sales in period t , y t , and the smoothing parameter _. The use of this model to forecast sales for 12 months is illustrated in the following table with the smoothing constant _ 5 0.3. The forecast errors, , are calculated in the fourth column. The value of _ is often chosen by minimizing the sum of squared forecast errors. The last column of the table shows the square of the forecast error and the sum of squared forecast errors. In using exponential smoothing models, one tries to choose the value of _ that provides the best forecasts.a. The file ExpSmooth contains the observed data shown here. Construct this table using the formula above. Note that we set the forecast in period 1 to the observed in period 1 to get started
= 17 then the formula above for is used starting in period 2. Make sure to have a single cell corresponding to _ in your spreadsheet model. After confirming the values in the table below with _ 5 0.3, try different values of _ to see if you can get a smaller sum of squared forecast errors.b. Use Excel Solver to find the value of _ that minimizes the sum of squared forecast errors.
سؤال
Andalus Furniture Company has two manufacturing plants, one at Aynor and another at Spartanburg. The cost in dollars of producing a kitchen chair at each of the two plants is given here. The cost of producing Q 1 chairs at Aynor is:
and the cost of producing Q 2 kitchen chairs at Spartanburg is
Andalus needs to manufacture a total of 40 kitchen chairs to meet an order just received. How many chairs should be made at Aynor, and how many should be made at Spartanburg in order to minimize total production cost
and the cost of producing Q 2 kitchen chairs at Spartanburg is
Andalus needs to manufacture a total of 40 kitchen chairs to meet an order just received. How many chairs should be made at Aynor, and how many should be made at Spartanburg in order to minimize total production cost
سؤال
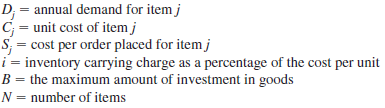
The economic order quantity (EOQ) model is a classical model used for controlling inventory and satisfying demand. Costs included in the model are holding cost per unit, ordering cost, and the cost of goods ordered. The assumptions for that model are that only
a single item is considered, that the entire quantity ordered arrives at one time, that the demand for the item is constant over time, and that no shortages are allowed. Suppose we relax the first assumption and allow for multiple items that are independent except for a budget restriction. The following model describes this situation:
Let
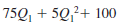
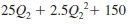
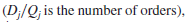
The decision variables are Q j , the amount of item j to order. The model is:
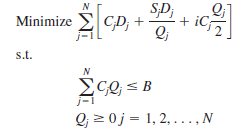
In the objective function, the first term is the annual cost of goods, the second is the annual ordering cost
 and the last term is the annual inventory holding cost

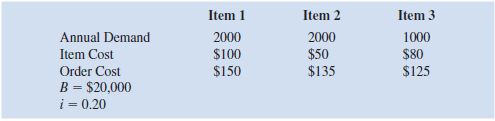
a. Set up a spreadsheet model and for the following data:
b. Solve the problem using Excel Solver. ( Hint: For Solver to find a solution, you need to start with decision variable values that are greater than 0.)
a single item is considered, that the entire quantity ordered arrives at one time, that the demand for the item is constant over time, and that no shortages are allowed. Suppose we relax the first assumption and allow for multiple items that are independent except for a budget restriction. The following model describes this situation:
Let
The decision variables are Q j , the amount of item j to order. The model is:
In the objective function, the first term is the annual cost of goods, the second is the annual ordering cost
and the last term is the annual inventory holding cost a. Set up a spreadsheet model and for the following data:
b. Solve the problem using Excel Solver. ( Hint: For Solver to find a solution, you need to start with decision variable values that are greater than 0.)
سؤال
Phillips Inc. produces two distinct products, A and B. The products do not compete with each other in the marketplace; that is, neither cost, price, nor demand for one product will impact the demand for the other. Phillips' analysts have collected data on the effects of advertising on profits. These data suggest that, although higher advertising correlates with higher profits, the marginal increase in profits diminishes at highe advertising levels, particularly for Product B. Analysts have estimated the following functions:
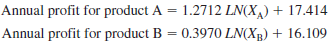
where X A and X B are the advertising amount allocated to products A and B, respectively, in thousands of dollars, profit is in millions of dollars, and LN is the natural logarithm function. The advertising budget is $500,000, and management has dictated that at least $50,000 must be allocated to each of the two products.
( Hint: To compute a natural logarithm for the value X in Excel, use the formula 5 LN ( X ). For Solver to find an answer, you also need to start with decision variable values greater than 0 in this problem.)
. Build an optimization model that will prescribe how Phillips should allocate its marketing budget to maximize profit.
b. Solve the model you constructed in part a using Excel Solver.
سؤال
سؤال
TN Communications provides cellular telephone services. The company is planning to expand into the Cincinnati area and is trying to determine the best location for its trans- mission tower. The tower transmits over a radius of 10 miles. The locations that must be reached by this tower are shown in the following figure.
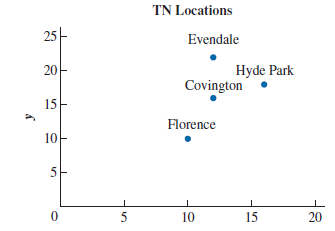
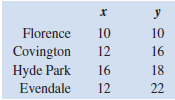
TN Communications would like to find the tower location that reaches each of these cities and minimizes the sum of the distances to all locations from the new tower.
a. Formulate a model to find the optimal location.
b. Formulate and solve a model that minimizes the maximum distance from the transmission tower location to the city locations.
سؤال
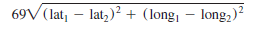
The distance between two cities in the United States can be approximated by the following formula where lat1 and long1 are the latitude and longitude of city 1 and lat2 and long2 are the latitude and longitude of city 2:
Ted's daughter is getting married, and he is inviting relatives from 15 different locations in the United States. The file Wedding gives the longitude, latitude, and number of relatives in each of the 15 locations. Ted would like to find the location to hold the wedding that minimizes the demand-weighted distance, where demand is the number of relatives at each location. Find the optimal location. ( Hint: Notice that all longitude values given for this problem are negative. Make sure that you do not check the option for Make Unconstrained Variables Non-Negative in Solver.)
Ted's daughter is getting married, and he is inviting relatives from 15 different locations in the United States. The file Wedding gives the longitude, latitude, and number of relatives in each of the 15 locations. Ted would like to find the location to hold the wedding that minimizes the demand-weighted distance, where demand is the number of relatives at each location. Find the optimal location. ( Hint: Notice that all longitude values given for this problem are negative. Make sure that you do not check the option for Make Unconstrained Variables Non-Negative in Solver.)
سؤال
Consider the stock return scenarios for Apple Computer (APPL), Advanced Micro Devices (AMD), and Oracle Corporation (ORCL) shown in the following table:
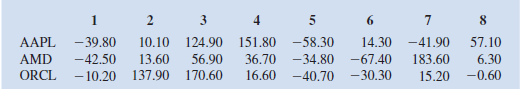
a. Develop the Markowitz portfolio model for these data with a required expected return of 25 percent. Assume that the eight scenarios are equally likely to occur.
b. Solve the model developed in part a.
c. Vary the required return in one percent increments from 25 percent to 30 percent, and plot the efficient frontier.
سؤال
A second version of the Markowitz portfolio model maximizes expected return subject to a constraint that the variance of the portfolio must be less than or equal to some specified amount. Consider again the Hauck Financial Service data given in Section 10.4.
a. Construct this version of the Markowitz model for a maximum variance of 30.
b. Solve the model developed in part a.
a. Construct this version of the Markowitz model for a maximum variance of 30.
b. Solve the model developed in part a.
سؤال
Portfolio Optimization with Transaction Costs
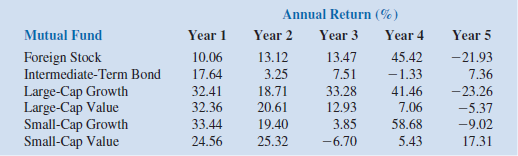
Hauck Financial Services has a number of passive, buy-and-hold clients. For these clients, Hauck offers an investment account whereby clients agree to put their money into a portfolio of mutual funds that is rebalanced once a year. When the rebalancing occurs, Hauck determines the mix of mutual funds in each investor's portfolio by solving an extension of the Markowitz portfolio model that incorporates transaction costs. Investors are charged a small transaction cost for the annual rebalancing of their portfolio. For simplicity, assume the following:
• At the beginning of the time period (in this case one year), the portfolio is rebalanced by buying and selling Hauck mutual funds.
• The transaction costs associated with buying and selling mutual funds are paid at the beginning of the period when the portfolio is rebalanced, which, in effect, reduces the amount of money available to reinvest.
• No further transactions are made until the end of the time period, at which point the new value of the portfolio is observed.
• The transaction cost is a linear function of the dollar amount of mutual funds bought or sold.
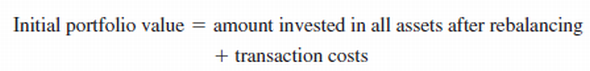
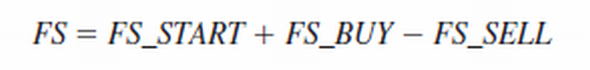
Jean Delgado is one of Hauck s buy-and-hold clients. We briefly describe the model asit is used by Hauck for rebalancing her portfolio. The mix of mutual funds that are beingconsidered for her portfolio are a foreign stock fund (FS), an intermediate-term bond fund(IB), a large-cap growth fund (LG), a large-cap value fund (LV), a small-cap growth fund(SG), and a small-cap value fund (SV). In the traditional Markowitz model, the variablesare usually interpreted as the proportion of the portfolio invested in the asset representedby the variable. For example, FS is the proportion of the portfolio invested in the foreignstock fund. However, it is equally correct to interpret FS as the dollar amount invested in theforeign stock fund. Then FS 5 25,000 implies $25,000 is invested in the foreign stock fund.Based on these assumptions, the initial portfolio value must equal the amount of moneyspent on transaction costs plus the amount invested in all the assets after rebalancing; that is,
The extension of the Markowitz model that Hauck uses for rebalancing portfolios requiresa balance constraint for each mutual fund. This balance constraint is

Using this balance constraint requires three additional variables for each fund: one forthe amount invested prior to rebalancing, one for the amount sold, and one for the amountpurchased. For instance, the balance constraint for the foreign stock fund is:
Jean Delgado has $100,000 in her account prior to the annual rebalancing, and shehas specified a minimum acceptable return of 10 percent. Hauck plans to use the followingmodel to rebalance Ms. Delgado s portfolio. The complete model with transactioncosts is
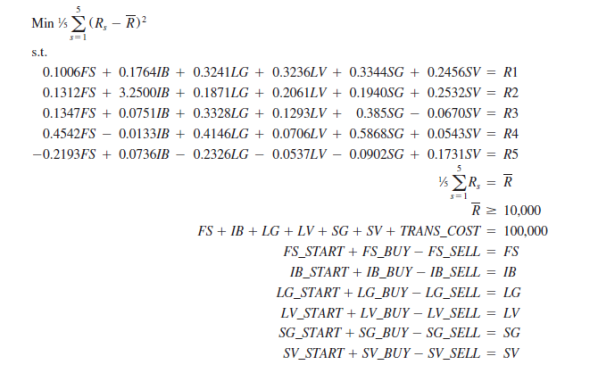
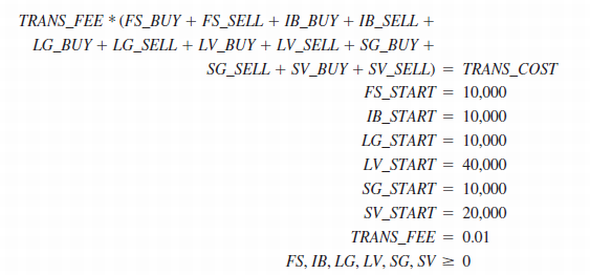
Notice that the transaction fee is set at 1 percent in the model (the last constraint) and that thetransaction cost for buying and selling shares of the mutual funds is a linear function of theamount bought and sold. With this model, the transactions costs are deducted from the client saccount at the time of rebalancing and thus reduce the amount of money invested. Thesolution for Ms. Delgado s rebalancing problem is shown as part of the Managerial Report.
Managerial Report. Assume you are a newly employed financial analytics specialist hired by Hauck FinancialServices. One of your first tasks is to review the portfolio rebalancing model in order toresolve a dispute with Jean Delgado. Ms. Delgado has had one of the Hauck passively managedportfolios for the last five years and has complained that she is not getting the rate ofreturn of 10 percent that she specified. After a review of her annual statements for the lastfive years, she feels that she is actually getting less than 10 percent on average.
1. According to the following Model Solution, IB_BUY 5 $41,268.51. How much intransaction costs did Ms. Delgado pay for purchasing additional shares of the intermediate-term bond fund
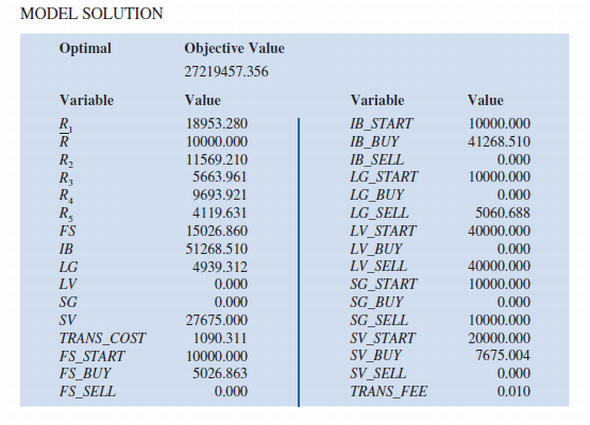
2. Based on the Model Solution, what is the total transaction cost associated with rebalancingMs. Delgado s portfolio
3. After paying transactions costs, how much did Ms. Delgado have invested in mutualfunds after her portfolio was rebalanced
4. According to the Model Solution, IB 5 $51,268.51. How much can Ms. Delgadoexpect to have in the intermediate-term bond fund at the end of the year
5. According to the Model Solution, the expected return of the portfolio is $10,000. Whatis the expected dollar amount in Ms. Delgado s portfolio at the end of the year Canshe expect to earn 10 percent on the $100,000 she had at the beginning of the year
6. It is now time to prepare a report to management to explain why Ms. Delgado did notearn 10 percent each year on her investment. Make a recommendation in terms of arevised portfolio model that can be used so that Jean Delgado can have an expectedportfolio balance of $110,000 at the end of next year. Prepare a report that includesa modified optimization model that will give an expected return of 10 percent on theamount of money available at the beginning of the year before paying the transactioncosts. Explain why the current model does not do this.
7. Solve the formulation in part 6 for Jean Delgado. How does the portfolio compositiondiffer from that of the Model Solution
Hauck Financial Services has a number of passive, buy-and-hold clients. For these clients, Hauck offers an investment account whereby clients agree to put their money into a portfolio of mutual funds that is rebalanced once a year. When the rebalancing occurs, Hauck determines the mix of mutual funds in each investor's portfolio by solving an extension of the Markowitz portfolio model that incorporates transaction costs. Investors are charged a small transaction cost for the annual rebalancing of their portfolio. For simplicity, assume the following:
• At the beginning of the time period (in this case one year), the portfolio is rebalanced by buying and selling Hauck mutual funds.
• The transaction costs associated with buying and selling mutual funds are paid at the beginning of the period when the portfolio is rebalanced, which, in effect, reduces the amount of money available to reinvest.
• No further transactions are made until the end of the time period, at which point the new value of the portfolio is observed.
• The transaction cost is a linear function of the dollar amount of mutual funds bought or sold.
Jean Delgado is one of Hauck s buy-and-hold clients. We briefly describe the model asit is used by Hauck for rebalancing her portfolio. The mix of mutual funds that are beingconsidered for her portfolio are a foreign stock fund (FS), an intermediate-term bond fund(IB), a large-cap growth fund (LG), a large-cap value fund (LV), a small-cap growth fund(SG), and a small-cap value fund (SV). In the traditional Markowitz model, the variablesare usually interpreted as the proportion of the portfolio invested in the asset representedby the variable. For example, FS is the proportion of the portfolio invested in the foreignstock fund. However, it is equally correct to interpret FS as the dollar amount invested in theforeign stock fund. Then FS 5 25,000 implies $25,000 is invested in the foreign stock fund.Based on these assumptions, the initial portfolio value must equal the amount of moneyspent on transaction costs plus the amount invested in all the assets after rebalancing; that is,
The extension of the Markowitz model that Hauck uses for rebalancing portfolios requiresa balance constraint for each mutual fund. This balance constraint is
Using this balance constraint requires three additional variables for each fund: one forthe amount invested prior to rebalancing, one for the amount sold, and one for the amountpurchased. For instance, the balance constraint for the foreign stock fund is:
Jean Delgado has $100,000 in her account prior to the annual rebalancing, and shehas specified a minimum acceptable return of 10 percent. Hauck plans to use the followingmodel to rebalance Ms. Delgado s portfolio. The complete model with transactioncosts is
Notice that the transaction fee is set at 1 percent in the model (the last constraint) and that thetransaction cost for buying and selling shares of the mutual funds is a linear function of theamount bought and sold. With this model, the transactions costs are deducted from the client saccount at the time of rebalancing and thus reduce the amount of money invested. Thesolution for Ms. Delgado s rebalancing problem is shown as part of the Managerial Report.
Managerial Report. Assume you are a newly employed financial analytics specialist hired by Hauck FinancialServices. One of your first tasks is to review the portfolio rebalancing model in order toresolve a dispute with Jean Delgado. Ms. Delgado has had one of the Hauck passively managedportfolios for the last five years and has complained that she is not getting the rate ofreturn of 10 percent that she specified. After a review of her annual statements for the lastfive years, she feels that she is actually getting less than 10 percent on average.
1. According to the following Model Solution, IB_BUY 5 $41,268.51. How much intransaction costs did Ms. Delgado pay for purchasing additional shares of the intermediate-term bond fund
2. Based on the Model Solution, what is the total transaction cost associated with rebalancingMs. Delgado s portfolio
3. After paying transactions costs, how much did Ms. Delgado have invested in mutualfunds after her portfolio was rebalanced
4. According to the Model Solution, IB 5 $51,268.51. How much can Ms. Delgadoexpect to have in the intermediate-term bond fund at the end of the year
5. According to the Model Solution, the expected return of the portfolio is $10,000. Whatis the expected dollar amount in Ms. Delgado s portfolio at the end of the year Canshe expect to earn 10 percent on the $100,000 she had at the beginning of the year
6. It is now time to prepare a report to management to explain why Ms. Delgado did notearn 10 percent each year on her investment. Make a recommendation in terms of arevised portfolio model that can be used so that Jean Delgado can have an expectedportfolio balance of $110,000 at the end of next year. Prepare a report that includesa modified optimization model that will give an expected return of 10 percent on theamount of money available at the beginning of the year before paying the transactioncosts. Explain why the current model does not do this.
7. Solve the formulation in part 6 for Jean Delgado. How does the portfolio compositiondiffer from that of the Model Solution
سؤال
Consider the following stock return data:
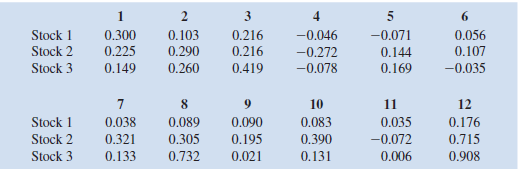
a. Construct the Markowitz portfolio model using a required expected return of 15 percent. Assume that the 12 scenarios are equally likely to occur.
b. Solve the model using Excel Solver.
c. Solve the model for various values of required expected return and plot the efficient frontier.
a. Construct the Markowitz portfolio model using a required expected return of 15 percent. Assume that the 12 scenarios are equally likely to occur.
b. Solve the model using Excel Solver.
c. Solve the model for various values of required expected return and plot the efficient frontier.
سؤال
Green Lawns provides a lawn fertilizer and weed control service. The company is adding a special aeration treatment as a low-cost extra service option that it hopes will help attract new customers. Management is planning to promote this new service in two media: radio and direct-mail advertising. A media budget of $3,000 is available for this promotional campaign. Based on past experience in promoting its other services, Green Lawns has obtained the following estimate of the relationship between sales and the amount spent on promotion in these two media.

Where
S = total sales in thousands of dollars
R = thousands of dollars spent on radio advertising
M = thousands of dollars spent on direct-mail advertising
GreenLawns would like to develop a promotional strategy that will lead to maximum sales subject to the restriction provided by the media budget.
a. What is the value of sales if $2,000 is spent on radio advertising and $1,000 is spent on direct-mail advertising
b. Formulate an optimization problem that can be solved to maximize sales subject to the media budget of spending no more than $3,000 on total advertising.
c. Determine the optimal amount to spend on radio and direct-mail advertising. How much in sales will be generated
سؤال
Let us consider again the investment data from Hauck Financial Services used in Section 10.4 to illustrate the Markowitz portfolio model. The data follows, along with the return of the S P 500 Index. Hauck would like to create a portfolio using the funds listed, so that the resulting portfolio matches the return of the S P 500 index as closely as possible.
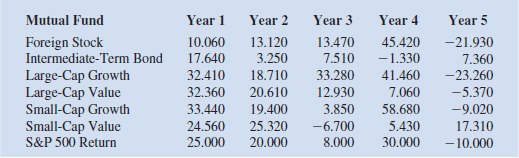
a. Develop an optimization model that will give the fraction of the portfolio to invest in each of the funds so that the return of the resulting portfolio matches as closely as possible the return of the S P 500 Index. ( Hint: Minimize the sum of the squared deviations between the portfolio's return and the S P 500 Index return for each year in the data set.)
b. Solve the model developed in part a.

فتح الحزمة
قم بالتسجيل لفتح البطاقات في هذه المجموعة!
Unlock Deck
Unlock Deck
1/21
العب
ملء الشاشة (f)
Deck 9: Spreadsheet Models
1
The Cobb-Douglas production function is a classic model from economics used to model output as a function of capital and labor. It has the form
where c 0 , c 1, and c 2 are constants. The variable L represents the units of input of labor, and the variable C represents the units of input of capital.
a. In this example, assume c 0 5 5, c 1 5 0.25, and c 2 5 0.75. Assume each unit of labor costs $25 and each unit of capital costs $75. With $75,000 available in the budget, develop an optimization model to determine how the budgeted amount should be allocated between capital and labor in order to maximize output.
b. Find the optimal solution to the model you formulated in part a. ( Hint: When using Excel Solver, use the Multistart option with bounds 0 # L # 3000 and 0 # C # 1000.)
a.
The optimization model can be developed as:
 b.Define the decision variables and objective function as shown in the screenshot:
 Define the constraint by using
 function. The screenshot is shown below:
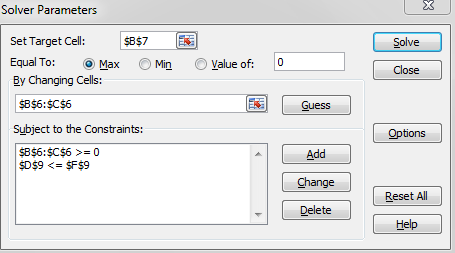
 All the inputs have been done; hence click on Solve icon. A dialog box will appear. In the Target cell box, input B7, where final result of NET PRESENT VALUE will appear. Also, select the MAX option box. In the text box "By Changing Cell", update the cell names where the actual numbers are to be updated. Add the constraints. The screenshot is shown below,
 Now click on OK button.
Click on Solve button and Solver dialogue box will appear saying that the solution has been found. The screenshot is as shown below,
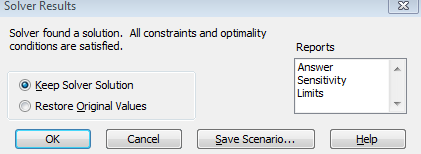 If the "Keep Solver Solution" option button is clicked, the value of the decision variable will be updated automatically. The screenshot is as shown below,
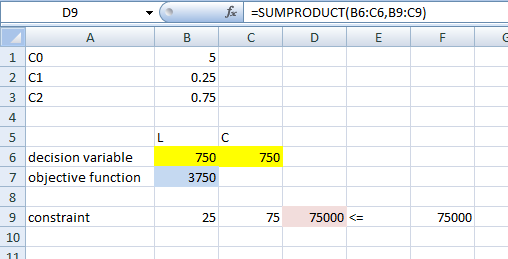 According to the solver report, the company should use 750 units of each labour and capital.
The optimization model can be developed as:
b.Define the decision variables and objective function as shown in the screenshot: Define the constraint by using function. The screenshot is shown below: All the inputs have been done; hence click on Solve icon. A dialog box will appear. In the Target cell box, input B7, where final result of NET PRESENT VALUE will appear. Also, select the MAX option box. In the text box "By Changing Cell", update the cell names where the actual numbers are to be updated. Add the constraints. The screenshot is shown below, Now click on OK button.Click on Solve button and Solver dialogue box will appear saying that the solution has been found. The screenshot is as shown below,
If the "Keep Solver Solution" option button is clicked, the value of the decision variable will be updated automatically. The screenshot is as shown below, According to the solver report, the company should use 750 units of each labour and capital. 2
As discussed in Section 10.4, the Markowitz Model uses the variance of the portfolio as the measure of risk. However, variance includes deviations both below and above the mean return. Semivariance includes only deviations below the mean and is considered by many to be a better measure of risk.
a. Develop a model that minimizes semivariance for the Hauck Financial data given in the file HauckData with a required return of 10 percent. ( Hint: Modify model (10.8)-(10.17). Define a variable d s for each
scenario and let
.
b. Solve the model you developed in part a with a required expected return of 10 percent.
a. Develop a model that minimizes semivariance for the Hauck Financial data given in the file HauckData with a required return of 10 percent. ( Hint: Modify model (10.8)-(10.17). Define a variable d s for each
scenario and let
. b. Solve the model you developed in part a with a required expected return of 10 percent.
a.Referring to Section 13.4 of this textbook, consider the below notations according to the information given:

 And:
And:
 In order to minimize the semivariance for the Hauck Financial data, the below model has been developed:
Minimize:
 Such that:

 And:
And:

 Also:
Also:
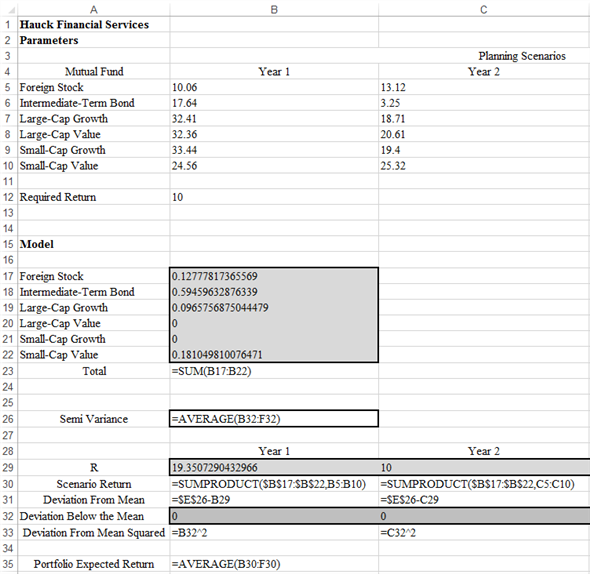
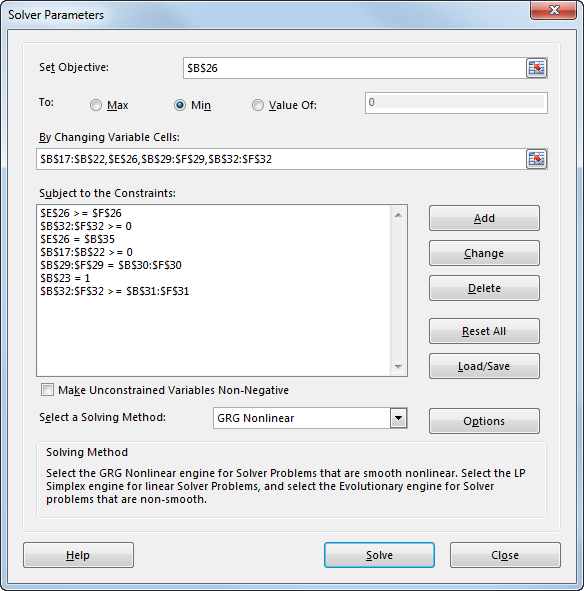
 b.Enter the data in Excel sheet as shown below. The formulas have also been shown below by the consideration of expected return of 10%:
 Now, follow the below steps in Excel:
1. Go to Solver add-in in the data menu bar in Excel.
2. A dialog box opens. In it, update the "Set Objective cell", "By Changing Variables". Also add the required constraints under heading "subject to the constraints" by clicking on "Add" button.
Then, select GRG Nonlinear solving method. The updated dialog box is shown below:
 3. Click on "Solve" to get the below required solved model output:
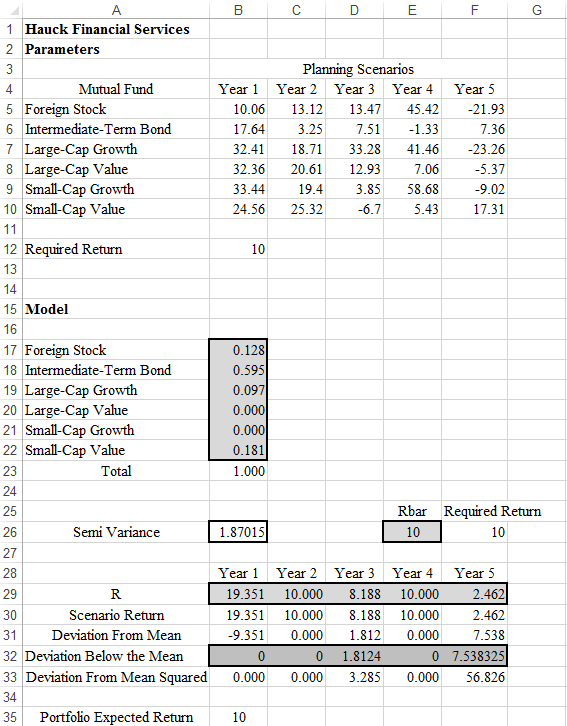 Hence, the minimum semi-variance for the for the Hauck Financial data is
 .
.
And: In order to minimize the semivariance for the Hauck Financial data, the below model has been developed:Minimize:
Such that: And: Also: b.Enter the data in Excel sheet as shown below. The formulas have also been shown below by the consideration of expected return of 10%: Now, follow the below steps in Excel:1. Go to Solver add-in in the data menu bar in Excel.
2. A dialog box opens. In it, update the "Set Objective cell", "By Changing Variables". Also add the required constraints under heading "subject to the constraints" by clicking on "Add" button.
Then, select GRG Nonlinear solving method. The updated dialog box is shown below:
3. Click on "Solve" to get the below required solved model output: Hence, the minimum semi-variance for the for the Hauck Financial data is . 3
Let S represent the amount of steel produced (in tons). Steel production is related to the amount of labor used ( L ) and the amount of capital used ( C ) by the following function:
In this formula L represents the units of labor input and C the units of capital input. Each unit of labor costs $50, and each unit of capital costs $100.
a. Formulate an optimization problem that will determine how much labor and capital are needed to produce 50,000 tons of steel at minimum cost.
b. Solve the optimization problem you formulated in part a. ( Hint: When using Excel Solver, start with an initial L. 0 and C 0.)
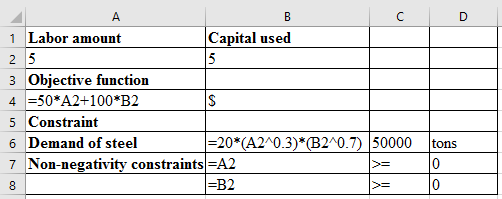
(a)Formulate the optimization model to minimize the cost of steel production as follows.
Objective function Z is
 .
.
Here, decision variable, L is amount of labor used and C is amount of capital used.The formulation is subjected to the following constraints.
1) The total demand for steel in tons required to be produced. 2) Lower bound constraints.

 3) Upper bound constraints.

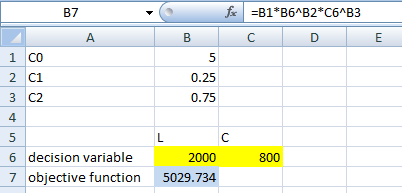
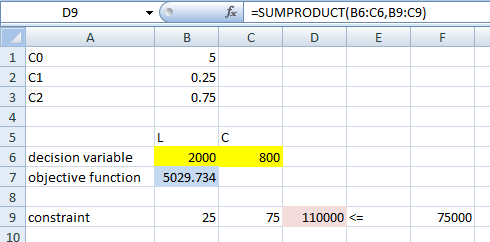
 (b)Use the Excel solver to find the optimal solution.
Setup the decision variables with value of 5.
Give the data with objective function expression, and constraints as shown in figure (1).
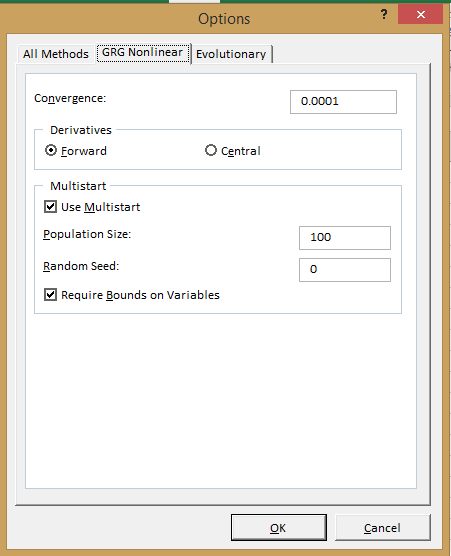
 Enable multi start option inside the solver dialog box (to reach global optimum) as in figure (2).
 Setup the inputs in the solver dialog box as shown in figure (3).
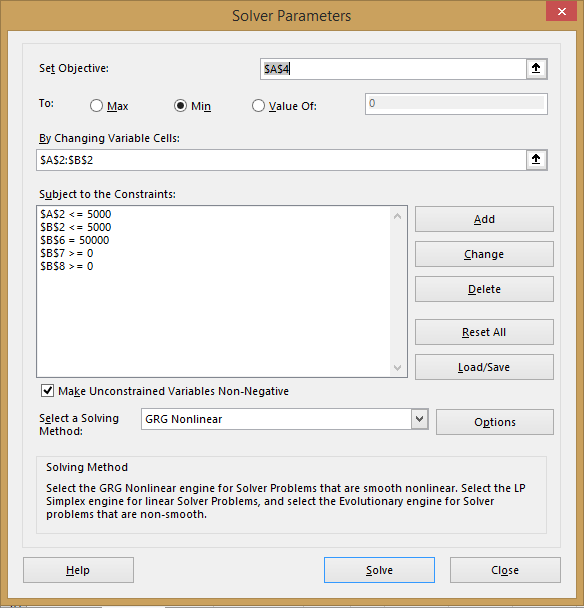 Show the optimum result from clicking solver button in worksheet as in figure (4).
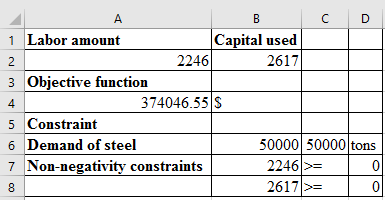 Thus, the amount of labor to be used is
 .
.
The amount of capital to be used is
 .
.
The minimum cost of production is
 .
.
Objective function Z is
.Here, decision variable, L is amount of labor used and C is amount of capital used.The formulation is subjected to the following constraints.
1) The total demand for steel in tons required to be produced.
2) Lower bound constraints. 3) Upper bound constraints. (b)Use the Excel solver to find the optimal solution.Setup the decision variables with value of 5.
Give the data with objective function expression, and constraints as shown in figure (1).
Enable multi start option inside the solver dialog box (to reach global optimum) as in figure (2). Setup the inputs in the solver dialog box as shown in figure (3). Show the optimum result from clicking solver button in worksheet as in figure (4). Thus, the amount of labor to be used is .The amount of capital to be used is
.The minimum cost of production is
. 4
Refer to Problem 15. Use the model developed there to construct an efficient frontier by varying the maximum allowable variance from 20 to 60 in increments of 5 and solving for the maximum return for each. Plot the efficient frontier and compare it to Figure 10.12
فتح الحزمة
افتح القفل للوصول البطاقات البالغ عددها 21 في هذه المجموعة.
فتح الحزمة
k this deck
5
The profit function for two products is:
where x 1 represents units of production of product 1, and x 2 represents units of production of product 2.
Producing one unit of product 1 requires 4 labor-hours, and producing one unit of product 2 requires 6 labor-hours. Currently, 24 labor-hours are available. The cost of labor-hours is already factored into the profit function, but it is possible to schedule overtime at a premium of $5 per hour.
a. Formulate an optimization problem that can be used to find the optimal production quantity of products 1 and 2 and the optimal number of overtime hours to schedule.
b. Solve the optimization model you formulated in part a. How much should be produced and how many overtime hours should be scheduled
فتح الحزمة
افتح القفل للوصول البطاقات البالغ عددها 21 في هذه المجموعة.
فتح الحزمة
k this deck
6
The weekly box office revenues (in $ millions) for the summer blockbuster movie discussed in Section 10.5 follow. Use these data in the Bass forecasting model given by equations (10.19)-(10.21) to estimate the parameters p, q , and m.
The Bass forecasting model is a good example of a difficult-to-solve nonlinear program, and the answer you get may be a local optimum that is not nearly as good as the result given in Table 10.4. Solve the model using Excel Solver with the Multistart option, and see whether you can duplicate the results in Table 10.4.
The Bass forecasting model is a good example of a difficult-to-solve nonlinear program, and the answer you get may be a local optimum that is not nearly as good as the result given in Table 10.4. Solve the model using Excel Solver with the Multistart option, and see whether you can duplicate the results in Table 10.4.
فتح الحزمة
افتح القفل للوصول البطاقات البالغ عددها 21 في هذه المجموعة.
فتح الحزمة
k this deck
7
Jim's Camera shop sells two high-end cameras, the Sky Eagle and Horizon. The demand for these two cameras are as follows: D S 5 demand for the Sky Eagle, P S is the selling price of the Sky Eagle, D H is the demand for the Horizon, and P H is the selling price of the
Horizon.
The store wishes to determine the selling price that maximizes revenue for these two products. Develop the revenue function for these two models, and find the revenue maximizing prices.
Horizon.
The store wishes to determine the selling price that maximizes revenue for these two products. Develop the revenue function for these two models, and find the revenue maximizing prices.
فتح الحزمة
افتح القفل للوصول البطاقات البالغ عددها 21 في هذه المجموعة.
فتح الحزمة
k this deck
8
Heller Manufacturing has two production facilities that manufacture baseball gloves. Production costs at the two facilities differ because of varying labor rates, local property taxes, type of equipment, capacity, and so on. The Dayton plant has weekly costs that can be expressed as a function of the number of gloves produced:
where X is the weekly production volume in thousands of units, and TCD ( X ) is the cost in thousands of dollars. The Hamilton plant's weekly production costs are given by
where Y is the weekly production volume in thousands of units, and TCH ( Y ) is the cost in thousands of dollars. Heller Manufacturing would like to produce 8000 gloves per week at the lowest possible cost.
a. Formulate a mathematical model that can be used to determine the optimal number of gloves to produce each week at each facility.
b. Solve the optimization model to determine the optimal number of gloves to produce at each facility.
فتح الحزمة
افتح القفل للوصول البطاقات البالغ عددها 21 في هذه المجموعة.
فتح الحزمة
k this deck
9
Many forecasting models use parameters that are estimated using nonlinear optimization. A good example is the Bass model introduced in this chapter. Another example is the exponential smoothing forecasting model discussed in Chapter 5. The exponential smoothing model is common in practice and is described in further detail in Chapter 5. For
instance, the basic exponential smoothing model for forecasting sales is
Where
This model is used recursively; the forecast for time period t 1 1 is based on the forecast for period t,
, the observed value of sales in period t , y t , and the smoothing parameter _. The use of this model to forecast sales for 12 months is illustrated in the following table with the smoothing constant _ 5 0.3. The forecast errors,
, are calculated in the fourth column. The value of _ is often chosen by minimizing the sum of squared forecast errors. The last column of the table shows the square of the forecast error and the sum of squared forecast errors. In using exponential smoothing models, one tries to choose the value of _ that provides the best forecasts.
a. The file ExpSmooth contains the observed data shown here. Construct this table using the formula above. Note that we set the forecast in period 1 to the observed in period 1 to get started
= 17 then the formula above for
is used starting in period 2. Make sure to have a single cell corresponding to _ in your spreadsheet model. After confirming the values in the table below with _ 5 0.3, try different values of _ to see if you can get a smaller sum of squared forecast errors.
b. Use Excel Solver to find the value of _ that minimizes the sum of squared forecast errors.
instance, the basic exponential smoothing model for forecasting sales is
Where
This model is used recursively; the forecast for time period t 1 1 is based on the forecast for period t,
, the observed value of sales in period t , y t , and the smoothing parameter _. The use of this model to forecast sales for 12 months is illustrated in the following table with the smoothing constant _ 5 0.3. The forecast errors, , are calculated in the fourth column. The value of _ is often chosen by minimizing the sum of squared forecast errors. The last column of the table shows the square of the forecast error and the sum of squared forecast errors. In using exponential smoothing models, one tries to choose the value of _ that provides the best forecasts.a. The file ExpSmooth contains the observed data shown here. Construct this table using the formula above. Note that we set the forecast in period 1 to the observed in period 1 to get started
= 17 then the formula above for is used starting in period 2. Make sure to have a single cell corresponding to _ in your spreadsheet model. After confirming the values in the table below with _ 5 0.3, try different values of _ to see if you can get a smaller sum of squared forecast errors.b. Use Excel Solver to find the value of _ that minimizes the sum of squared forecast errors.
فتح الحزمة
افتح القفل للوصول البطاقات البالغ عددها 21 في هذه المجموعة.
فتح الحزمة
k this deck
10
Andalus Furniture Company has two manufacturing plants, one at Aynor and another at Spartanburg. The cost in dollars of producing a kitchen chair at each of the two plants is given here. The cost of producing Q 1 chairs at Aynor is:
and the cost of producing Q 2 kitchen chairs at Spartanburg is
Andalus needs to manufacture a total of 40 kitchen chairs to meet an order just received. How many chairs should be made at Aynor, and how many should be made at Spartanburg in order to minimize total production cost
and the cost of producing Q 2 kitchen chairs at Spartanburg is
Andalus needs to manufacture a total of 40 kitchen chairs to meet an order just received. How many chairs should be made at Aynor, and how many should be made at Spartanburg in order to minimize total production cost
فتح الحزمة
افتح القفل للوصول البطاقات البالغ عددها 21 في هذه المجموعة.
فتح الحزمة
k this deck
11
The economic order quantity (EOQ) model is a classical model used for controlling inventory and satisfying demand. Costs included in the model are holding cost per unit, ordering cost, and the cost of goods ordered. The assumptions for that model are that only
a single item is considered, that the entire quantity ordered arrives at one time, that the demand for the item is constant over time, and that no shortages are allowed. Suppose we relax the first assumption and allow for multiple items that are independent except for a budget restriction. The following model describes this situation:
Let
The decision variables are Q j , the amount of item j to order. The model is:
In the objective function, the first term is the annual cost of goods, the second is the annual ordering cost
and the last term is the annual inventory holding cost
a. Set up a spreadsheet model and for the following data:
b. Solve the problem using Excel Solver. ( Hint: For Solver to find a solution, you need to start with decision variable values that are greater than 0.)
a single item is considered, that the entire quantity ordered arrives at one time, that the demand for the item is constant over time, and that no shortages are allowed. Suppose we relax the first assumption and allow for multiple items that are independent except for a budget restriction. The following model describes this situation:
Let
The decision variables are Q j , the amount of item j to order. The model is:
In the objective function, the first term is the annual cost of goods, the second is the annual ordering cost
and the last term is the annual inventory holding cost a. Set up a spreadsheet model and for the following data:
b. Solve the problem using Excel Solver. ( Hint: For Solver to find a solution, you need to start with decision variable values that are greater than 0.)
فتح الحزمة
افتح القفل للوصول البطاقات البالغ عددها 21 في هذه المجموعة.
فتح الحزمة
k this deck
12
Phillips Inc. produces two distinct products, A and B. The products do not compete with each other in the marketplace; that is, neither cost, price, nor demand for one product will impact the demand for the other. Phillips' analysts have collected data on the effects of advertising on profits. These data suggest that, although higher advertising correlates with higher profits, the marginal increase in profits diminishes at highe advertising levels, particularly for Product B. Analysts have estimated the following functions:
where X A and X B are the advertising amount allocated to products A and B, respectively, in thousands of dollars, profit is in millions of dollars, and LN is the natural logarithm function. The advertising budget is $500,000, and management has dictated that at least $50,000 must be allocated to each of the two products.
( Hint: To compute a natural logarithm for the value X in Excel, use the formula 5 LN ( X ). For Solver to find an answer, you also need to start with decision variable values greater than 0 in this problem.)
. Build an optimization model that will prescribe how Phillips should allocate its marketing budget to maximize profit.
b. Solve the model you constructed in part a using Excel Solver.
فتح الحزمة
افتح القفل للوصول البطاقات البالغ عددها 21 في هذه المجموعة.
فتح الحزمة
k this deck
13
Let us consider again the data from the La Rosa tool bin location problem discussed in Section 10.3.
a. Suppose we know the average number of daily trips made to the tool bin from each production station. It seems as though we would want the tool bin closer to those stations with high numbers of average trips. Develop a new unconstrained model that minimizes the sum of the demand-weighted distance defined as the product of the demand (measured in number of trips) and the distance to the station.
b. Solve the model you developed in part a. Comment on the differences between the unweighted distance solution given in Section10.3 and the demand-weighted solution.
فتح الحزمة
افتح القفل للوصول البطاقات البالغ عددها 21 في هذه المجموعة.
فتح الحزمة
k this deck
14
TN Communications provides cellular telephone services. The company is planning to expand into the Cincinnati area and is trying to determine the best location for its trans- mission tower. The tower transmits over a radius of 10 miles. The locations that must be reached by this tower are shown in the following figure.
TN Communications would like to find the tower location that reaches each of these cities and minimizes the sum of the distances to all locations from the new tower.
a. Formulate a model to find the optimal location.
b. Formulate and solve a model that minimizes the maximum distance from the transmission tower location to the city locations.
فتح الحزمة
افتح القفل للوصول البطاقات البالغ عددها 21 في هذه المجموعة.
فتح الحزمة
k this deck
15
The distance between two cities in the United States can be approximated by the following formula where lat1 and long1 are the latitude and longitude of city 1 and lat2 and long2 are the latitude and longitude of city 2:
Ted's daughter is getting married, and he is inviting relatives from 15 different locations in the United States. The file Wedding gives the longitude, latitude, and number of relatives in each of the 15 locations. Ted would like to find the location to hold the wedding that minimizes the demand-weighted distance, where demand is the number of relatives at each location. Find the optimal location. ( Hint: Notice that all longitude values given for this problem are negative. Make sure that you do not check the option for Make Unconstrained Variables Non-Negative in Solver.)
Ted's daughter is getting married, and he is inviting relatives from 15 different locations in the United States. The file Wedding gives the longitude, latitude, and number of relatives in each of the 15 locations. Ted would like to find the location to hold the wedding that minimizes the demand-weighted distance, where demand is the number of relatives at each location. Find the optimal location. ( Hint: Notice that all longitude values given for this problem are negative. Make sure that you do not check the option for Make Unconstrained Variables Non-Negative in Solver.)
فتح الحزمة
افتح القفل للوصول البطاقات البالغ عددها 21 في هذه المجموعة.
فتح الحزمة
k this deck
16
Consider the stock return scenarios for Apple Computer (APPL), Advanced Micro Devices (AMD), and Oracle Corporation (ORCL) shown in the following table:
a. Develop the Markowitz portfolio model for these data with a required expected return of 25 percent. Assume that the eight scenarios are equally likely to occur.
b. Solve the model developed in part a.
c. Vary the required return in one percent increments from 25 percent to 30 percent, and plot the efficient frontier.
فتح الحزمة
افتح القفل للوصول البطاقات البالغ عددها 21 في هذه المجموعة.
فتح الحزمة
k this deck
17
A second version of the Markowitz portfolio model maximizes expected return subject to a constraint that the variance of the portfolio must be less than or equal to some specified amount. Consider again the Hauck Financial Service data given in Section 10.4.
a. Construct this version of the Markowitz model for a maximum variance of 30.
b. Solve the model developed in part a.
a. Construct this version of the Markowitz model for a maximum variance of 30.
b. Solve the model developed in part a.
فتح الحزمة
افتح القفل للوصول البطاقات البالغ عددها 21 في هذه المجموعة.
فتح الحزمة
k this deck
18
Portfolio Optimization with Transaction Costs
Hauck Financial Services has a number of passive, buy-and-hold clients. For these clients, Hauck offers an investment account whereby clients agree to put their money into a portfolio of mutual funds that is rebalanced once a year. When the rebalancing occurs, Hauck determines the mix of mutual funds in each investor's portfolio by solving an extension of the Markowitz portfolio model that incorporates transaction costs. Investors are charged a small transaction cost for the annual rebalancing of their portfolio. For simplicity, assume the following:
• At the beginning of the time period (in this case one year), the portfolio is rebalanced by buying and selling Hauck mutual funds.
• The transaction costs associated with buying and selling mutual funds are paid at the beginning of the period when the portfolio is rebalanced, which, in effect, reduces the amount of money available to reinvest.
• No further transactions are made until the end of the time period, at which point the new value of the portfolio is observed.
• The transaction cost is a linear function of the dollar amount of mutual funds bought or sold.
Jean Delgado is one of Hauck s buy-and-hold clients. We briefly describe the model asit is used by Hauck for rebalancing her portfolio. The mix of mutual funds that are beingconsidered for her portfolio are a foreign stock fund (FS), an intermediate-term bond fund(IB), a large-cap growth fund (LG), a large-cap value fund (LV), a small-cap growth fund(SG), and a small-cap value fund (SV). In the traditional Markowitz model, the variablesare usually interpreted as the proportion of the portfolio invested in the asset representedby the variable. For example, FS is the proportion of the portfolio invested in the foreignstock fund. However, it is equally correct to interpret FS as the dollar amount invested in theforeign stock fund. Then FS 5 25,000 implies $25,000 is invested in the foreign stock fund.Based on these assumptions, the initial portfolio value must equal the amount of moneyspent on transaction costs plus the amount invested in all the assets after rebalancing; that is,
The extension of the Markowitz model that Hauck uses for rebalancing portfolios requiresa balance constraint for each mutual fund. This balance constraint is
Using this balance constraint requires three additional variables for each fund: one forthe amount invested prior to rebalancing, one for the amount sold, and one for the amountpurchased. For instance, the balance constraint for the foreign stock fund is:
Jean Delgado has $100,000 in her account prior to the annual rebalancing, and shehas specified a minimum acceptable return of 10 percent. Hauck plans to use the followingmodel to rebalance Ms. Delgado s portfolio. The complete model with transactioncosts is
Notice that the transaction fee is set at 1 percent in the model (the last constraint) and that thetransaction cost for buying and selling shares of the mutual funds is a linear function of theamount bought and sold. With this model, the transactions costs are deducted from the client saccount at the time of rebalancing and thus reduce the amount of money invested. Thesolution for Ms. Delgado s rebalancing problem is shown as part of the Managerial Report.
Managerial Report. Assume you are a newly employed financial analytics specialist hired by Hauck FinancialServices. One of your first tasks is to review the portfolio rebalancing model in order toresolve a dispute with Jean Delgado. Ms. Delgado has had one of the Hauck passively managedportfolios for the last five years and has complained that she is not getting the rate ofreturn of 10 percent that she specified. After a review of her annual statements for the lastfive years, she feels that she is actually getting less than 10 percent on average.
1. According to the following Model Solution, IB_BUY 5 $41,268.51. How much intransaction costs did Ms. Delgado pay for purchasing additional shares of the intermediate-term bond fund
2. Based on the Model Solution, what is the total transaction cost associated with rebalancingMs. Delgado s portfolio
3. After paying transactions costs, how much did Ms. Delgado have invested in mutualfunds after her portfolio was rebalanced
4. According to the Model Solution, IB 5 $51,268.51. How much can Ms. Delgadoexpect to have in the intermediate-term bond fund at the end of the year
5. According to the Model Solution, the expected return of the portfolio is $10,000. Whatis the expected dollar amount in Ms. Delgado s portfolio at the end of the year Canshe expect to earn 10 percent on the $100,000 she had at the beginning of the year
6. It is now time to prepare a report to management to explain why Ms. Delgado did notearn 10 percent each year on her investment. Make a recommendation in terms of arevised portfolio model that can be used so that Jean Delgado can have an expectedportfolio balance of $110,000 at the end of next year. Prepare a report that includesa modified optimization model that will give an expected return of 10 percent on theamount of money available at the beginning of the year before paying the transactioncosts. Explain why the current model does not do this.
7. Solve the formulation in part 6 for Jean Delgado. How does the portfolio compositiondiffer from that of the Model Solution
فتح الحزمة
افتح القفل للوصول البطاقات البالغ عددها 21 في هذه المجموعة.
فتح الحزمة
k this deck
19
Consider the following stock return data:
a. Construct the Markowitz portfolio model using a required expected return of 15 percent. Assume that the 12 scenarios are equally likely to occur.
b. Solve the model using Excel Solver.
c. Solve the model for various values of required expected return and plot the efficient frontier.
a. Construct the Markowitz portfolio model using a required expected return of 15 percent. Assume that the 12 scenarios are equally likely to occur.
b. Solve the model using Excel Solver.
c. Solve the model for various values of required expected return and plot the efficient frontier.
فتح الحزمة
افتح القفل للوصول البطاقات البالغ عددها 21 في هذه المجموعة.
فتح الحزمة
k this deck
20
Green Lawns provides a lawn fertilizer and weed control service. The company is adding a special aeration treatment as a low-cost extra service option that it hopes will help attract new customers. Management is planning to promote this new service in two media: radio and direct-mail advertising. A media budget of $3,000 is available for this promotional campaign. Based on past experience in promoting its other services, Green Lawns has obtained the following estimate of the relationship between sales and the amount spent on promotion in these two media.
Where
S = total sales in thousands of dollars
R = thousands of dollars spent on radio advertising
M = thousands of dollars spent on direct-mail advertising
GreenLawns would like to develop a promotional strategy that will lead to maximum sales subject to the restriction provided by the media budget.
a. What is the value of sales if $2,000 is spent on radio advertising and $1,000 is spent on direct-mail advertising
b. Formulate an optimization problem that can be solved to maximize sales subject to the media budget of spending no more than $3,000 on total advertising.
c. Determine the optimal amount to spend on radio and direct-mail advertising. How much in sales will be generated
فتح الحزمة
افتح القفل للوصول البطاقات البالغ عددها 21 في هذه المجموعة.
فتح الحزمة
k this deck
21
Let us consider again the investment data from Hauck Financial Services used in Section 10.4 to illustrate the Markowitz portfolio model. The data follows, along with the return of the S P 500 Index. Hauck would like to create a portfolio using the funds listed, so that the resulting portfolio matches the return of the S P 500 index as closely as possible.
a. Develop an optimization model that will give the fraction of the portfolio to invest in each of the funds so that the return of the resulting portfolio matches as closely as possible the return of the S P 500 Index. ( Hint: Minimize the sum of the squared deviations between the portfolio's return and the S P 500 Index return for each year in the data set.)
b. Solve the model developed in part a.
فتح الحزمة
افتح القفل للوصول البطاقات البالغ عددها 21 في هذه المجموعة.
فتح الحزمة
k this deck
فتح الحزمة
افتح القفل للوصول البطاقات البالغ عددها 21 في هذه المجموعة.


