Deck 15: Technology, Rd, and Efficiency
ملء الشاشة (f)
سؤال
سؤال
سؤال
سؤال
سؤال
سؤال
سؤال
Recall the model of nonrenewable resource extraction presented in Figure 15.7. Suppose that a technological breakthrough means that extraction costs will fall in the future (but not in the present). What will this do to future profits and, therefore, to current user cost Will current extraction increase or decrease Compare this to a situation where future extraction costs remain unchanged but current extraction costs fall. In this situation, does current extraction increase or decrease Does the firm's behavior make sense in both situations That is, does its response to the changes in production costs in each case maximize the firm's stream of profits over time 
سؤال
سؤال
Suppose that a government wants to reduce its economy's dependence on coal and decides as a result to tax coal mining companies $1 per ton for every ton of coal that they mine. Assuming that coal mining companies treat this tax as an increase in extraction costs this year, what effect will the tax have on current extraction in the model used in Figure 15.7 Now, think one step ahead. Suppose that the tax will be in place forever, so that it will also affect extraction costs in the future. Will the tax increase or decrease user cost Does this effect increase or decrease the change in current extraction caused by the shift of the EC curve Given your finding, should environmental taxes be temporary
Reference Figure 15.7
Reference Figure 15.7
سؤال
User cost is equal to the present value of future profits in the model presented in Figure 15.7. Will the optimal quantity to mine in the present year increase or decrease if the market rate of interest rises Does your result make any intuitive sense (Hint: If interest rates are up, would you want to have more or less money right now to invest at the market rate of interest )
Reference Figure 15.7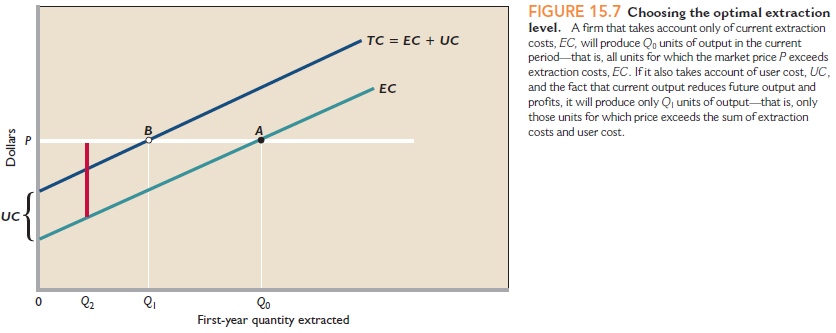
Reference Figure 15.7
سؤال
سؤال
سؤال
سؤال
سؤال

فتح الحزمة
قم بالتسجيل لفتح البطاقات في هذه المجموعة!
Unlock Deck
Unlock Deck
1/15
العب
ملء الشاشة (f)
Deck 15: Technology, Rd, and Efficiency
1
Suppose that the current (first) generation consists of 1 million people, half of whom are women. If the total fertility rate iS₁.3 and the only way people die is of old age, how big will the fourth generation (the great-grandchildren) be How much smaller (in percentage terms) is each generation than the previous generation How much smaller (in percentage terms) is the fourth generation than the first generation Are you surprised by how quickly the population declines
fourth generation = 274,625; each successive generation will be 35% smaller than the previous one; the fourth generation will be 72.53% smaller; no.
Feedback: Consider the following example. The current (first) generation consists of 1 million people, half of whom are women. Also assume that the total fertility rate iS₁.3.
How big with the fourth generation be To answer this question we first note that the total fertility rate is the average number of children a woman is expected to have during her lifetime. This implies that the total fertility rate of 1.3 translates into a population growth rate of (1.3/2) - 1 = -0.35 (approximate decline of 35%). The reason is that each woman must have 2 children on average to replace one male and one female (ignoring mortality).
Using the rate of population growth above, we can calculate the size of each sequential generation.
Second Generation (our children): 1,000,000 x (1 + (-0.35)) = 1,000,000 x (1 - 0.35) = 1,000,000 x.65 = 650,000.
Third Generation (our grand-children): 650,000 x (1-0.35)) = 650,000 x.65 = 422,500.
Fourth Generation (our great grand-children): 422,500 x (1-0.35)) = 422,500 x.65 = 274,625.
Note you could use the formula:
Future Population = (First) Initial Population x (1+Rate of Growth) T , where T is the number periods into the future.
Our example is:
Future Population = 1,000,000 x (1 - 0.35) 3 = 1,000,000 x 0.274625 = 274,625
From the rate of decline found above, each successive generation will be 35% smaller.
The fourth generation will be 72.53% smaller (= (274,625-1,000,000)/1,000,000)).
This shouldn't be a surprise given the student's understanding of compounding over time.
2
CARBON DIOXIDE EMISSIONS-RISING OR FALLING We presented evidence earlier that per capita consumption of water, energy, and solid objects like plastics and metals has been constant or falling in recent decades. The consumption of fossil fuels, however, is of special concern because ofworries about global warming caused by the emission into the atmosphere of carbon dioxide and other so-called greenhouse gasses. Go to the Energy Information Agency's Environment page, www.eia.doe.gov/environment.html. Scan the International Emissions Data links and click on the one that says Per Capita Emissions in order to open up an Excel spreadsheet that contains per capita carbon dioxide emissions for almost all countries for each of the previouS₂0 years or so. Have per capita carbon dioxide emissions in the United States, Japan, and France grown, stayed about the same, or fallen over the past couple of decades Does it surprise you to learn that over this time period France has moved to generate more than 80 percent of its electricity from nuclear power, which emits no carbon dioxide What about emissions in China, Indonesia, and India Why have emissions risen so much (in percentage terms) in these countries (Hint: They are not as poor as they used to be.) If current trends in these countries continue, should we be worried And could defining property rights over the atmosphere solve the problem
NO ANSWER
3
Demographers have been very surprised that total fertility rates have fallen below 2.0, especially because most people in most countries tell pollsters that they would like to have two children. Can you think of any possible economic factors that may be causing so many women in so many countries to average less than two children per lifetime What about other social or political changes
There are a number of factors that could lead to the decline, including greater participation by women in the paid labor force, the transformation of children from an economic asset (e.g. on the farm) to a liability, higher divorce rates, and changed attitudes and access to birth control
4
Resource consumption per person in the United States is either flat or falling, depending on the resource. Yet living standards are rising due to improvements in technology that allow more output to be produced for every unit of input used in production. What does this say about the likelihood of our running out of resources Could we possibly maintain or improve our living standards even if the population were expected to rise in the future rather than fall
فتح الحزمة
افتح القفل للوصول البطاقات البالغ عددها 15 في هذه المجموعة.
فتح الحزمة
k this deck
5
Suppose that you hear two people arguing about energy. One says that we are running out of energy. The other counters that we are running out of cheap energy. Explain which person is correct and why.
فتح الحزمة
افتح القفل للوصول البطاقات البالغ عددها 15 في هذه المجموعة.
فتح الحزمة
k this deck
6
A community has a nighttime energy demand of 50 megawatts, but a peak daytime demand of 75 megawatts. It has the chance to build a 90 megawatt coal fired plant that could easily supply all of its energy uses even at peak daytime demand. Should it necessarily proceed Could there be lower cost options Explain.
فتح الحزمة
افتح القفل للوصول البطاقات البالغ عددها 15 في هذه المجموعة.
فتح الحزمة
k this deck
7
Recall the model of nonrenewable resource extraction presented in Figure 15.7. Suppose that a technological breakthrough means that extraction costs will fall in the future (but not in the present). What will this do to future profits and, therefore, to current user cost Will current extraction increase or decrease Compare this to a situation where future extraction costs remain unchanged but current extraction costs fall. In this situation, does current extraction increase or decrease Does the firm's behavior make sense in both situations That is, does its response to the changes in production costs in each case maximize the firm's stream of profits over time
فتح الحزمة
افتح القفل للوصول البطاقات البالغ عددها 15 في هذه المجموعة.
فتح الحزمة
k this deck
8
If the current market price rises, does current extraction increase or decrease What if the future market price rises Do these changes in current extraction help to assure that the resource is extracted and used when it is most valuable
فتح الحزمة
افتح القفل للوصول البطاقات البالغ عددها 15 في هذه المجموعة.
فتح الحزمة
k this deck
9
Suppose that a government wants to reduce its economy's dependence on coal and decides as a result to tax coal mining companies $1 per ton for every ton of coal that they mine. Assuming that coal mining companies treat this tax as an increase in extraction costs this year, what effect will the tax have on current extraction in the model used in Figure 15.7 Now, think one step ahead. Suppose that the tax will be in place forever, so that it will also affect extraction costs in the future. Will the tax increase or decrease user cost Does this effect increase or decrease the change in current extraction caused by the shift of the EC curve Given your finding, should environmental taxes be temporary
Reference Figure 15.7
Reference Figure 15.7
فتح الحزمة
افتح القفل للوصول البطاقات البالغ عددها 15 في هذه المجموعة.
فتح الحزمة
k this deck
10
User cost is equal to the present value of future profits in the model presented in Figure 15.7. Will the optimal quantity to mine in the present year increase or decrease if the market rate of interest rises Does your result make any intuitive sense (Hint: If interest rates are up, would you want to have more or less money right now to invest at the market rate of interest )
Reference Figure 15.7
Reference Figure 15.7
فتح الحزمة
افتح القفل للوصول البطاقات البالغ عددها 15 في هذه المجموعة.
فتح الحزمة
k this deck
11
Various cultures have come up with their own methods to limit catch size and prevent fishery collapse. In old Hawaii, certain fishing grounds near shore could be used only by certain individuals. And among lobstermen in Maine, strict territorial rights are handed out so that only certain people can harvest lobsters in certain waters. Discuss specifically how these systems provide incentives for conservation. Then think about the enforcement of these property rights. Do you think similar systems could be successfully enforced for deep sea fishing, far off shore
فتح الحزمة
افتح القفل للوصول البطاقات البالغ عددها 15 في هذه المجموعة.
فتح الحزمة
k this deck
12
Aquaculture is the growing of fish, shrimp, and other seafood in enclosed cages or ponds. The cages and ponds not only keep the seafood from swimming away but also provide aquaculturalists with strong property rights over their animals. Does this provide a good incentive for low-cost production as compared with fishing in the open seas where there are few if any property rights
فتح الحزمة
افتح القفل للوصول البطاقات البالغ عددها 15 في هذه المجموعة.
فتح الحزمة
k this deck
13
The figure in the Last Word section shows that at 10-fold increase in a country's GDP per person is associated with about a 20-point increase in EPI. Do you think that this pattern can be extrapolated out into the future That is, could the United States (which currently has an EPI of 78.5) gain another 20 points if it increased its GDP per person by a factor of ten from its current level Explain. (Hint: Consider diminishing returns.)
فتح الحزمة
افتح القفل للوصول البطاقات البالغ عددها 15 في هذه المجموعة.
فتح الحزمة
k this deck
14
Describe Thomas Malthus' theory of human reproduction. Does it make sense for some species - say bacteria or rabbits What do you think makes humans different
فتح الحزمة
افتح القفل للوصول البطاقات البالغ عددها 15 في هذه المجموعة.
فتح الحزمة
k this deck
15
U.S. ENERGY SOURCES AND USES The Energy Information Agency ( www.eia.doe.gov ) of the United States government contains a treasure trove of data about both U.S. and international energy generation and consumption. Go to the Historical Data Overview page at www.eia.doe.gov/overview_hd.html and notice the Energy Flow diagram that appears at the upper right. Click on the diagram to expand it and then look it over. The diagram gives energy consumption and usage for the United States for the most recent year for which data is available. Is the United States totally dependent on oil imports What fraction of its oil consumption does it have to import Is it strange that even though the country is a net importer of petroleum, it exports some petroleum, too What about the overall energy situation What percentage of its overall energy consumption can it fulfill with domestically produced energy What fraction of domestic production comes from renewable energy sources Is this higher or lower than you were expecting
فتح الحزمة
افتح القفل للوصول البطاقات البالغ عددها 15 في هذه المجموعة.
فتح الحزمة
k this deck
فتح الحزمة
افتح القفل للوصول البطاقات البالغ عددها 15 في هذه المجموعة.


