Deck 5: Normal Probability Distributions
ملء الشاشة (f)
سؤال
سؤال
سؤال
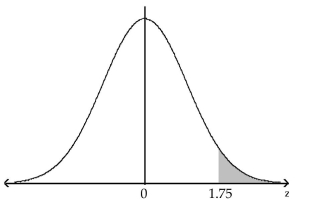
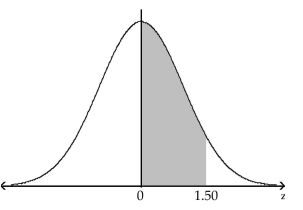
Find the area of the indicated region under the standard normal curve. 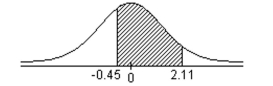
A)0.6562
B)1.309
C)0.3438
D)0.309
A)0.6562
B)1.309
C)0.3438
D)0.309
سؤال
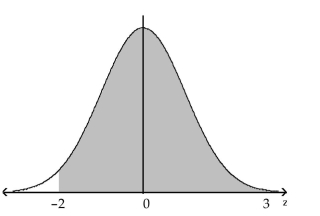
Find the area of the indicated region under the standard normal curve. 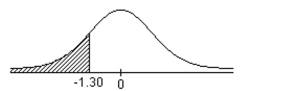
A)0.0968
B)0.9032
C)0.4032
D)0.0823
A)0.0968
B)0.9032
C)0.4032
D)0.0823
سؤال
سؤال
سؤال
سؤال
سؤال
سؤال
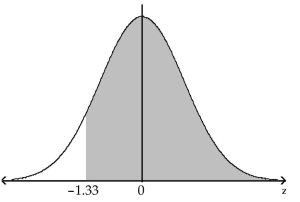
Find the area of the indicated region under the standard normal curve. 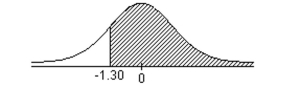
A)0.9032
B)0.0968
C)0.0823
D)0.9177
A)0.9032
B)0.0968
C)0.0823
D)0.9177
سؤال
Determine whether the graph could represent a variable with a normal distribution. Explain your reasoning. 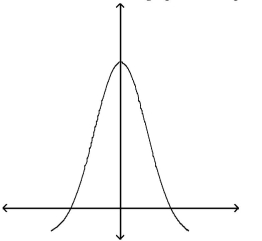
A)No, the graph crosses the x-axis.
B)No, the graph is skewed right.
C)No, the graph is not symmetric.
D)Yes, the graph fulfills the properties of the normal distribution.
A)No, the graph crosses the x-axis.
B)No, the graph is skewed right.
C)No, the graph is not symmetric.
D)Yes, the graph fulfills the properties of the normal distribution.
سؤال
Determine whether the graph could represent a variable with a normal distribution. Explain your reasoning. 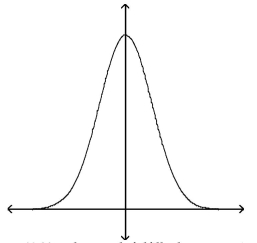
A)Yes, the graph fulfills the properties of the normal distribution
B)No, the graph is skewed left.
C)No, the graph crosses the x-axis.
D)No, the graph is not symmetric.
A)Yes, the graph fulfills the properties of the normal distribution
B)No, the graph is skewed left.
C)No, the graph crosses the x-axis.
D)No, the graph is not symmetric.
سؤال
سؤال
سؤال
سؤال
سؤال
Determine whether the graph could represent a variable with a normal distribution. Explain your reasoning. 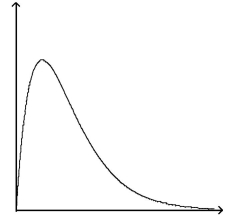
A)No, the graph is skewed right.
B)No, the graph crosses the x-axis.
C)No, the graph is skewed left.
D)Yes, the graph fulfills the properties of the normal distribution
A)No, the graph is skewed right.
B)No, the graph crosses the x-axis.
C)No, the graph is skewed left.
D)Yes, the graph fulfills the properties of the normal distribution
سؤال
You are performing a study about the weight of preschoolers. A previous study found the weights to be
normally distributed with a mean of 30 and a standard deviation of 4. You randomly sample 30 preschool
children and find their weights to be as follows.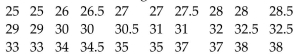 a)Draw a histogram to display these data. Use seven classes. Do the weights appear to be normally
distributed? Explain.
b)Find the mean and standard deviation of your sample.
c)Is there a high probability that the mean and standard deviation of your sample are consistent
with those found in previous studies? Explain your reasoning.
normally distributed with a mean of 30 and a standard deviation of 4. You randomly sample 30 preschool
children and find their weights to be as follows.
a)Draw a histogram to display these data. Use seven classes. Do the weights appear to be normallydistributed? Explain.
b)Find the mean and standard deviation of your sample.
c)Is there a high probability that the mean and standard deviation of your sample are consistent
with those found in previous studies? Explain your reasoning.
سؤال
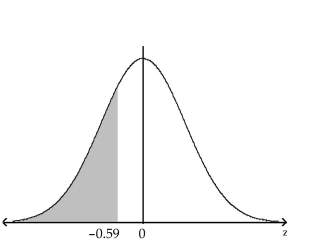
Find the area of the indicated region under the standard normal curve. 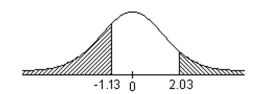
A)0.1504
B)0.1292
C)0.8489
D)0.0212
A)0.1504
B)0.1292
C)0.8489
D)0.0212
سؤال
سؤال
Find the probability of z occurring in the indicated region.
A)0.0401
B)0.0668
C)0.9599
D)0.0228
A)0.0401
B)0.0668
C)0.9599
D)0.0228
سؤال
سؤال
سؤال
سؤال
سؤال
سؤال
سؤال
Find the probability of z occurring in the indicated region.

A)0.9656
B)0.0344
C)0.9772
D)0.4656
A)0.9656
B)0.0344
C)0.9772
D)0.4656
سؤال
سؤال
سؤال
سؤال
سؤال
سؤال
Find the probability of z occurring in the indicated region.
 3
3
A)0.9772
B)0.0228
C)0.9544
D)0.0456
3A)0.9772
B)0.0228
C)0.9544
D)0.0456
سؤال
سؤال
سؤال
سؤال
Find the probability of z occurring in the indicated region.
A)0.2776
B)0.7224
C)0.2224
D)0.1894
A)0.2776
B)0.7224
C)0.2224
D)0.1894
سؤال
Find the probability of z occurring in the indicated region.
A)0.9082
B)0.0918
C)0.9332
D)0.0668
A)0.9082
B)0.0918
C)0.9332
D)0.0668
سؤال
Find the probability of z occurring in the indicated region.
A)0.4332
B)0.5668
C)0.0668
D)0.9332
A)0.4332
B)0.5668
C)0.0668
D)0.9332
سؤال
سؤال
سؤال
سؤال
سؤال
سؤال
سؤال
سؤال
The graph depicts IQ scores of adults, and those scores are normally distributed with a mean of 100 and a standard deviation of 15. Find the probability that a member selected at random is from the shaded area of the
Graph.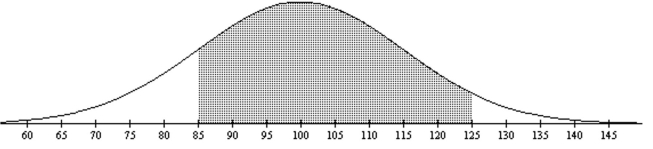
A)0.7938
B)0.7745
C)0.7303
D)0.7619
Graph.
A)0.7938
B)0.7745
C)0.7303
D)0.7619
سؤال
سؤال
سؤال
سؤال
سؤال
سؤال
سؤال
سؤال
سؤال
سؤال
سؤال
سؤال
The graph depicts IQ scores of adults, and those scores are normally distributed with a mean of 100 and a standard deviation of 15. Find the probability that a member selected at random is from the shaded area of the
Graph.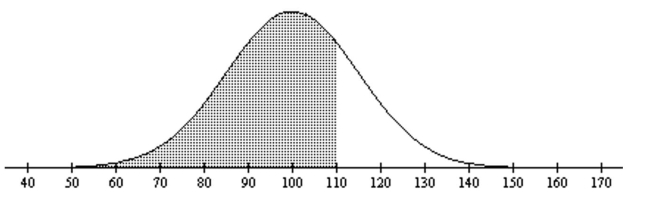
A)0.7486
B)0.4400
C)0.6293
D)0.8051
Graph.
A)0.7486
B)0.4400
C)0.6293
D)0.8051
سؤال
سؤال
سؤال
سؤال
سؤال
سؤال
Find the z-score that corresponds to the given area under the standard normal curve. 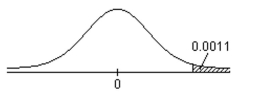
سؤال
سؤال
Provide an appropriate response. Use the Standard Normal Table to find the probability.
An airline knows from experience that the distribution of the number of suitcases that get lost each week on a
certain route is approximately normal with = 15.5 and
  = 3.6. In one year, how many weeks would you
expect the airline to lose between 10 and 20 suitcases?
An airline knows from experience that the distribution of the number of suitcases that get lost each week on a
certain route is approximately normal with
= 15.5 and = 3.6. In one year, how many weeks would youexpect the airline to lose between 10 and 20 suitcases?
سؤال
سؤال
سؤال
سؤال
Find the z-score that corresponds to the given area under the standard normal curve. 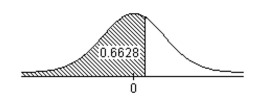
سؤال
سؤال
Provide an appropriate response. Use the Standard Normal Table to find the probability.
The distribution of cholesterol levels in teenage boys is approximately normal with = 170 and
  = 30. Levels
above 200 warrant attention. If 95 teenage boys are examined, how many would you expect to have cholesterol
levels greater than 225?
The distribution of cholesterol levels in teenage boys is approximately normal with
= 170 and = 30. Levelsabove 200 warrant attention. If 95 teenage boys are examined, how many would you expect to have cholesterol
levels greater than 225?
سؤال
سؤال
Find the z-score that corresponds to the given area under the standard normal curve. 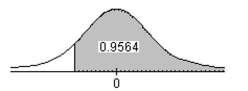
سؤال
سؤال
سؤال
Find the z-score that corresponds to the given area under the standard normal curve. 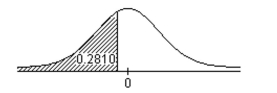
سؤال

فتح الحزمة
قم بالتسجيل لفتح البطاقات في هذه المجموعة!
Unlock Deck
Unlock Deck
1/158
العب
ملء الشاشة (f)
Deck 5: Normal Probability Distributions
1
Find the area under the standard normal curve to the left of z = 1.25.
A)0.8944
B)0.1056
C)0.2318
D)0.7682
A)0.8944
B)0.1056
C)0.2318
D)0.7682
0.8944
2
Find the area under the standard normal curve between z = -1.5 and z = 2.5.
A)0.9270
B)0.7182
C)0.6312
D)0.9831
A)0.9270
B)0.7182
C)0.6312
D)0.9831
0.9270
3
Find the area of the indicated region under the standard normal curve.
A)0.6562
B)1.309
C)0.3438
D)0.309
A)0.6562
B)1.309
C)0.3438
D)0.309
0.6562
4
Find the area of the indicated region under the standard normal curve.
A)0.0968
B)0.9032
C)0.4032
D)0.0823
A)0.0968
B)0.9032
C)0.4032
D)0.0823
فتح الحزمة
افتح القفل للوصول البطاقات البالغ عددها 158 في هذه المجموعة.
فتح الحزمة
k this deck
5
Find the area under the standard normal curve to the right of z = 1.
A)0.1587
B)0.8413
C)0.1397
D)0.5398
A)0.1587
B)0.8413
C)0.1397
D)0.5398
فتح الحزمة
افتح القفل للوصول البطاقات البالغ عددها 158 في هذه المجموعة.
فتح الحزمة
k this deck
6
Find the area under the standard normal curve between z = 1 and z = 2.
A)0.1359
B)0.8413
C)0.5398
D)0.2139
A)0.1359
B)0.8413
C)0.5398
D)0.2139
فتح الحزمة
افتح القفل للوصول البطاقات البالغ عددها 158 في هذه المجموعة.
فتح الحزمة
k this deck
7
Find the area under the standard normal curve between z = -1.25 and z = 1.25.
A)0.7888
B)0.8817
C)0.6412
D)0.2112
A)0.7888
B)0.8817
C)0.6412
D)0.2112
فتح الحزمة
افتح القفل للوصول البطاقات البالغ عددها 158 في هذه المجموعة.
فتح الحزمة
k this deck
8
Find the area under the standard normal curve between z = 0 and z = 3.
A)0.4987
B)0.9987
C)0.0010
D)0.4641
A)0.4987
B)0.9987
C)0.0010
D)0.4641
فتح الحزمة
افتح القفل للوصول البطاقات البالغ عددها 158 في هذه المجموعة.
فتح الحزمة
k this deck
9
Find the area under the standard normal curve to the right of z = -1.25.
A)0.8944
B)0.5843
C)0.6978
D)0.7193
A)0.8944
B)0.5843
C)0.6978
D)0.7193
فتح الحزمة
افتح القفل للوصول البطاقات البالغ عددها 158 في هذه المجموعة.
فتح الحزمة
k this deck
10
Find the area of the indicated region under the standard normal curve.
A)0.9032
B)0.0968
C)0.0823
D)0.9177
A)0.9032
B)0.0968
C)0.0823
D)0.9177
فتح الحزمة
افتح القفل للوصول البطاقات البالغ عددها 158 في هذه المجموعة.
فتح الحزمة
k this deck
11
Determine whether the graph could represent a variable with a normal distribution. Explain your reasoning.
A)No, the graph crosses the x-axis.
B)No, the graph is skewed right.
C)No, the graph is not symmetric.
D)Yes, the graph fulfills the properties of the normal distribution.
A)No, the graph crosses the x-axis.
B)No, the graph is skewed right.
C)No, the graph is not symmetric.
D)Yes, the graph fulfills the properties of the normal distribution.
فتح الحزمة
افتح القفل للوصول البطاقات البالغ عددها 158 في هذه المجموعة.
فتح الحزمة
k this deck
12
Determine whether the graph could represent a variable with a normal distribution. Explain your reasoning.
A)Yes, the graph fulfills the properties of the normal distribution
B)No, the graph is skewed left.
C)No, the graph crosses the x-axis.
D)No, the graph is not symmetric.
A)Yes, the graph fulfills the properties of the normal distribution
B)No, the graph is skewed left.
C)No, the graph crosses the x-axis.
D)No, the graph is not symmetric.
فتح الحزمة
افتح القفل للوصول البطاقات البالغ عددها 158 في هذه المجموعة.
فتح الحزمة
k this deck
13
Find the area under the standard normal curve to the left of z = 1.5.
A)0.9332
B)0.0668
C)0.5199
D)0.7612
A)0.9332
B)0.0668
C)0.5199
D)0.7612
فتح الحزمة
افتح القفل للوصول البطاقات البالغ عددها 158 في هذه المجموعة.
فتح الحزمة
k this deck
14
Find the sum of the areas under the standard normal curve to the left of z = -1.25 and to the right of z = 1.25.
A)0.2112
B)0.7888
C)0.1056
D)0.3944
A)0.2112
B)0.7888
C)0.1056
D)0.3944
فتح الحزمة
افتح القفل للوصول البطاقات البالغ عددها 158 في هذه المجموعة.
فتح الحزمة
k this deck
15
The ACT is an exam used by colleges and universities to evaluate undergraduate applicants. The test scores are
normally distributed. In a recent year, the mean test score was 22.2 and the standard deviation was 4.9. The test
scores of four students selected at random are 16, 24, 9, and 35.
a)Find the z-scores that correspond to each value.
b)Determine whether any of the values are unusual.
normally distributed. In a recent year, the mean test score was 22.2 and the standard deviation was 4.9. The test
scores of four students selected at random are 16, 24, 9, and 35.
a)Find the z-scores that correspond to each value.
b)Determine whether any of the values are unusual.
فتح الحزمة
افتح القفل للوصول البطاقات البالغ عددها 158 في هذه المجموعة.
فتح الحزمة
k this deck
16
Find the area under the standard normal curve between z = 1.5 and z = 2.5.
A)0.0606
B)0.9938
C)0.9332
D)0.9816
A)0.0606
B)0.9938
C)0.9332
D)0.9816
فتح الحزمة
افتح القفل للوصول البطاقات البالغ عددها 158 في هذه المجموعة.
فتح الحزمة
k this deck
17
Determine whether the graph could represent a variable with a normal distribution. Explain your reasoning.
A)No, the graph is skewed right.
B)No, the graph crosses the x-axis.
C)No, the graph is skewed left.
D)Yes, the graph fulfills the properties of the normal distribution
A)No, the graph is skewed right.
B)No, the graph crosses the x-axis.
C)No, the graph is skewed left.
D)Yes, the graph fulfills the properties of the normal distribution
فتح الحزمة
افتح القفل للوصول البطاقات البالغ عددها 158 في هذه المجموعة.
فتح الحزمة
k this deck
18
You are performing a study about the weight of preschoolers. A previous study found the weights to be
normally distributed with a mean of 30 and a standard deviation of 4. You randomly sample 30 preschool
children and find their weights to be as follows. a)Draw a histogram to display these data. Use seven classes. Do the weights appear to be normally
distributed? Explain.
b)Find the mean and standard deviation of your sample.
c)Is there a high probability that the mean and standard deviation of your sample are consistent
with those found in previous studies? Explain your reasoning.
normally distributed with a mean of 30 and a standard deviation of 4. You randomly sample 30 preschool
children and find their weights to be as follows.
a)Draw a histogram to display these data. Use seven classes. Do the weights appear to be normallydistributed? Explain.
b)Find the mean and standard deviation of your sample.
c)Is there a high probability that the mean and standard deviation of your sample are consistent
with those found in previous studies? Explain your reasoning.
فتح الحزمة
افتح القفل للوصول البطاقات البالغ عددها 158 في هذه المجموعة.
فتح الحزمة
k this deck
19
Find the area of the indicated region under the standard normal curve.
A)0.1504
B)0.1292
C)0.8489
D)0.0212
A)0.1504
B)0.1292
C)0.8489
D)0.0212
فتح الحزمة
افتح القفل للوصول البطاقات البالغ عددها 158 في هذه المجموعة.
فتح الحزمة
k this deck
20
The SAT is an exam used by colleges and universities to evaluate undergraduate applicants. The test scores are
normally distributed. In a recent year, the mean test score was 1475 and the standard deviation was 308. The
test scores of four students selected at random are 1930, 1340, 2150, and 1450.
a)Find the z-scores that correspond to each value
b)Determine whether any of the values are unusual.
normally distributed. In a recent year, the mean test score was 1475 and the standard deviation was 308. The
test scores of four students selected at random are 1930, 1340, 2150, and 1450.
a)Find the z-scores that correspond to each value
b)Determine whether any of the values are unusual.
فتح الحزمة
افتح القفل للوصول البطاقات البالغ عددها 158 في هذه المجموعة.
فتح الحزمة
k this deck
21
Find the probability of z occurring in the indicated region.
A)0.0401
B)0.0668
C)0.9599
D)0.0228
A)0.0401
B)0.0668
C)0.9599
D)0.0228
فتح الحزمة
افتح القفل للوصول البطاقات البالغ عددها 158 في هذه المجموعة.
فتح الحزمة
k this deck
22
Use the standard normal distribution to find 2.25).
A)0.4878
B)0.5122
C)0.8817
D)0.7888
A)0.4878
B)0.5122
C)0.8817
D)0.7888
فتح الحزمة
افتح القفل للوصول البطاقات البالغ عددها 158 في هذه المجموعة.
فتح الحزمة
k this deck
23
For the standard normal curve, find the z-score that corresponds to the third quartile.
A)0.67
B)-0.67
C)0.77
D)-0.23
A)0.67
B)-0.67
C)0.77
D)-0.23
فتح الحزمة
افتح القفل للوصول البطاقات البالغ عددها 158 في هذه المجموعة.
فتح الحزمة
k this deck
24
IQ test scores are normally distributed with a mean of 100 and a standard deviation of 15. An individualʹs IQ score is found to be 90. Find the z-score corresponding to this value.
A)-0.67
B)0.67
C)1.33
D)-1.33
A)-0.67
B)0.67
C)1.33
D)-1.33
فتح الحزمة
افتح القفل للوصول البطاقات البالغ عددها 158 في هذه المجموعة.
فتح الحزمة
k this deck
25
For the standard normal curve, find the z-score that corresponds to the first quartile.
A)-0.67
B)0.67
C)0.77
D)-0.23
A)-0.67
B)0.67
C)0.77
D)-0.23
فتح الحزمة
افتح القفل للوصول البطاقات البالغ عددها 158 في هذه المجموعة.
فتح الحزمة
k this deck
26
IQ test scores are normally distributed with a mean of 100 and a standard deviation of 15. An individualʹs IQ score is found to be 110. Find the z-score corresponding to this value.
A)0.67
B)-0.67
C)1.33
D)-1.33
A)0.67
B)-0.67
C)1.33
D)-1.33
فتح الحزمة
افتح القفل للوصول البطاقات البالغ عددها 158 في هذه المجموعة.
فتح الحزمة
k this deck
27
Use the standard normal distribution to find P(
A)0.9270
B)0.8822
C)0.6167
D)0.5496
A)0.9270
B)0.8822
C)0.6167
D)0.5496
فتح الحزمة
افتح القفل للوصول البطاقات البالغ عددها 158 في هذه المجموعة.
فتح الحزمة
k this deck
28
Find the probability of z occurring in the indicated region.
A)0.9656
B)0.0344
C)0.9772
D)0.4656
A)0.9656
B)0.0344
C)0.9772
D)0.4656
فتح الحزمة
افتح القفل للوصول البطاقات البالغ عددها 158 في هذه المجموعة.
فتح الحزمة
k this deck
29
Assume that the random variable X is normally distributed, with mean = 60 and standard deviation = 12. Compute the probability
A)0.8944
B)0.8849
C)0.1056
D)0.9015
A)0.8944
B)0.8849
C)0.1056
D)0.9015
فتح الحزمة
افتح القفل للوصول البطاقات البالغ عددها 158 في هذه المجموعة.
فتح الحزمة
k this deck
30
For the standard normal curve, find the z-score that corresponds to the first decile.
A)-1.28
B)1.28
C)-2.33
D)0.16
A)-1.28
B)1.28
C)-2.33
D)0.16
فتح الحزمة
افتح القفل للوصول البطاقات البالغ عددها 158 في هذه المجموعة.
فتح الحزمة
k this deck
31
Assume that the random variable X is normally distributed, with mean = 80 and standard deviation = 15. Compute the probability
A)0.2119
B)0.1977
C)0.7881
D)0.2420
A)0.2119
B)0.1977
C)0.7881
D)0.2420
فتح الحزمة
افتح القفل للوصول البطاقات البالغ عددها 158 في هذه المجموعة.
فتح الحزمة
k this deck
32
Use the standard normal distribution to find P(-2.25 < z < 1.25).
A)0.8822
B)0.0122
C)0.4878
D)0.8944
A)0.8822
B)0.0122
C)0.4878
D)0.8944
فتح الحزمة
افتح القفل للوصول البطاقات البالغ عددها 158 في هذه المجموعة.
فتح الحزمة
k this deck
33
Use the standard normal distribution to find P(z < -2.33 or z > 2.33).
A)0.0198
B)0.9802
C)0.7888
D)0.0606
A)0.0198
B)0.9802
C)0.7888
D)0.0606
فتح الحزمة
افتح القفل للوصول البطاقات البالغ عددها 158 في هذه المجموعة.
فتح الحزمة
k this deck
34
Find the probability of z occurring in the indicated region.
3
A)0.9772
B)0.0228
C)0.9544
D)0.0456
3A)0.9772
B)0.0228
C)0.9544
D)0.0456
فتح الحزمة
افتح القفل للوصول البطاقات البالغ عددها 158 في هذه المجموعة.
فتح الحزمة
k this deck
35
Use the standard normal distribution to find P(
A)0.4878
B)0.5122
C)0.6831
D)0.0122
A)0.4878
B)0.5122
C)0.6831
D)0.0122
فتح الحزمة
افتح القفل للوصول البطاقات البالغ عددها 158 في هذه المجموعة.
فتح الحزمة
k this deck
36
Assume that the random variable X is normally distributed, with mean = 60 and standard deviation = 8. Compute the probability
A)0.8914
B)0.8819
C)0.8944
D)0.7888
A)0.8914
B)0.8819
C)0.8944
D)0.7888
فتح الحزمة
افتح القفل للوصول البطاقات البالغ عددها 158 في هذه المجموعة.
فتح الحزمة
k this deck
37
IQ test scores are normally distributed with a mean of 100 and a standard deviation of 15. An individualʹs IQ score is found to be 120. Find the z-score corresponding to this value.
A)1.33
B)-0.67
C)0.67
D)-1.33
A)1.33
B)-0.67
C)0.67
D)-1.33
فتح الحزمة
افتح القفل للوصول البطاقات البالغ عددها 158 في هذه المجموعة.
فتح الحزمة
k this deck
38
Find the probability of z occurring in the indicated region.
A)0.2776
B)0.7224
C)0.2224
D)0.1894
A)0.2776
B)0.7224
C)0.2224
D)0.1894
فتح الحزمة
افتح القفل للوصول البطاقات البالغ عددها 158 في هذه المجموعة.
فتح الحزمة
k this deck
39
Find the probability of z occurring in the indicated region.
A)0.9082
B)0.0918
C)0.9332
D)0.0668
A)0.9082
B)0.0918
C)0.9332
D)0.0668
فتح الحزمة
افتح القفل للوصول البطاقات البالغ عددها 158 في هذه المجموعة.
فتح الحزمة
k this deck
40
Find the probability of z occurring in the indicated region.
A)0.4332
B)0.5668
C)0.0668
D)0.9332
A)0.4332
B)0.5668
C)0.0668
D)0.9332
فتح الحزمة
افتح القفل للوصول البطاقات البالغ عددها 158 في هذه المجموعة.
فتح الحزمة
k this deck
41
The lengths of pregnancies of humans are normally distributed with a mean of 268 days and a standard deviation of 15 days. Find the probability of a pregnancy lasting more than 300 days.
A)0.0166
B)0.9834
C)0.2375
D)0.3189
A)0.0166
B)0.9834
C)0.2375
D)0.3189
فتح الحزمة
افتح القفل للوصول البطاقات البالغ عددها 158 في هذه المجموعة.
فتح الحزمة
k this deck
42
The distribution of cholesterol levels in teenage boys is approximately normal with = 170 and = 30 (Source: U.S. National Center for Health Statistics). Levels above 200 warrant attention. What percent of teenage boys
Have levels between 170 and 225?
A)3.36%
B)6.06%
C)46.64%
D)56.13%
Have levels between 170 and 225?
A)3.36%
B)6.06%
C)46.64%
D)56.13%
فتح الحزمة
افتح القفل للوصول البطاقات البالغ عددها 158 في هذه المجموعة.
فتح الحزمة
k this deck
43
Assume that the heights of women are normally distributed with a mean of 63.6 inches and a standard deviation of 2.5 inches. The cheerleaders for a local professional basketball team must be between 65.5 and 68.0
Inches. If a woman is randomly selected, what is the probability that her height is between 65.5 and 68.0
Inches?
A)0.1844
B)0.9608
C)0.7881
D)0.3112
Inches. If a woman is randomly selected, what is the probability that her height is between 65.5 and 68.0
Inches?
A)0.1844
B)0.9608
C)0.7881
D)0.3112
فتح الحزمة
افتح القفل للوصول البطاقات البالغ عددها 158 في هذه المجموعة.
فتح الحزمة
k this deck
44
The distribution of cholesterol levels in teenage boys is approximately normal with = 170 and = 30 (Source: U.S. National Center for Health Statistics). Levels above 200 warrant attention. Find the probability that a
Teenage boy has a cholesterol level greater than 200.
A)0.1587
B)0.8413
C)0.3419
D)0.2138
Teenage boy has a cholesterol level greater than 200.
A)0.1587
B)0.8413
C)0.3419
D)0.2138
فتح الحزمة
افتح القفل للوصول البطاقات البالغ عددها 158 في هذه المجموعة.
فتح الحزمة
k this deck
45
Assume that the salaries of elementary school teachers in the United States are normally distributed with a mean of $32,000 and a standard deviation of $3000. If a teacher is selected at random, find the probability that
He or she makes more than $36,000.
A)0.0918
B)0.9082
C)0.1056
D)0.4040
He or she makes more than $36,000.
A)0.0918
B)0.9082
C)0.1056
D)0.4040
فتح الحزمة
افتح القفل للوصول البطاقات البالغ عددها 158 في هذه المجموعة.
فتح الحزمة
k this deck
46
Assume that the salaries of elementary school teachers in the United States are normally distributed with a mean of $32,000 and a standard deviation of $3000. If a teacher is selected at random, find the probability that
He or she makes less than $28,000.
A)0.0918
B)0.9981
C)0.2113
D)0.9827
He or she makes less than $28,000.
A)0.0918
B)0.9981
C)0.2113
D)0.9827
فتح الحزمة
افتح القفل للوصول البطاقات البالغ عددها 158 في هذه المجموعة.
فتح الحزمة
k this deck
47
An airline knows from experience that the distribution of the number of suitcases that get lost each week on a certain route is approximately normal with = 15.5 and = 3.6. What is the probability that during a given
Week the airline will lose less than 20 suitcases?
A)0.8944
B)0.3944
C)0.1056
D)0.4040
Week the airline will lose less than 20 suitcases?
A)0.8944
B)0.3944
C)0.1056
D)0.4040
فتح الحزمة
افتح القفل للوصول البطاقات البالغ عددها 158 في هذه المجموعة.
فتح الحزمة
k this deck
48
The graph depicts IQ scores of adults, and those scores are normally distributed with a mean of 100 and a standard deviation of 15. Find the probability that a member selected at random is from the shaded area of the
Graph.
A)0.7938
B)0.7745
C)0.7303
D)0.7619
Graph.
A)0.7938
B)0.7745
C)0.7303
D)0.7619
فتح الحزمة
افتح القفل للوصول البطاقات البالغ عددها 158 في هذه المجموعة.
فتح الحزمة
k this deck
49
The lengths of pregnancies of humans are normally distributed with a mean of 268 days and a standard deviation of 15 days. A baby is premature if it is born three weeks early. What percent of babies are born
Prematurely?
A)8.08%
B)6.81%
C)9.21%
D)10.31%
Prematurely?
A)8.08%
B)6.81%
C)9.21%
D)10.31%
فتح الحزمة
افتح القفل للوصول البطاقات البالغ عددها 158 في هذه المجموعة.
فتح الحزمة
k this deck
50
Assume that the heights of women are normally distributed with a mean of 63.6 inches and a standard
deviation of 2.5 inches. The U.S. Army requires that the heights of women be between 58 and 80 inches. If a
woman is randomly selected, what is the probability that her height is between 58 and 80 inches?
deviation of 2.5 inches. The U.S. Army requires that the heights of women be between 58 and 80 inches. If a
woman is randomly selected, what is the probability that her height is between 58 and 80 inches?
فتح الحزمة
افتح القفل للوصول البطاقات البالغ عددها 158 في هذه المجموعة.
فتح الحزمة
k this deck
51
IQ test scores are normally distributed with a mean of 100 and a standard deviation of 15. Find the IQ score that corresponds to a z-score of 1.96.
A)129.4
B)115.6
C)122.4
D)132.1
A)129.4
B)115.6
C)122.4
D)132.1
فتح الحزمة
افتح القفل للوصول البطاقات البالغ عددها 158 في هذه المجموعة.
فتح الحزمة
k this deck
52
An airline knows from experience that the distribution of the number of suitcases that get lost each week on a certain route is approximately normal with = 15.5 and = 3.6. What is the probability that during a given
Week the airline will lose between 10 and 20 suitcases?
A)0.8314
B)0.3944
C)0.1056
D)0.4040
Week the airline will lose between 10 and 20 suitcases?
A)0.8314
B)0.3944
C)0.1056
D)0.4040
فتح الحزمة
افتح القفل للوصول البطاقات البالغ عددها 158 في هذه المجموعة.
فتح الحزمة
k this deck
53
The lengths of pregnancies of humans are normally distributed with a mean of 268 days and a standard deviation of 15 days. Find the probability of a pregnancy lasting less than 250 days.
A)0.1151
B)0.1591
C)0.0606
D)0.0066
A)0.1151
B)0.1591
C)0.0606
D)0.0066
فتح الحزمة
افتح القفل للوصول البطاقات البالغ عددها 158 في هذه المجموعة.
فتح الحزمة
k this deck
54
The distribution of cholesterol levels in teenage boys is approximately normal with = 170 and = 30 (Source: U.S. National Center for Health Statistics). Levels above 200 warrant attention. Find the probability that a
Teenage boy has a cholesterol level greater than 225.
A)0.0336
B)0.0606
C)0.0718
D)0.0012
Teenage boy has a cholesterol level greater than 225.
A)0.0336
B)0.0606
C)0.0718
D)0.0012
فتح الحزمة
افتح القفل للوصول البطاقات البالغ عددها 158 في هذه المجموعة.
فتح الحزمة
k this deck
55
Assume that the heights of American men are normally distributed with a mean of 69.0 inches and a standard deviation of 2.8 inches. The U.S. Marine Corps requires that men have heights between 64 and 78 inches. Find
The percent of men meeting these height requirements.
A)96.26%
B)3.67%
C)99.93%
D)31.12%
The percent of men meeting these height requirements.
A)96.26%
B)3.67%
C)99.93%
D)31.12%
فتح الحزمة
افتح القفل للوصول البطاقات البالغ عددها 158 في هذه المجموعة.
فتح الحزمة
k this deck
56
An airline knows from experience that the distribution of the number of suitcases that get lost each week on a certain route is approximately normal with = 15.5 and = 3.6. What is the probability that during a given
Week the airline will lose more than 20 suitcases?
A)0.1056
B)0.3944
C)0.4040
D)0.8944
Week the airline will lose more than 20 suitcases?
A)0.1056
B)0.3944
C)0.4040
D)0.8944
فتح الحزمة
افتح القفل للوصول البطاقات البالغ عددها 158 في هذه المجموعة.
فتح الحزمة
k this deck
57
Assume that blood pressure readings are normally distributed with = 120 and = 8. A blood pressure reading of 145 or more may require medical attention. What percent of people have a blood pressure reading
Greater than 145?
A)0.09%
B)99.91%
C)6.06%
D)11.09%
Greater than 145?
A)0.09%
B)99.91%
C)6.06%
D)11.09%
فتح الحزمة
افتح القفل للوصول البطاقات البالغ عددها 158 في هذه المجموعة.
فتح الحزمة
k this deck
58
IQ test scores are normally distributed with a mean of 105 and a standard deviation of 11. An individualʹs IQ score is found to be 119. Find the z-score corresponding to this value.
A)1.27
B)-1.27
C)0.79
D)-0.79
A)1.27
B)-1.27
C)0.79
D)-0.79
فتح الحزمة
افتح القفل للوصول البطاقات البالغ عددها 158 في هذه المجموعة.
فتح الحزمة
k this deck
59
IQ test scores are normally distributed with a mean of 104 and a standard deviation of 15. An individualʹs IQ score is found to be 111. Find the z-score corresponding to this value.
A)0.47
B)-0.47
C)2.14
D)-2.14
A)0.47
B)-0.47
C)2.14
D)-2.14
فتح الحزمة
افتح القفل للوصول البطاقات البالغ عددها 158 في هذه المجموعة.
فتح الحزمة
k this deck
60
The graph depicts IQ scores of adults, and those scores are normally distributed with a mean of 100 and a standard deviation of 15. Find the probability that a member selected at random is from the shaded area of the
Graph.
A)0.7486
B)0.4400
C)0.6293
D)0.8051
Graph.
A)0.7486
B)0.4400
C)0.6293
D)0.8051
فتح الحزمة
افتح القفل للوصول البطاقات البالغ عددها 158 في هذه المجموعة.
فتح الحزمة
k this deck
61
Find the z-score for which 99% of the distributionʹs area lies between -z and z.
A)(-2.575, 2.575)
B)(-1.645, 1.645)
C)(-2.33, 2.33)
D)(-1.28, 1.28)
A)(-2.575, 2.575)
B)(-1.645, 1.645)
C)(-2.33, 2.33)
D)(-1.28, 1.28)
فتح الحزمة
افتح القفل للوصول البطاقات البالغ عددها 158 في هذه المجموعة.
فتح الحزمة
k this deck
62
Find the z-score that has 84.85% of the distributionʹs area to its right.
A)-1.03
B)1.03
C)-0.39
D)0.39
A)-1.03
B)1.03
C)-0.39
D)0.39
فتح الحزمة
افتح القفل للوصول البطاقات البالغ عددها 158 في هذه المجموعة.
فتح الحزمة
k this deck
63
Use a standard normal table to find the z-score that corresponds to the percentile.
A)0.84
B)1.405
C)2.41
D)0.2
A)0.84
B)1.405
C)2.41
D)0.2
فتح الحزمة
افتح القفل للوصول البطاقات البالغ عددها 158 في هذه المجموعة.
فتح الحزمة
k this deck
64
Provide an appropriate response. Use the Standard Normal Table to find the probability.
The lengths of pregnancies are normally distributed with a mean of 268 days and a standard deviation of 15
days. Out of 50 pregnancies, how many would you expect to last less than 250 days?
The lengths of pregnancies are normally distributed with a mean of 268 days and a standard deviation of 15
days. Out of 50 pregnancies, how many would you expect to last less than 250 days?
فتح الحزمة
افتح القفل للوصول البطاقات البالغ عددها 158 في هذه المجموعة.
فتح الحزمة
k this deck
65
For the standard normal curve, find the z-score that corresponds to the percentile.
A)-0.53
B)-0.98
C)-0.47
D)-0.12
A)-0.53
B)-0.98
C)-0.47
D)-0.12
فتح الحزمة
افتح القفل للوصول البطاقات البالغ عددها 158 في هذه المجموعة.
فتح الحزمة
k this deck
66
Find the z-score that corresponds to the given area under the standard normal curve.
فتح الحزمة
افتح القفل للوصول البطاقات البالغ عددها 158 في هذه المجموعة.
فتح الحزمة
k this deck
67
For the standard normal curve, find the z-score that corresponds to the percentile.
A)1.28
B)0.28
C)1.52
D)2.81
A)1.28
B)0.28
C)1.52
D)2.81
فتح الحزمة
افتح القفل للوصول البطاقات البالغ عددها 158 في هذه المجموعة.
فتح الحزمة
k this deck
68
Provide an appropriate response. Use the Standard Normal Table to find the probability.
An airline knows from experience that the distribution of the number of suitcases that get lost each week on a
certain route is approximately normal with = 15.5 and = 3.6. In one year, how many weeks would you
expect the airline to lose between 10 and 20 suitcases?
An airline knows from experience that the distribution of the number of suitcases that get lost each week on a
certain route is approximately normal with
= 15.5 and = 3.6. In one year, how many weeks would youexpect the airline to lose between 10 and 20 suitcases?
فتح الحزمة
افتح القفل للوصول البطاقات البالغ عددها 158 في هذه المجموعة.
فتح الحزمة
k this deck
69
Provide an appropriate response. Use the Standard Normal Table to find the probability.
Assume that the heights of women are normally distributed with a mean of 63.6 inches and a standard
deviation of 2.5 inches. The U.S. Army requires that the heights of women be between 58 and 80 inches. If 200
women want to enlist in the U.S. Army, how many would you expect to meet the height requirements?
فتح الحزمة
افتح القفل للوصول البطاقات البالغ عددها 158 في هذه المجموعة.
فتح الحزمة
k this deck
70
Find the z-score for which 70% of the distributionʹs area lies to its right.
A)-0.53
B)-0.98
C)-0.81
D)-0.47
A)-0.53
B)-0.98
C)-0.81
D)-0.47
فتح الحزمة
افتح القفل للوصول البطاقات البالغ عددها 158 في هذه المجموعة.
فتح الحزمة
k this deck
71
For the standard normal curve, find the z-score that corresponds to the decile.
A)0.53
B)0.98
C)0.47
D)0.12
A)0.53
B)0.98
C)0.47
D)0.12
فتح الحزمة
افتح القفل للوصول البطاقات البالغ عددها 158 في هذه المجموعة.
فتح الحزمة
k this deck
72
Find the z-score that corresponds to the given area under the standard normal curve.
فتح الحزمة
افتح القفل للوصول البطاقات البالغ عددها 158 في هذه المجموعة.
فتح الحزمة
k this deck
73
Provide an appropriate response. Use the Standard Normal Table to find the probability.
Assume that the heights of men are normally distributed with a mean of 69.0 inches and a standard deviation
of 2.8 inches. The U.S. Marine Corps requires that the heights of men be between 64 and 78 inches. If 500 men
want to enlist in the U.S. Marine Corps, how many would you not expect to meet the height requirements?
فتح الحزمة
افتح القفل للوصول البطاقات البالغ عددها 158 في هذه المجموعة.
فتح الحزمة
k this deck
74
Provide an appropriate response. Use the Standard Normal Table to find the probability.
The distribution of cholesterol levels in teenage boys is approximately normal with = 170 and = 30. Levels
above 200 warrant attention. If 95 teenage boys are examined, how many would you expect to have cholesterol
levels greater than 225?
The distribution of cholesterol levels in teenage boys is approximately normal with
= 170 and = 30. Levelsabove 200 warrant attention. If 95 teenage boys are examined, how many would you expect to have cholesterol
levels greater than 225?
فتح الحزمة
افتح القفل للوصول البطاقات البالغ عددها 158 في هذه المجموعة.
فتح الحزمة
k this deck
75
Find the z-score that is greater than the mean and for which 70% of the distributionʹs area lies to its left.
A)0.53
B)0.98
C)0.81
D)0.47
A)0.53
B)0.98
C)0.81
D)0.47
فتح الحزمة
افتح القفل للوصول البطاقات البالغ عددها 158 في هذه المجموعة.
فتح الحزمة
k this deck
76
Find the z-score that corresponds to the given area under the standard normal curve.
فتح الحزمة
افتح القفل للوصول البطاقات البالغ عددها 158 في هذه المجموعة.
فتح الحزمة
k this deck
77
Use a standard normal table to find the z-score that corresponds to the cumulative area of 0.7019.
A)0.53
B)-0.53
C)0.835
D)-0.835
A)0.53
B)-0.53
C)0.835
D)-0.835
فتح الحزمة
افتح القفل للوصول البطاقات البالغ عددها 158 في هذه المجموعة.
فتح الحزمة
k this deck
78
Find the z-scores for which 98% of the distributionʹs area lies between -z and z.
A)(-2.33, 2.33)
B)(-1.645, 1.645)
C)(-1.96, 1.96)
D)(-0.99, 0.99)
A)(-2.33, 2.33)
B)(-1.645, 1.645)
C)(-1.96, 1.96)
D)(-0.99, 0.99)
فتح الحزمة
افتح القفل للوصول البطاقات البالغ عددها 158 في هذه المجموعة.
فتح الحزمة
k this deck
79
Find the z-score that corresponds to the given area under the standard normal curve.
فتح الحزمة
افتح القفل للوصول البطاقات البالغ عددها 158 في هذه المجموعة.
فتح الحزمة
k this deck
80
Find the z-scores for which 90% of the distributionʹs area lies between -z and z.
A)(-1.645, 1.645)
B)(-2.33, 2.33)
C)(-1.96, 1.96)
D)(-0.99, 0.99)
A)(-1.645, 1.645)
B)(-2.33, 2.33)
C)(-1.96, 1.96)
D)(-0.99, 0.99)
فتح الحزمة
افتح القفل للوصول البطاقات البالغ عددها 158 في هذه المجموعة.
فتح الحزمة
k this deck
فتح الحزمة
افتح القفل للوصول البطاقات البالغ عددها 158 في هذه المجموعة.


