Deck 11: Statistics
ملء الشاشة (f)
سؤال
سؤال
سؤال
سؤال
سؤال
سؤال
سؤال
سؤال
سؤال
سؤال
سؤال
سؤال
سؤال
A bookstore recorded the type of books 30 customers purchased during a weekend sale (R = romance novel, S
= science fiction, N = nonfiction, C = children's fiction). Construct a frequency distribution for the data.
= science fiction, N = nonfiction, C = children's fiction). Construct a frequency distribution for the data.
سؤال
The ages of 40 community college students were gathered. Construct a frequency distribution for
the data using five classes.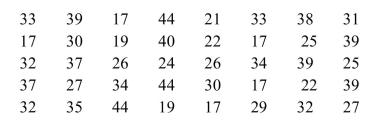
the data using five classes.
سؤال
Twenty-five people responded to a questionnaire about what types of pets they had. Construct a
frequency distribution for the data (D = dogs only, C = cats only, B = both,N = neither).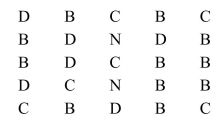
frequency distribution for the data (D = dogs only, C = cats only, B = both,N = neither).
سؤال
سؤال
سؤال
سؤال
سؤال
سؤال
Construct a stem leaf plot for the following data. 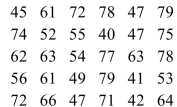
سؤال
Fifty 10-year-olds were monitored to determine the number of hours per week they spent watching
television, surfing the net, and playing video games. The results were used to obtain the frequency
distribution below. Construct a histogram and frequency polygon for the data.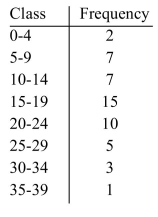
television, surfing the net, and playing video games. The results were used to obtain the frequency
distribution below. Construct a histogram and frequency polygon for the data.
سؤال
To obtain the frequency distribution below, twenty-three babies were monitored for how many times
they cried during the night. Construct a histogram and frequency polygon for the data.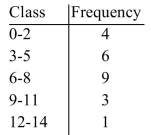
they cried during the night. Construct a histogram and frequency polygon for the data.
سؤال
Construct a bar graph for the number of stray animals in a certain city. 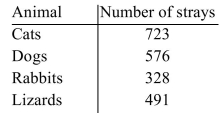
سؤال
The exam grades of 31 students were used to obtain the frequency distribution below. Construct a
histogram for the data.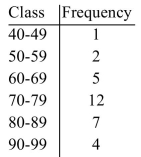
histogram for the data.
سؤال
Fifty people participated in a poll to determine their favorite ice cream flavor. Use the data to
construct a bar graph.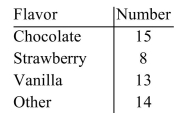
construct a bar graph.
سؤال
Fifty families reported their annual household income (in thousands of dollars). Construct a
frequency distribution for the data using six classes.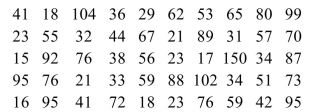
frequency distribution for the data using six classes.
سؤال
A small company did a poll of how their employees commuted to work. Use the data to draw a bar
graph.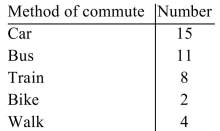
graph.
سؤال
Construct a stem and leaf plot for the following data using whole numbers as stems and the
decimals as leaves.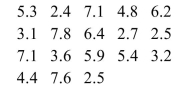
decimals as leaves.
سؤال
Fifty people participated in a poll to determine their favorite ice cream flavor. Use the data to
construct a pie chart.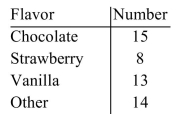
construct a pie chart.
سؤال
Construct a pie chart for the following information. 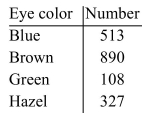
سؤال
The following frequency distribution shows for a certain high school the number of freshmen,
sophomores, juniors, and seniors who smoke. Construct a bar graph for the data.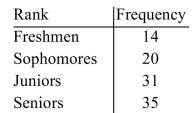
sophomores, juniors, and seniors who smoke. Construct a bar graph for the data.
سؤال
A small company did a poll of how their employees commuted to work. Use the data to draw a pie
chart.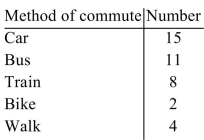
chart.
سؤال
The GPAs of 20 students are given below. Construct a stem and leaf plot for the data using whole
numbers as stems and the decimals as leaves.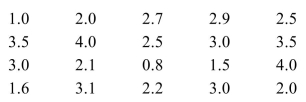
numbers as stems and the decimals as leaves.
سؤال
The following frequency distribution shows for a certain high school the number of freshmen,
sophomores, juniors, and seniors who smoke. Construct a pie chart for the data.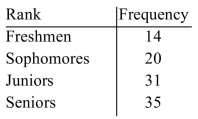
sophomores, juniors, and seniors who smoke. Construct a pie chart for the data.
سؤال
Construct a bar graph for the following information. 
سؤال
Construct a pie chart for the number of stray animals in a certain city. 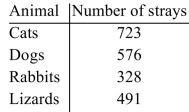
سؤال
The grades on a college math exam are shown below. Construct a stem and leaf plot for the data. 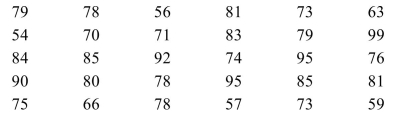
سؤال
The exam grades of 31 students were used to obtain the frequency distribution below. Construct a
frequency polygon for the data.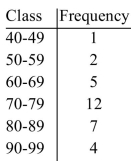
frequency polygon for the data.
سؤال
The frequency distribution below was obtained by monitoring the number of vacation days per year
taken by twenty-five employees. Construct a histogram and frequency polygon for the data.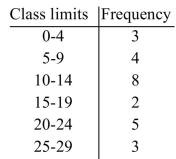
taken by twenty-five employees. Construct a histogram and frequency polygon for the data.
سؤال
Find the median. 
A)38
B)30.5
C)34
D)30
A)38
B)30.5
C)34
D)30
سؤال
Find the midrange. 
سؤال
These data represent the number of stray cats in a small town for the years listed. Draw a time series
graph for the data.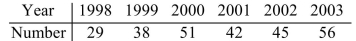
graph for the data.
سؤال
Provided below are the sizes of 15 farms, in acres, randomly selected from the state of Oregon. Find
The midrange of the sample below.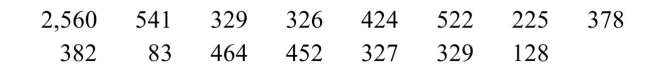
A)1,321.5 acres
B)329 acres
C)378 acres
D)498 acres
The midrange of the sample below.
A)1,321.5 acres
B)329 acres
C)378 acres
D)498 acres
سؤال
These data represent the number of trees in a certain seaside town. Draw a time series graph for the
data.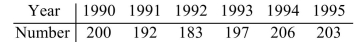
data.
سؤال
The frequency distribution below was obtained by monitoring the number of vacation days per year
taken by twenty-five employees. Construct a frequency polygon for the data.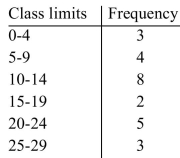
taken by twenty-five employees. Construct a frequency polygon for the data.
سؤال
Find the mean. 
A)12.1
B)2
C)5.5
D)29.5
A)12.1
B)2
C)5.5
D)29.5
سؤال
These data represent the number of gas stations along a certain 50-mile length of desert road. Draw
a time series graph for the data.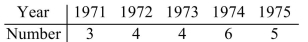
a time series graph for the data.
سؤال
Fifty ten-year-olds were monitored to determine the number of hours per week they spent watching
television, surfing the net, and playing video games. The results were used to obtain the frequency
distribution below. Construct a frequency polygon for the data.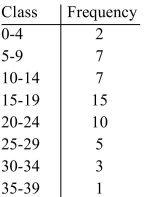
television, surfing the net, and playing video games. The results were used to obtain the frequency
distribution below. Construct a frequency polygon for the data.
سؤال
The exam grades of 31 students were used to obtain the frequency distribution below. Construct a
histogram and frequency polygon for the data.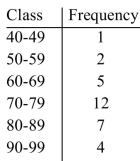
histogram and frequency polygon for the data.
سؤال
Find the median. 
سؤال
Provided below are the sizes of 15 farms, in acres, randomly selected from the state of Oregon. Find
The mean area for these 15 farms.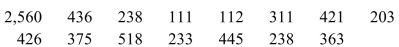
A)238 acres
B)307 acres
C)466 acres
D)363 acres
The mean area for these 15 farms.
A)238 acres
B)307 acres
C)466 acres
D)363 acres
سؤال
The frequency distribution below was obtained by monitoring the number of vacation days per year
taken by twenty-five employees. Construct a histogram for the data.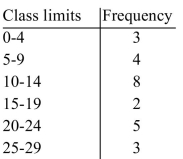
taken by twenty-five employees. Construct a histogram for the data.
سؤال
These data represent the number of stray dogs in a certain city for the years listed. Draw a time
series graph for the data.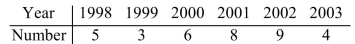
series graph for the data.
سؤال
Fifty ten-year-olds were monitored to determine the number of hours per week they spent watching
television, surfing the net, and playing video games. The results were used to obtain the frequency
distribution below. Construct a histogram for the data.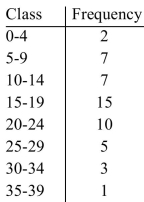
television, surfing the net, and playing video games. The results were used to obtain the frequency
distribution below. Construct a histogram for the data.
سؤال
To obtain the frequency distribution below, twenty-three babies were monitored for how many times
they cried during the night. Construct a histogram for the data.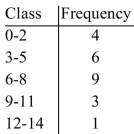
they cried during the night. Construct a histogram for the data.
سؤال
These data represent the number of students attending a high school. Draw a time series graph for
the data.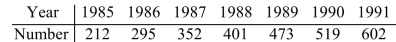
the data.
سؤال
These data represent the number of students enrolled at a community college. Draw a time series
graph for the data.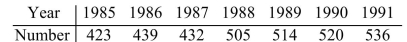
graph for the data.
سؤال
Find the mean. 
سؤال
To obtain the frequency distribution below, twenty-three babies were monitored for how many times
they cried during the night. Construct a frequency polygon for the data.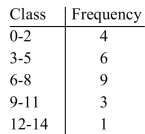
they cried during the night. Construct a frequency polygon for the data.
سؤال
سؤال
Find the mode. 
سؤال
Find the range, variance, and standard deviation for the given data. The table below shows the
Average points scored per game by several intramural softball teams. Round to one decimal place.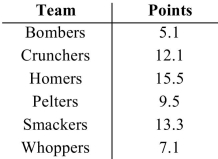
A)range: 10.4, variance: 15.4, standard deviation: 3.9
B)range: 10.3, variance: 12.8, standard deviation: 3.6
C)range: 10.3, variance: 15.4, standard deviation: 3.9
D)range: 10.4, variance: 12.8, standard deviation: 3.6
سؤال
سؤال
Find the range. 
سؤال
سؤال
Find the mode. 
A)7
B)8
C)10.5
D)No mode
A)7
B)8
C)10.5
D)No mode
سؤال
سؤال
Forty new automobiles were tested for fuel efficiency by the Environmental Protection Agency (in
miles per gallon). The individual values and a frequency distribution are displayed below.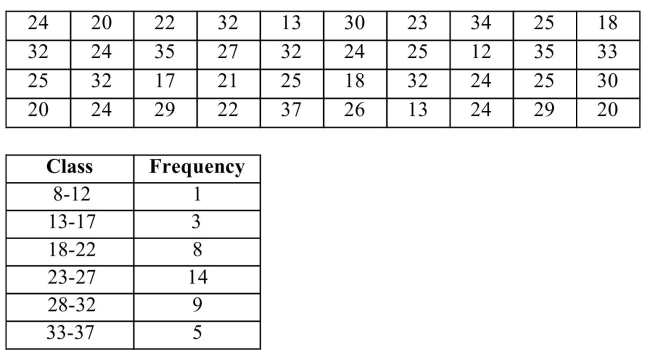 Find the median, mode, and midrange of the data set.
miles per gallon). The individual values and a frequency distribution are displayed below.
Find the median, mode, and midrange of the data set. سؤال
Find the mode. 
A)5.6
B)5
C)No mode
D)8
A)5.6
B)5
C)No mode
D)8
سؤال
Find the variance. 
A)391.6
B)84.4
C)9.19
D)70.33
A)391.6
B)84.4
C)9.19
D)70.33
سؤال
The table below lists the average high temperature in degrees Fahrenheit for each month of the year
On a particular island. Find the mode and the median.
A)Modes: 82° and 88°; median: 84.6°
B)Mode: 88°; median: 84.6°
C)Modes: 82° and 88°; median: 84.5°
D)Mode: 88°; median: 84.5°
On a particular island. Find the mode and the median.
A)Modes: 82° and 88°; median: 84.6°
B)Mode: 88°; median: 84.6°
C)Modes: 82° and 88°; median: 84.5°
D)Mode: 88°; median: 84.5°
سؤال
These data represent the grades on a college exam. Find the mean 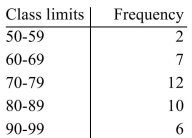
سؤال
The table below shows the number of arrests in thousands, for the years from 2005 to 2014 in a
Particular country. Find the mean and sample standard deviation for the number of arrests. Include
Units.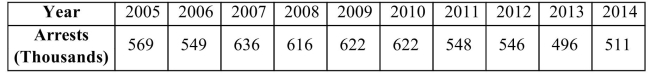
A)mean: 559,000 arrests; standard deviation: 51,509 arrests
B)mean: 571,500 arrests; standard deviation: 49,796 arrests
C)mean: 571,500 arrests; standard deviation: 47,240 arrests
D)mean: 559,000 arrests; standard deviation: 48,866 arrests
سؤال
Forty new automobiles were tested for fuel efficiency by the Environmental Protection Agency (in
Miles per gallon). The individual values and a frequency distribution are displayed below.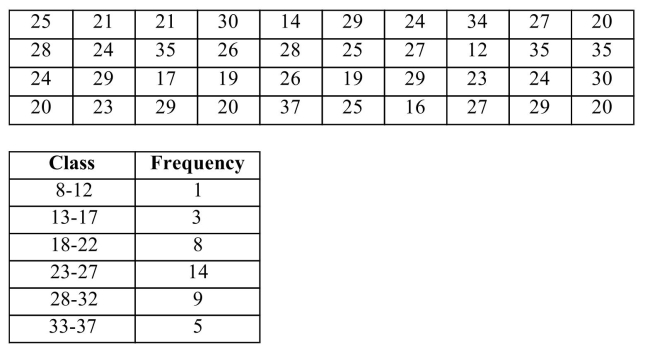 Use the frequency distribution to approximate the mean.
A)25.15
B)25
C)14
D)25.25
Miles per gallon). The individual values and a frequency distribution are displayed below.
Use the frequency distribution to approximate the mean.A)25.15
B)25
C)14
D)25.25
سؤال
Five hundred college graduates were asked how much they donate to their alma mater on an annual
Basis. Find the mode of their responses, summarized in the table.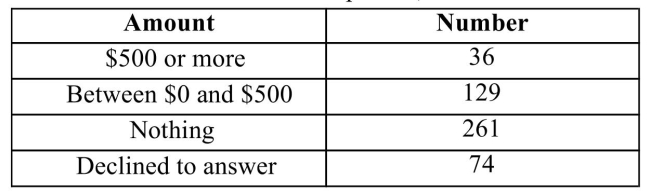
A)125
B)195
C)The mode does not exist
D)Nothing
Basis. Find the mode of their responses, summarized in the table.
A)125
B)195
C)The mode does not exist
D)Nothing
سؤال
Find the variance and standard deviation. 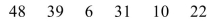
سؤال
Provided below are the sizes of 15 farms, in acres, randomly selected from the state of Oregon. The
mean of this sample is 512 acres.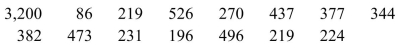 a. Find the median of the sample and compare it to the mean and discuss the difference.
b. Find the mean and the median if you throw out the 3,200 acre farm which has the largest area by
far. What does this tell you?
mean of this sample is 512 acres.
a. Find the median of the sample and compare it to the mean and discuss the difference.b. Find the mean and the median if you throw out the 3,200 acre farm which has the largest area by
far. What does this tell you?
سؤال
Find the standard deviation. 
A)12.90
B)138.67
C)166.4
D)11.78
A)12.90
B)138.67
C)166.4
D)11.78
سؤال
Find the mean, median, mode, and midrange for the data provided. The data shows hours spent at
Work for a group of men.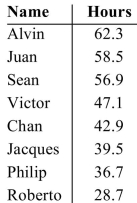
A)mean: 45, median: 46.575, mode: 45.5, midrange: 33.6
B)mean: 46.575, median: 45, mode: no mode, midrange: 45.5
C)mean: 45, median: 46.575, mode: 45, midrange: 33.6
D)mean: 46.575, median: 45.5, mode: no mode, midrange: 45.5
Work for a group of men.
A)mean: 45, median: 46.575, mode: 45.5, midrange: 33.6
B)mean: 46.575, median: 45, mode: no mode, midrange: 45.5
C)mean: 45, median: 46.575, mode: 45, midrange: 33.6
D)mean: 46.575, median: 45.5, mode: no mode, midrange: 45.5

فتح الحزمة
قم بالتسجيل لفتح البطاقات في هذه المجموعة!
Unlock Deck
Unlock Deck
1/174
العب
ملء الشاشة (f)
Deck 11: Statistics
1
Last year's total attendance at Long Run High School's football games was 8,325. Decide whether
Descriptive or inferential statistics is being used.
A)Inferential statistics
B)Descriptive statistics
Descriptive or inferential statistics is being used.
A)Inferential statistics
B)Descriptive statistics
B
2
The average number of students in a class at White Oak University is 22.6. Decide whether
Descriptive or inferential statistics is being used.
A)Descriptive statistics
B)Inferential statistics
Descriptive or inferential statistics is being used.
A)Descriptive statistics
B)Inferential statistics
A
3
When a population is divided into groups where the members of each group have similar
characteristics and a certain number of members from each group are chosen at random, the result is
called a sample.
characteristics and a certain number of members from each group are chosen at random, the result is
called a sample.
stratified
4
A researcher is studying possible grade inflation at colleges. The sample is .
فتح الحزمة
افتح القفل للوصول البطاقات البالغ عددها 174 في هذه المجموعة.
فتح الحزمة
k this deck
5
A population consists of .
فتح الحزمة
افتح القفل للوصول البطاقات البالغ عددها 174 في هذه المجموعة.
فتح الحزمة
k this deck
6
In order to obtain a sample, every subject of the population has to have an equal chance of
being selected.
being selected.
فتح الحزمة
افتح القفل للوصول البطاقات البالغ عددها 174 في هذه المجموعة.
فتح الحزمة
k this deck
7
When an existing group of subjects that represent the population is used for a sample, it is called a
sample.
sample.
فتح الحزمة
افتح القفل للوصول البطاقات البالغ عددها 174 في هذه المجموعة.
فتح الحزمة
k this deck
8
A researcher is studying possible grade inflation at colleges. The population is .
فتح الحزمة
افتح القفل للوصول البطاقات البالغ عددها 174 في هذه المجموعة.
فتح الحزمة
k this deck
9
A researcher randomly selected three states and then gathered information from all colleges willing
To release grade information in those states. Identify the sampling method used.
A)Cluster
B)Stratified
C)Random
D)Systematic
To release grade information in those states. Identify the sampling method used.
A)Cluster
B)Stratified
C)Random
D)Systematic
فتح الحزمة
افتح القفل للوصول البطاقات البالغ عددها 174 في هذه المجموعة.
فتح الحزمة
k this deck
10
A sample is taken by numbering each member of the population and then selecting every kth
member, where k is some natural number.
member, where k is some natural number.
فتح الحزمة
افتح القفل للوصول البطاقات البالغ عددها 174 في هذه المجموعة.
فتح الحزمة
k this deck
11
A researcher grouped the schools by two-year state schools, four-year state schools, two-year private
Schools, and four-year private schools. The researcher then decided to choose five schools from each
Of those groups. Identify the sampling method used.
A)Stratified
B)Systematic
C)Random
D)Cluster
Schools, and four-year private schools. The researcher then decided to choose five schools from each
Of those groups. Identify the sampling method used.
A)Stratified
B)Systematic
C)Random
D)Cluster
فتح الحزمة
افتح القفل للوصول البطاقات البالغ عددها 174 في هذه المجموعة.
فتح الحزمة
k this deck
12
The chance that a person will be robbed in a certain city is 15%. Decide whether descriptive or
Inferential statistics is being used.
A)Descriptive statistics
B)Inferential statistics
Inferential statistics is being used.
A)Descriptive statistics
B)Inferential statistics
فتح الحزمة
افتح القفل للوصول البطاقات البالغ عددها 174 في هذه المجموعة.
فتح الحزمة
k this deck
13
A bookstore recorded the type of books 30 customers purchased during a weekend sale (R = romance novel, S
= science fiction, N = nonfiction, C = children's fiction). Construct a frequency distribution for the data.
= science fiction, N = nonfiction, C = children's fiction). Construct a frequency distribution for the data.
فتح الحزمة
افتح القفل للوصول البطاقات البالغ عددها 174 في هذه المجموعة.
فتح الحزمة
k this deck
14
The ages of 40 community college students were gathered. Construct a frequency distribution for
the data using five classes.
the data using five classes.
فتح الحزمة
افتح القفل للوصول البطاقات البالغ عددها 174 في هذه المجموعة.
فتح الحزمة
k this deck
15
Twenty-five people responded to a questionnaire about what types of pets they had. Construct a
frequency distribution for the data (D = dogs only, C = cats only, B = both,N = neither).
frequency distribution for the data (D = dogs only, C = cats only, B = both,N = neither).
فتح الحزمة
افتح القفل للوصول البطاقات البالغ عددها 174 في هذه المجموعة.
فتح الحزمة
k this deck
16
A sample is a .
فتح الحزمة
افتح القفل للوصول البطاقات البالغ عددها 174 في هذه المجموعة.
فتح الحزمة
k this deck
17
A recent study showed that eating garlic can lower blood pressure. Decide whether descriptive or
Inferential statistics is being used.
A)Inferential statistics
B)Descriptive statistics
Inferential statistics is being used.
A)Inferential statistics
B)Descriptive statistics
فتح الحزمة
افتح القفل للوصول البطاقات البالغ عددها 174 في هذه المجموعة.
فتح الحزمة
k this deck
18
To study the number of credit hours taken by a typical student, Shawna asks the registrar to provide
E-mail addresses for 10 freshmen, 10 sophomores, 10 juniors, and 10 seniors. From each group, she
Asks for one whose student ID ends in 0, one whose ends in 1, and so forth. a. What method of
Sampling did she use?
A)Stratified
B)Systematic
C)Cluster
D)Random
E-mail addresses for 10 freshmen, 10 sophomores, 10 juniors, and 10 seniors. From each group, she
Asks for one whose student ID ends in 0, one whose ends in 1, and so forth. a. What method of
Sampling did she use?
A)Stratified
B)Systematic
C)Cluster
D)Random
فتح الحزمة
افتح القفل للوصول البطاقات البالغ عددها 174 في هذه المجموعة.
فتح الحزمة
k this deck
19
A researcher numbered all of the colleges willing to release grade information and chose several of
Them using a random number generator. Identify the sampling method used.
A)Stratified
B)Systematic
C)Cluster
D)Random
Them using a random number generator. Identify the sampling method used.
A)Stratified
B)Systematic
C)Cluster
D)Random
فتح الحزمة
افتح القفل للوصول البطاقات البالغ عددها 174 في هذه المجموعة.
فتح الحزمة
k this deck
20
A researcher numbered all of the colleges willing to release grade information and chose every tenth
One. Identify the sampling method used.
A)Random
B)Systematic
C)Stratified
D)Cluster
One. Identify the sampling method used.
A)Random
B)Systematic
C)Stratified
D)Cluster
فتح الحزمة
افتح القفل للوصول البطاقات البالغ عددها 174 في هذه المجموعة.
فتح الحزمة
k this deck
21
Construct a stem leaf plot for the following data.
فتح الحزمة
افتح القفل للوصول البطاقات البالغ عددها 174 في هذه المجموعة.
فتح الحزمة
k this deck
22
Fifty 10-year-olds were monitored to determine the number of hours per week they spent watching
television, surfing the net, and playing video games. The results were used to obtain the frequency
distribution below. Construct a histogram and frequency polygon for the data.
television, surfing the net, and playing video games. The results were used to obtain the frequency
distribution below. Construct a histogram and frequency polygon for the data.
فتح الحزمة
افتح القفل للوصول البطاقات البالغ عددها 174 في هذه المجموعة.
فتح الحزمة
k this deck
23
To obtain the frequency distribution below, twenty-three babies were monitored for how many times
they cried during the night. Construct a histogram and frequency polygon for the data.
they cried during the night. Construct a histogram and frequency polygon for the data.
فتح الحزمة
افتح القفل للوصول البطاقات البالغ عددها 174 في هذه المجموعة.
فتح الحزمة
k this deck
24
Construct a bar graph for the number of stray animals in a certain city.
فتح الحزمة
افتح القفل للوصول البطاقات البالغ عددها 174 في هذه المجموعة.
فتح الحزمة
k this deck
25
The exam grades of 31 students were used to obtain the frequency distribution below. Construct a
histogram for the data.
histogram for the data.
فتح الحزمة
افتح القفل للوصول البطاقات البالغ عددها 174 في هذه المجموعة.
فتح الحزمة
k this deck
26
Fifty people participated in a poll to determine their favorite ice cream flavor. Use the data to
construct a bar graph.
construct a bar graph.
فتح الحزمة
افتح القفل للوصول البطاقات البالغ عددها 174 في هذه المجموعة.
فتح الحزمة
k this deck
27
Fifty families reported their annual household income (in thousands of dollars). Construct a
frequency distribution for the data using six classes.
frequency distribution for the data using six classes.
فتح الحزمة
افتح القفل للوصول البطاقات البالغ عددها 174 في هذه المجموعة.
فتح الحزمة
k this deck
28
A small company did a poll of how their employees commuted to work. Use the data to draw a bar
graph.
graph.
فتح الحزمة
افتح القفل للوصول البطاقات البالغ عددها 174 في هذه المجموعة.
فتح الحزمة
k this deck
29
Construct a stem and leaf plot for the following data using whole numbers as stems and the
decimals as leaves.
decimals as leaves.
فتح الحزمة
افتح القفل للوصول البطاقات البالغ عددها 174 في هذه المجموعة.
فتح الحزمة
k this deck
30
Fifty people participated in a poll to determine their favorite ice cream flavor. Use the data to
construct a pie chart.
construct a pie chart.
فتح الحزمة
افتح القفل للوصول البطاقات البالغ عددها 174 في هذه المجموعة.
فتح الحزمة
k this deck
31
Construct a pie chart for the following information.
فتح الحزمة
افتح القفل للوصول البطاقات البالغ عددها 174 في هذه المجموعة.
فتح الحزمة
k this deck
32
The following frequency distribution shows for a certain high school the number of freshmen,
sophomores, juniors, and seniors who smoke. Construct a bar graph for the data.
sophomores, juniors, and seniors who smoke. Construct a bar graph for the data.
فتح الحزمة
افتح القفل للوصول البطاقات البالغ عددها 174 في هذه المجموعة.
فتح الحزمة
k this deck
33
A small company did a poll of how their employees commuted to work. Use the data to draw a pie
chart.
chart.
فتح الحزمة
افتح القفل للوصول البطاقات البالغ عددها 174 في هذه المجموعة.
فتح الحزمة
k this deck
34
The GPAs of 20 students are given below. Construct a stem and leaf plot for the data using whole
numbers as stems and the decimals as leaves.
numbers as stems and the decimals as leaves.
فتح الحزمة
افتح القفل للوصول البطاقات البالغ عددها 174 في هذه المجموعة.
فتح الحزمة
k this deck
35
The following frequency distribution shows for a certain high school the number of freshmen,
sophomores, juniors, and seniors who smoke. Construct a pie chart for the data.
sophomores, juniors, and seniors who smoke. Construct a pie chart for the data.
فتح الحزمة
افتح القفل للوصول البطاقات البالغ عددها 174 في هذه المجموعة.
فتح الحزمة
k this deck
36
Construct a bar graph for the following information.
فتح الحزمة
افتح القفل للوصول البطاقات البالغ عددها 174 في هذه المجموعة.
فتح الحزمة
k this deck
37
Construct a pie chart for the number of stray animals in a certain city.
فتح الحزمة
افتح القفل للوصول البطاقات البالغ عددها 174 في هذه المجموعة.
فتح الحزمة
k this deck
38
The grades on a college math exam are shown below. Construct a stem and leaf plot for the data.
فتح الحزمة
افتح القفل للوصول البطاقات البالغ عددها 174 في هذه المجموعة.
فتح الحزمة
k this deck
39
The exam grades of 31 students were used to obtain the frequency distribution below. Construct a
frequency polygon for the data.
frequency polygon for the data.
فتح الحزمة
افتح القفل للوصول البطاقات البالغ عددها 174 في هذه المجموعة.
فتح الحزمة
k this deck
40
The frequency distribution below was obtained by monitoring the number of vacation days per year
taken by twenty-five employees. Construct a histogram and frequency polygon for the data.
taken by twenty-five employees. Construct a histogram and frequency polygon for the data.
فتح الحزمة
افتح القفل للوصول البطاقات البالغ عددها 174 في هذه المجموعة.
فتح الحزمة
k this deck
41
Find the median.
A)38
B)30.5
C)34
D)30
A)38
B)30.5
C)34
D)30
فتح الحزمة
افتح القفل للوصول البطاقات البالغ عددها 174 في هذه المجموعة.
فتح الحزمة
k this deck
42
Find the midrange.
فتح الحزمة
افتح القفل للوصول البطاقات البالغ عددها 174 في هذه المجموعة.
فتح الحزمة
k this deck
43
These data represent the number of stray cats in a small town for the years listed. Draw a time series
graph for the data.
graph for the data.
فتح الحزمة
افتح القفل للوصول البطاقات البالغ عددها 174 في هذه المجموعة.
فتح الحزمة
k this deck
44
Provided below are the sizes of 15 farms, in acres, randomly selected from the state of Oregon. Find
The midrange of the sample below.
A)1,321.5 acres
B)329 acres
C)378 acres
D)498 acres
The midrange of the sample below.
A)1,321.5 acres
B)329 acres
C)378 acres
D)498 acres
فتح الحزمة
افتح القفل للوصول البطاقات البالغ عددها 174 في هذه المجموعة.
فتح الحزمة
k this deck
45
These data represent the number of trees in a certain seaside town. Draw a time series graph for the
data.
data.
فتح الحزمة
افتح القفل للوصول البطاقات البالغ عددها 174 في هذه المجموعة.
فتح الحزمة
k this deck
46
The frequency distribution below was obtained by monitoring the number of vacation days per year
taken by twenty-five employees. Construct a frequency polygon for the data.
taken by twenty-five employees. Construct a frequency polygon for the data.
فتح الحزمة
افتح القفل للوصول البطاقات البالغ عددها 174 في هذه المجموعة.
فتح الحزمة
k this deck
47
Find the mean.
A)12.1
B)2
C)5.5
D)29.5
A)12.1
B)2
C)5.5
D)29.5
فتح الحزمة
افتح القفل للوصول البطاقات البالغ عددها 174 في هذه المجموعة.
فتح الحزمة
k this deck
48
These data represent the number of gas stations along a certain 50-mile length of desert road. Draw
a time series graph for the data.
a time series graph for the data.
فتح الحزمة
افتح القفل للوصول البطاقات البالغ عددها 174 في هذه المجموعة.
فتح الحزمة
k this deck
49
Fifty ten-year-olds were monitored to determine the number of hours per week they spent watching
television, surfing the net, and playing video games. The results were used to obtain the frequency
distribution below. Construct a frequency polygon for the data.
television, surfing the net, and playing video games. The results were used to obtain the frequency
distribution below. Construct a frequency polygon for the data.
فتح الحزمة
افتح القفل للوصول البطاقات البالغ عددها 174 في هذه المجموعة.
فتح الحزمة
k this deck
50
The exam grades of 31 students were used to obtain the frequency distribution below. Construct a
histogram and frequency polygon for the data.
histogram and frequency polygon for the data.
فتح الحزمة
افتح القفل للوصول البطاقات البالغ عددها 174 في هذه المجموعة.
فتح الحزمة
k this deck
51
Find the median.
فتح الحزمة
افتح القفل للوصول البطاقات البالغ عددها 174 في هذه المجموعة.
فتح الحزمة
k this deck
52
Provided below are the sizes of 15 farms, in acres, randomly selected from the state of Oregon. Find
The mean area for these 15 farms.
A)238 acres
B)307 acres
C)466 acres
D)363 acres
The mean area for these 15 farms.
A)238 acres
B)307 acres
C)466 acres
D)363 acres
فتح الحزمة
افتح القفل للوصول البطاقات البالغ عددها 174 في هذه المجموعة.
فتح الحزمة
k this deck
53
The frequency distribution below was obtained by monitoring the number of vacation days per year
taken by twenty-five employees. Construct a histogram for the data.
taken by twenty-five employees. Construct a histogram for the data.
فتح الحزمة
افتح القفل للوصول البطاقات البالغ عددها 174 في هذه المجموعة.
فتح الحزمة
k this deck
54
These data represent the number of stray dogs in a certain city for the years listed. Draw a time
series graph for the data.
series graph for the data.
فتح الحزمة
افتح القفل للوصول البطاقات البالغ عددها 174 في هذه المجموعة.
فتح الحزمة
k this deck
55
Fifty ten-year-olds were monitored to determine the number of hours per week they spent watching
television, surfing the net, and playing video games. The results were used to obtain the frequency
distribution below. Construct a histogram for the data.
television, surfing the net, and playing video games. The results were used to obtain the frequency
distribution below. Construct a histogram for the data.
فتح الحزمة
افتح القفل للوصول البطاقات البالغ عددها 174 في هذه المجموعة.
فتح الحزمة
k this deck
56
To obtain the frequency distribution below, twenty-three babies were monitored for how many times
they cried during the night. Construct a histogram for the data.
they cried during the night. Construct a histogram for the data.
فتح الحزمة
افتح القفل للوصول البطاقات البالغ عددها 174 في هذه المجموعة.
فتح الحزمة
k this deck
57
These data represent the number of students attending a high school. Draw a time series graph for
the data.
the data.
فتح الحزمة
افتح القفل للوصول البطاقات البالغ عددها 174 في هذه المجموعة.
فتح الحزمة
k this deck
58
These data represent the number of students enrolled at a community college. Draw a time series
graph for the data.
graph for the data.
فتح الحزمة
افتح القفل للوصول البطاقات البالغ عددها 174 في هذه المجموعة.
فتح الحزمة
k this deck
59
Find the mean.
فتح الحزمة
افتح القفل للوصول البطاقات البالغ عددها 174 في هذه المجموعة.
فتح الحزمة
k this deck
60
To obtain the frequency distribution below, twenty-three babies were monitored for how many times
they cried during the night. Construct a frequency polygon for the data.
they cried during the night. Construct a frequency polygon for the data.
فتح الحزمة
افتح القفل للوصول البطاقات البالغ عددها 174 في هذه المجموعة.
فتح الحزمة
k this deck
61
The mean, also known as the arithmetic average, is found by .
فتح الحزمة
افتح القفل للوصول البطاقات البالغ عددها 174 في هذه المجموعة.
فتح الحزمة
k this deck
62
Find the mode.
فتح الحزمة
افتح القفل للوصول البطاقات البالغ عددها 174 في هذه المجموعة.
فتح الحزمة
k this deck
63
Find the range, variance, and standard deviation for the given data. The table below shows the
Average points scored per game by several intramural softball teams. Round to one decimal place.
A)range: 10.4, variance: 15.4, standard deviation: 3.9
B)range: 10.3, variance: 12.8, standard deviation: 3.6
C)range: 10.3, variance: 15.4, standard deviation: 3.9
D)range: 10.4, variance: 12.8, standard deviation: 3.6
Average points scored per game by several intramural softball teams. Round to one decimal place.
A)range: 10.4, variance: 15.4, standard deviation: 3.9
B)range: 10.3, variance: 12.8, standard deviation: 3.6
C)range: 10.3, variance: 15.4, standard deviation: 3.9
D)range: 10.4, variance: 12.8, standard deviation: 3.6
فتح الحزمة
افتح القفل للوصول البطاقات البالغ عددها 174 في هذه المجموعة.
فتح الحزمة
k this deck
64
The is the value that occurs most often in a data set.
فتح الحزمة
افتح القفل للوصول البطاقات البالغ عددها 174 في هذه المجموعة.
فتح الحزمة
k this deck
65
Find the range.
فتح الحزمة
افتح القفل للوصول البطاقات البالغ عددها 174 في هذه المجموعة.
فتح الحزمة
k this deck
66
To find the arrange the data in order from smallest to largest. If the number of data values is
odd, it will be one value in the middle of the ordered list. If the number of data values is even, it will
be the mean of two middle values.
odd, it will be one value in the middle of the ordered list. If the number of data values is even, it will
be the mean of two middle values.
فتح الحزمة
افتح القفل للوصول البطاقات البالغ عددها 174 في هذه المجموعة.
فتح الحزمة
k this deck
67
Find the mode.
A)7
B)8
C)10.5
D)No mode
A)7
B)8
C)10.5
D)No mode
فتح الحزمة
افتح القفل للوصول البطاقات البالغ عددها 174 في هذه المجموعة.
فتح الحزمة
k this deck
68
The is the mean of the smallest and largest values in a data set.
فتح الحزمة
افتح القفل للوصول البطاقات البالغ عددها 174 في هذه المجموعة.
فتح الحزمة
k this deck
69
Forty new automobiles were tested for fuel efficiency by the Environmental Protection Agency (in
miles per gallon). The individual values and a frequency distribution are displayed below. Find the median, mode, and midrange of the data set.
miles per gallon). The individual values and a frequency distribution are displayed below.
Find the median, mode, and midrange of the data set. فتح الحزمة
افتح القفل للوصول البطاقات البالغ عددها 174 في هذه المجموعة.
فتح الحزمة
k this deck
70
Find the mode.
A)5.6
B)5
C)No mode
D)8
A)5.6
B)5
C)No mode
D)8
فتح الحزمة
افتح القفل للوصول البطاقات البالغ عددها 174 في هذه المجموعة.
فتح الحزمة
k this deck
71
Find the variance.
A)391.6
B)84.4
C)9.19
D)70.33
A)391.6
B)84.4
C)9.19
D)70.33
فتح الحزمة
افتح القفل للوصول البطاقات البالغ عددها 174 في هذه المجموعة.
فتح الحزمة
k this deck
72
The table below lists the average high temperature in degrees Fahrenheit for each month of the year
On a particular island. Find the mode and the median.
A)Modes: 82° and 88°; median: 84.6°
B)Mode: 88°; median: 84.6°
C)Modes: 82° and 88°; median: 84.5°
D)Mode: 88°; median: 84.5°
On a particular island. Find the mode and the median.
A)Modes: 82° and 88°; median: 84.6°
B)Mode: 88°; median: 84.6°
C)Modes: 82° and 88°; median: 84.5°
D)Mode: 88°; median: 84.5°
فتح الحزمة
افتح القفل للوصول البطاقات البالغ عددها 174 في هذه المجموعة.
فتح الحزمة
k this deck
73
These data represent the grades on a college exam. Find the mean
فتح الحزمة
افتح القفل للوصول البطاقات البالغ عددها 174 في هذه المجموعة.
فتح الحزمة
k this deck
74
The table below shows the number of arrests in thousands, for the years from 2005 to 2014 in a
Particular country. Find the mean and sample standard deviation for the number of arrests. Include
Units.
A)mean: 559,000 arrests; standard deviation: 51,509 arrests
B)mean: 571,500 arrests; standard deviation: 49,796 arrests
C)mean: 571,500 arrests; standard deviation: 47,240 arrests
D)mean: 559,000 arrests; standard deviation: 48,866 arrests
Particular country. Find the mean and sample standard deviation for the number of arrests. Include
Units.
A)mean: 559,000 arrests; standard deviation: 51,509 arrests
B)mean: 571,500 arrests; standard deviation: 49,796 arrests
C)mean: 571,500 arrests; standard deviation: 47,240 arrests
D)mean: 559,000 arrests; standard deviation: 48,866 arrests
فتح الحزمة
افتح القفل للوصول البطاقات البالغ عددها 174 في هذه المجموعة.
فتح الحزمة
k this deck
75
Forty new automobiles were tested for fuel efficiency by the Environmental Protection Agency (in
Miles per gallon). The individual values and a frequency distribution are displayed below. Use the frequency distribution to approximate the mean.
A)25.15
B)25
C)14
D)25.25
Miles per gallon). The individual values and a frequency distribution are displayed below.
Use the frequency distribution to approximate the mean.A)25.15
B)25
C)14
D)25.25
فتح الحزمة
افتح القفل للوصول البطاقات البالغ عددها 174 في هذه المجموعة.
فتح الحزمة
k this deck
76
Five hundred college graduates were asked how much they donate to their alma mater on an annual
Basis. Find the mode of their responses, summarized in the table.
A)125
B)195
C)The mode does not exist
D)Nothing
Basis. Find the mode of their responses, summarized in the table.
A)125
B)195
C)The mode does not exist
D)Nothing
فتح الحزمة
افتح القفل للوصول البطاقات البالغ عددها 174 في هذه المجموعة.
فتح الحزمة
k this deck
77
Find the variance and standard deviation.
فتح الحزمة
افتح القفل للوصول البطاقات البالغ عددها 174 في هذه المجموعة.
فتح الحزمة
k this deck
78
Provided below are the sizes of 15 farms, in acres, randomly selected from the state of Oregon. The
mean of this sample is 512 acres. a. Find the median of the sample and compare it to the mean and discuss the difference.
b. Find the mean and the median if you throw out the 3,200 acre farm which has the largest area by
far. What does this tell you?
mean of this sample is 512 acres.
a. Find the median of the sample and compare it to the mean and discuss the difference.b. Find the mean and the median if you throw out the 3,200 acre farm which has the largest area by
far. What does this tell you?
فتح الحزمة
افتح القفل للوصول البطاقات البالغ عددها 174 في هذه المجموعة.
فتح الحزمة
k this deck
79
Find the standard deviation.
A)12.90
B)138.67
C)166.4
D)11.78
A)12.90
B)138.67
C)166.4
D)11.78
فتح الحزمة
افتح القفل للوصول البطاقات البالغ عددها 174 في هذه المجموعة.
فتح الحزمة
k this deck
80
Find the mean, median, mode, and midrange for the data provided. The data shows hours spent at
Work for a group of men.
A)mean: 45, median: 46.575, mode: 45.5, midrange: 33.6
B)mean: 46.575, median: 45, mode: no mode, midrange: 45.5
C)mean: 45, median: 46.575, mode: 45, midrange: 33.6
D)mean: 46.575, median: 45.5, mode: no mode, midrange: 45.5
Work for a group of men.
A)mean: 45, median: 46.575, mode: 45.5, midrange: 33.6
B)mean: 46.575, median: 45, mode: no mode, midrange: 45.5
C)mean: 45, median: 46.575, mode: 45, midrange: 33.6
D)mean: 46.575, median: 45.5, mode: no mode, midrange: 45.5
فتح الحزمة
افتح القفل للوصول البطاقات البالغ عددها 174 في هذه المجموعة.
فتح الحزمة
k this deck
فتح الحزمة
افتح القفل للوصول البطاقات البالغ عددها 174 في هذه المجموعة.


