Deck 19: Statistical Applications in Quality Management Online
ملء الشاشة (f)
سؤال
سؤال
سؤال
SCENARIO 19-1 A local newspaper has 10 delivery boys who each deliver the morning paper to 50 customers every day.The owner decides to record the number of papers delivered on time for a 10-day period for one of the delivery boys and construct a p chart to see whether the percentage is too erratic. 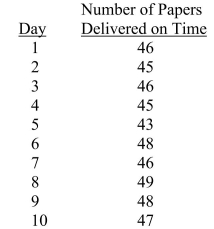
Referring to Scenario 19-1, what is the numerical value of the upper control limit for the p chart?
A)0.926
B)0.961
C)0.979
D)1.037
Referring to Scenario 19-1, what is the numerical value of the upper control limit for the p chart?
A)0.926
B)0.961
C)0.979
D)1.037
سؤال
SCENARIO 19-1 A local newspaper has 10 delivery boys who each deliver the morning paper to 50 customers every day.The owner decides to record the number of papers delivered on time for a 10-day period for one of the delivery boys and construct a p chart to see whether the percentage is too erratic.
Referring to Scenario 19-1, what is the numerical value of the lower control limit for the p chart?
A)0.920
B)0.911
C)0.815
D)0.798
Referring to Scenario 19-1, what is the numerical value of the lower control limit for the p chart?
A)0.920
B)0.911
C)0.815
D)0.798
سؤال
SCENARIO 19-3 A quality control analyst for a light bulb manufacturer is concerned that the time it takes to produce a batch of light bulbs is too erratic.Accordingly, the analyst randomly surveys 10 production periods each day for 14 days and records the sample mean and range for each day. 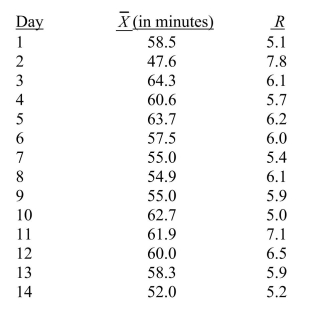
Referring to Scenario 19-3, suppose the analyst constructs an R chart to see if the variability in production times is in-control.What is the center line of this R chart?
A)4.8
B)6.0
C)6.9
D)7.1
Referring to Scenario 19-3, suppose the analyst constructs an R chart to see if the variability in production times is in-control.What is the center line of this R chart?
A)4.8
B)6.0
C)6.9
D)7.1
سؤال
سؤال
سؤال
SCENARIO 19-2 A political pollster randomly selects a sample of 100 voters each day for 8 successive days and asks how many will vote for the incumbent.The pollster wishes to construct a p chart to see if the percentage favoring the incumbent candidate is too erratic. 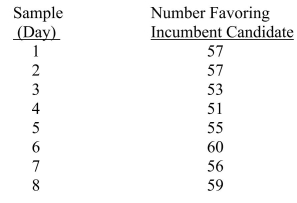
Referring to Scenario 19-2, what is the numerical value of the lower control limit for the p chart?
A)0.37
B)0.41
C)0.50
D)0.71
Referring to Scenario 19-2, what is the numerical value of the lower control limit for the p chart?
A)0.37
B)0.41
C)0.50
D)0.71
سؤال
SCENARIO 19-1 A local newspaper has 10 delivery boys who each deliver the morning paper to 50 customers every day.The owner decides to record the number of papers delivered on time for a 10-day period for one of the delivery boys and construct a p chart to see whether the percentage is too erratic.
Referring to Scenario 19-1, which expression best characterizes the p chart?
A)Cycles
B)Increasing trend
C)In-control
D)Individual outliers
Referring to Scenario 19-1, which expression best characterizes the p chart?
A)Cycles
B)Increasing trend
C)In-control
D)Individual outliers
سؤال
سؤال
SCENARIO 19-1 A local newspaper has 10 delivery boys who each deliver the morning paper to 50 customers every day.The owner decides to record the number of papers delivered on time for a 10-day period for one of the delivery boys and construct a p chart to see whether the percentage is too erratic.
Referring to Scenario 19-1, what is the numerical value of the center line for the p chart?
A)0.926
B)0.911
C)0.885
D)0.500
Referring to Scenario 19-1, what is the numerical value of the center line for the p chart?
A)0.926
B)0.911
C)0.885
D)0.500
سؤال
سؤال
سؤال
سؤال
SCENARIO 19-2 A political pollster randomly selects a sample of 100 voters each day for 8 successive days and asks how many will vote for the incumbent.The pollster wishes to construct a p chart to see if the percentage favoring the incumbent candidate is too erratic.
Referring to Scenario 19-2, which expression best characterizes the p chart?
A)In-control
B)Increasing trend
C)Decreasing trend
D)Individual outliers
Referring to Scenario 19-2, which expression best characterizes the p chart?
A)In-control
B)Increasing trend
C)Decreasing trend
D)Individual outliers
سؤال
SCENARIO 19-3 A quality control analyst for a light bulb manufacturer is concerned that the time it takes to produce a batch of light bulbs is too erratic.Accordingly, the analyst randomly surveys 10 production periods each day for 14 days and records the sample mean and range for each day.
Referring to Scenario 19-3, suppose the analyst constructs an R chart to see if the variability in production times is in-control.What is the upper control limit for this R chart?
A)10.66
B)9.37
C)7.98
D)6.34
Referring to Scenario 19-3, suppose the analyst constructs an R chart to see if the variability in production times is in-control.What is the upper control limit for this R chart?
A)10.66
B)9.37
C)7.98
D)6.34
سؤال
سؤال
SCENARIO 19-2 A political pollster randomly selects a sample of 100 voters each day for 8 successive days and asks how many will vote for the incumbent.The pollster wishes to construct a p chart to see if the percentage favoring the incumbent candidate is too erratic.
Referring to Scenario 19-2, what is the numerical value of the upper control limit for the p chart?
A)0.92
B)0.89
C)0.71
D)0.62
Referring to Scenario 19-2, what is the numerical value of the upper control limit for the p chart?
A)0.92
B)0.89
C)0.71
D)0.62
سؤال
SCENARIO 19-3 A quality control analyst for a light bulb manufacturer is concerned that the time it takes to produce a batch of light bulbs is too erratic.Accordingly, the analyst randomly surveys 10 production periods each day for 14 days and records the sample mean and range for each day.
Referring to Scenario 19-3, suppose the analyst constructs an R chart to see if the variability in production times is in-control.What is the lower control limit for this R chart?
A)4.84
B)3.37
C)2.98
D)1.34
Referring to Scenario 19-3, suppose the analyst constructs an R chart to see if the variability in production times is in-control.What is the lower control limit for this R chart?
A)4.84
B)3.37
C)2.98
D)1.34
سؤال
SCENARIO 19-2 A political pollster randomly selects a sample of 100 voters each day for 8 successive days and asks how many will vote for the incumbent.The pollster wishes to construct a p chart to see if the percentage favoring the incumbent candidate is too erratic.
Referring to Scenario 19-2, what is the numerical value of the center line for the p chart?
A)0.53
B)0.56
C)0.63
D)0.66
Referring to Scenario 19-2, what is the numerical value of the center line for the p chart?
A)0.53
B)0.56
C)0.63
D)0.66
سؤال
SCENARIO 19-4 A factory supervisor is concerned that the time it takes workers to complete an important production task (measured in seconds)is too erratic and adversely affects expected profits.The supervisor proceeds by randomly sampling 5 individuals per hour for a period of 10 hours.The sample mean and range for each hour are listed below. 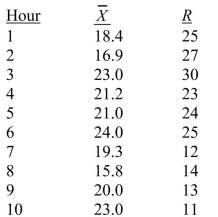 She also decides that lower and upper specification limits for the critical-to-quality variable should be 10 and 30 seconds, respectively.
Referring to Scenario 19-4, what is the value of the C index?
She also decides that lower and upper specification limits for the critical-to-quality variable should be 10 and 30 seconds, respectively.Referring to Scenario 19-4, what is the value of the C
index? سؤال
SCENARIO 19-4 A factory supervisor is concerned that the time it takes workers to complete an important production task (measured in seconds)is too erratic and adversely affects expected profits.The supervisor proceeds by randomly sampling 5 individuals per hour for a period of 10 hours.The sample mean and range for each hour are listed below. She also decides that lower and upper specification limits for the critical-to-quality variable should be 10 and 30 seconds, respectively.
Referring to Scenario 19-4, suppose the supervisor constructs an R chart to see if the variability in collection times is in-control.What is the center line of this R chart?
A)20.00
B)20.56
C)20.40
D)24.00
She also decides that lower and upper specification limits for the critical-to-quality variable should be 10 and 30 seconds, respectively.Referring to Scenario 19-4, suppose the supervisor constructs an R chart to see if the variability in collection times is in-control.What is the center line of this R chart?
A)20.00
B)20.56
C)20.40
D)24.00
سؤال
SCENARIO 19-4 A factory supervisor is concerned that the time it takes workers to complete an important production task (measured in seconds)is too erratic and adversely affects expected profits.The supervisor proceeds by randomly sampling 5 individuals per hour for a period of 10 hours.The sample mean and range for each hour are listed below. She also decides that lower and upper specification limits for the critical-to-quality variable should be 10 and 30 seconds, respectively.
Referring to Scenario 19-4, what is the value of the CPU index?
She also decides that lower and upper specification limits for the critical-to-quality variable should be 10 and 30 seconds, respectively.Referring to Scenario 19-4, what is the value of the CPU index?
سؤال
SCENARIO 19-4 A factory supervisor is concerned that the time it takes workers to complete an important production task (measured in seconds)is too erratic and adversely affects expected profits.The supervisor proceeds by randomly sampling 5 individuals per hour for a period of 10 hours.The sample mean and range for each hour are listed below. She also decides that lower and upper specification limits for the critical-to-quality variable should be 10 and 30 seconds, respectively.
Referring to Scenario 19-4, suppose the sample mean and range data were based on 6 observations per hour instead of 5.How would this change affect the lower and upper control limits of an R chart?
A)LCL would increase; UCL would decrease.
B)LCL would remain the same; UCL would decrease.
C)Both LCL and UCL would remain the same.
D)LCL would decrease; UCL would increase.
She also decides that lower and upper specification limits for the critical-to-quality variable should be 10 and 30 seconds, respectively.Referring to Scenario 19-4, suppose the sample mean and range data were based on 6 observations per hour instead of 5.How would this change affect the lower and upper control limits of an R chart?
A)LCL would increase; UCL would decrease.
B)LCL would remain the same; UCL would decrease.
C)Both LCL and UCL would remain the same.
D)LCL would decrease; UCL would increase.
سؤال
SCENARIO 19-4 A factory supervisor is concerned that the time it takes workers to complete an important production task (measured in seconds)is too erratic and adversely affects expected profits.The supervisor proceeds by randomly sampling 5 individuals per hour for a period of 10 hours.The sample mean and range for each hour are listed below. She also decides that lower and upper specification limits for the critical-to-quality variable should be 10 and 30 seconds, respectively.
Referring to Scenario 19-4, what is the value of the C index?
She also decides that lower and upper specification limits for the critical-to-quality variable should be 10 and 30 seconds, respectively.Referring to Scenario 19-4, what is the value of the C
index? سؤال
SCENARIO 19-3 A quality control analyst for a light bulb manufacturer is concerned that the time it takes to produce a batch of light bulbs is too erratic.Accordingly, the analyst randomly surveys 10 production periods each day for 14 days and records the sample mean and range for each day.
Referring to Scenario 19-3, suppose the sample mean and range data were based on 11 observations per day instead of 10.How would this change affect the lower and upper control limits of the R chart?
A)LCL would increase; UCL would decrease.
B)LCL would remain the same; UCL would decrease.
C)Both LCL and UCL would remain the same.
D)LCL would decrease; UCL would increase.
سؤال
SCENARIO 19-4 A factory supervisor is concerned that the time it takes workers to complete an important production task (measured in seconds)is too erratic and adversely affects expected profits.The supervisor proceeds by randomly sampling 5 individuals per hour for a period of 10 hours.The sample mean and range for each hour are listed below. She also decides that lower and upper specification limits for the critical-to-quality variable should be 10 and 30 seconds, respectively.
Referring to Scenario 19-4, what is the value of the CPL index?
She also decides that lower and upper specification limits for the critical-to-quality variable should be 10 and 30 seconds, respectively.Referring to Scenario 19-4, what is the value of the CPL index?
سؤال
SCENARIO 19-4 A factory supervisor is concerned that the time it takes workers to complete an important production task (measured in seconds)is too erratic and adversely affects expected profits.The supervisor proceeds by randomly sampling 5 individuals per hour for a period of 10 hours.The sample mean and range for each hour are listed below. She also decides that lower and upper specification limits for the critical-to-quality variable should be 10 and 30 seconds, respectively.
Referring to Scenario 19-4, what is the value of factor?
She also decides that lower and upper specification limits for the critical-to-quality variable should be 10 and 30 seconds, respectively.Referring to Scenario 19-4, what is the value of
factor? سؤال
SCENARIO 19-3 A quality control analyst for a light bulb manufacturer is concerned that the time it takes to produce a batch of light bulbs is too erratic.Accordingly, the analyst randomly surveys 10 production periods each day for 14 days and records the sample mean and range for each day.
Referring to Scenario 19-3, suppose the analyst constructs an chart to see if the production process is in-control.What is the upper control limit (UCL)for this chart?
A)62.15
B)60.95
C)59.85
D)58.75
Referring to Scenario 19-3, suppose the analyst constructs an
chart to see if the production process is in-control.What is the upper control limit (UCL)for this chart?A)62.15
B)60.95
C)59.85
D)58.75
سؤال
SCENARIO 19-4 A factory supervisor is concerned that the time it takes workers to complete an important production task (measured in seconds)is too erratic and adversely affects expected profits.The supervisor proceeds by randomly sampling 5 individuals per hour for a period of 10 hours.The sample mean and range for each hour are listed below. She also decides that lower and upper specification limits for the critical-to-quality variable should be 10 and 30 seconds, respectively.
Referring to Scenario 19-4, suppose the supervisor constructs an R chart to see if the variability in collection times is in-control.This R chart is characterized by which of the following?
A)Decreasing trend
B)Increasing trend
C)In-control
D)Individual outliers
She also decides that lower and upper specification limits for the critical-to-quality variable should be 10 and 30 seconds, respectively.Referring to Scenario 19-4, suppose the supervisor constructs an R chart to see if the variability in collection times is in-control.This R chart is characterized by which of the following?
A)Decreasing trend
B)Increasing trend
C)In-control
D)Individual outliers
سؤال
سؤال
SCENARIO 19-4 A factory supervisor is concerned that the time it takes workers to complete an important production task (measured in seconds)is too erratic and adversely affects expected profits.The supervisor proceeds by randomly sampling 5 individuals per hour for a period of 10 hours.The sample mean and range for each hour are listed below. She also decides that lower and upper specification limits for the critical-to-quality variable should be 10 and 30 seconds, respectively.
Referring to Scenario 19-4, what percentage of the time it takes workers to complete an important production task will fall inside the specification limits?
She also decides that lower and upper specification limits for the critical-to-quality variable should be 10 and 30 seconds, respectively.Referring to Scenario 19-4, what percentage of the time it takes workers to complete an important production task will fall inside the specification limits?
سؤال
SCENARIO 19-4 A factory supervisor is concerned that the time it takes workers to complete an important production task (measured in seconds)is too erratic and adversely affects expected profits.The supervisor proceeds by randomly sampling 5 individuals per hour for a period of 10 hours.The sample mean and range for each hour are listed below. She also decides that lower and upper specification limits for the critical-to-quality variable should be 10 and 30 seconds, respectively.
Referring to Scenario 19-4, suppose the supervisor constructs an chart to see if the process is in-control.Which expression best describes this chart?
A)Decreasing trend
B)In-control
C)Increasing trend
D)Individual outliers
She also decides that lower and upper specification limits for the critical-to-quality variable should be 10 and 30 seconds, respectively.Referring to Scenario 19-4, suppose the supervisor constructs an
chart to see if the process is in-control.Which expression best describes this chart?A)Decreasing trend
B)In-control
C)Increasing trend
D)Individual outliers
سؤال
SCENARIO 19-3 A quality control analyst for a light bulb manufacturer is concerned that the time it takes to produce a batch of light bulbs is too erratic.Accordingly, the analyst randomly surveys 10 production periods each day for 14 days and records the sample mean and range for each day.
Referring to Scenario 19-3, suppose the analyst constructs an chart to see if the production process is in-control.What is the lower control limit (LCL)for this chart?
A)47.60
B)56.15
C)57.15
D)58.05
Referring to Scenario 19-3, suppose the analyst constructs an
chart to see if the production process is in-control.What is the lower control limit (LCL)for this chart?A)47.60
B)56.15
C)57.15
D)58.05
سؤال
SCENARIO 19-3 A quality control analyst for a light bulb manufacturer is concerned that the time it takes to produce a batch of light bulbs is too erratic.Accordingly, the analyst randomly surveys 10 production periods each day for 14 days and records the sample mean and range for each day.
Referring to Scenario 19-3, suppose the analyst constructs an R chart to see if the variability in production times is in-control.The R chart is characterized by which of the following?
A)Increasing trend
B)Decreasing trend
C)In-control
D)Points outside the control limits
Referring to Scenario 19-3, suppose the analyst constructs an R chart to see if the variability in production times is in-control.The R chart is characterized by which of the following?
A)Increasing trend
B)Decreasing trend
C)In-control
D)Points outside the control limits
سؤال
SCENARIO 19-3 A quality control analyst for a light bulb manufacturer is concerned that the time it takes to produce a batch of light bulbs is too erratic.Accordingly, the analyst randomly surveys 10 production periods each day for 14 days and records the sample mean and range for each day.
Referring to Scenario 19-3, suppose the analyst constructs an chart to see if the production process is in-control.Which expression best describes this chart?
A)In-control
B)Increasing trend
C)Decreasing trend
D)Individual outliers
Referring to Scenario 19-3, suppose the analyst constructs an
chart to see if the production process is in-control.Which expression best describes this chart?A)In-control
B)Increasing trend
C)Decreasing trend
D)Individual outliers
سؤال
SCENARIO 19-4 A factory supervisor is concerned that the time it takes workers to complete an important production task (measured in seconds)is too erratic and adversely affects expected profits.The supervisor proceeds by randomly sampling 5 individuals per hour for a period of 10 hours.The sample mean and range for each hour are listed below. She also decides that lower and upper specification limits for the critical-to-quality variable should be 10 and 30 seconds, respectively.
Referring to Scenario 19-4, suppose the supervisor constructs an R chart to see if the variability in collection times is in-control.What are the lower and upper control limits for this R chart?
A)
B)
C)
D)
She also decides that lower and upper specification limits for the critical-to-quality variable should be 10 and 30 seconds, respectively.Referring to Scenario 19-4, suppose the supervisor constructs an R chart to see if the variability in collection times is in-control.What are the lower and upper control limits for this R chart?
A)
B)
C)
D)
سؤال
SCENARIO 19-3 A quality control analyst for a light bulb manufacturer is concerned that the time it takes to produce a batch of light bulbs is too erratic.Accordingly, the analyst randomly surveys 10 production periods each day for 14 days and records the sample mean and range for each day.
Referring to Scenario 19-3, suppose the analyst constructs an chart to see if the production process is in-control.What is the center line for this chart?
A)64.3
B)59.5
C)58.0
D)57.1
Referring to Scenario 19-3, suppose the analyst constructs an
chart to see if the production process is in-control.What is the center line for this chart?A)64.3
B)59.5
C)58.0
D)57.1
سؤال
SCENARIO 19-4 A factory supervisor is concerned that the time it takes workers to complete an important production task (measured in seconds)is too erratic and adversely affects expected profits.The supervisor proceeds by randomly sampling 5 individuals per hour for a period of 10 hours.The sample mean and range for each hour are listed below. She also decides that lower and upper specification limits for the critical-to-quality variable should be 10 and 30 seconds, respectively.
Referring to Scenario 19-4, suppose the supervisor constructs an chart to see if the process is in-control.What is the center line of the chart?
A)20.00
B)20.26
C)21.00
D)24.26
She also decides that lower and upper specification limits for the critical-to-quality variable should be 10 and 30 seconds, respectively.Referring to Scenario 19-4, suppose the supervisor constructs an
chart to see if the process is in-control.What is the center line of the chart?A)20.00
B)20.26
C)21.00
D)24.26
سؤال
SCENARIO 19-4 A factory supervisor is concerned that the time it takes workers to complete an important production task (measured in seconds)is too erratic and adversely affects expected profits.The supervisor proceeds by randomly sampling 5 individuals per hour for a period of 10 hours.The sample mean and range for each hour are listed below. She also decides that lower and upper specification limits for the critical-to-quality variable should be 10 and 30 seconds, respectively.
Referring to Scenario 19-4, suppose the supervisor constructs an chart to see if the process is in-control.What are the lower and upper control limits of this chart?
A)
B)
C)
D)
She also decides that lower and upper specification limits for the critical-to-quality variable should be 10 and 30 seconds, respectively.Referring to Scenario 19-4, suppose the supervisor constructs an
chart to see if the process is in-control.What are the lower and upper control limits of this chart?A)
B)
C)
D)
سؤال
سؤال
SCENARIO 19-5 A manufacturer of computer disks took samples of 240 disks on 15 consecutive days.The number of disks with bad sectors was determined for each of these samples.The results are in the table that follows. 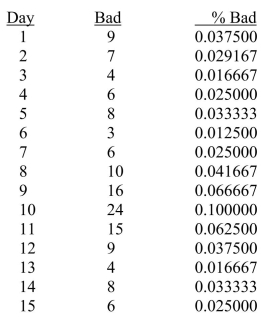
Referring to Scenario 19-5, a p control chart is to be made for these data.The center line of the control chart is __________.
Referring to Scenario 19-5, a p control chart is to be made for these data.The center line of the control chart is __________.
سؤال
SCENARIO 19-5 A manufacturer of computer disks took samples of 240 disks on 15 consecutive days.The number of disks with bad sectors was determined for each of these samples.The results are in the table that follows.
Referring to Scenario 19-5, construct a p control chart for these data.
Referring to Scenario 19-5, construct a p control chart for these data.
سؤال
سؤال
SCENARIO 19-5 A manufacturer of computer disks took samples of 240 disks on 15 consecutive days.The number of disks with bad sectors was determined for each of these samples.The results are in the table that follows.
Referring to Scenario 19-5, a p control chart is to be made for these data.The estimate of the standard error of the proportion of disks with bad sectors is __________.
Referring to Scenario 19-5, a p control chart is to be made for these data.The estimate of the standard error of the proportion of disks with bad sectors is __________.
سؤال
سؤال
SCENARIO 19-5 A manufacturer of computer disks took samples of 240 disks on 15 consecutive days.The number of disks with bad sectors was determined for each of these samples.The results are in the table that follows.
Referring to Scenario 19-5, a p control chart is to be made for these data.The upper control limit is __________, and the lower control limit is __________.
Referring to Scenario 19-5, a p control chart is to be made for these data.The upper control limit is __________, and the lower control limit is __________.
سؤال
سؤال
SCENARIO 19-6 The maker of a packaged candy wants to evaluate the quality of her production process.On each of 16 consecutive days, she samples 600 bags of candy and determines the number in each day's sample that she considers to be of poor quality.The data that she developed follow. 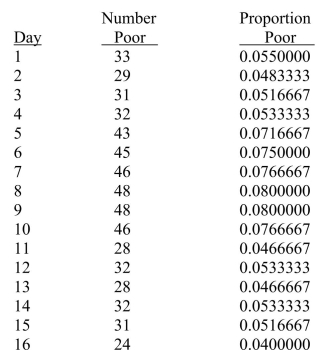
Referring to Scenario 19-6, a p control chart is to be constructed for these data.The center line for the chart should be located at __________.
Referring to Scenario 19-6, a p control chart is to be constructed for these data.The center line for the chart should be located at __________.
سؤال
سؤال
SCENARIO 19-6 The maker of a packaged candy wants to evaluate the quality of her production process.On each of 16 consecutive days, she samples 600 bags of candy and determines the number in each day's sample that she considers to be of poor quality.The data that she developed follow.
Referring to Scenario 19-6, the estimate of the proportion of poor quality bags of candy is __________.
Referring to Scenario 19-6, the estimate of the proportion of poor quality bags of candy is __________.
سؤال
سؤال
سؤال
سؤال
سؤال
سؤال
It is not possible for the  chart to be out-of-control when the R chart is in control.
chart to be out-of-control when the R chart is in control. سؤال
SCENARIO 19-5 A manufacturer of computer disks took samples of 240 disks on 15 consecutive days.The number of disks with bad sectors was determined for each of these samples.The results are in the table that follows.
Referring to Scenario 19-5, the best estimate of the mean proportion of disks with bad sectors is __________.
Referring to Scenario 19-5, the best estimate of the mean proportion of disks with bad sectors is __________.
سؤال
سؤال
SCENARIO 19-5 A manufacturer of computer disks took samples of 240 disks on 15 consecutive days.The number of disks with bad sectors was determined for each of these samples.The results are in the table that follows.
Referring to Scenario 19-5, the process seems to be in control.
Referring to Scenario 19-5, the process seems to be in control.
سؤال
SCENARIO 19-6 The maker of a packaged candy wants to evaluate the quality of her production process.On each of 16 consecutive days, she samples 600 bags of candy and determines the number in each day's sample that she considers to be of poor quality.The data that she developed follow.
Referring to Scenario 19-6, the process seems to be in control.
Referring to Scenario 19-6, the process seems to be in control.
سؤال
SCENARIO 19-7 A supplier of silicone sheets for producers of computer chips wants to evaluate her manufacturing process.She takes samples of size 5 from each day's output and counts the number of blemishes on each silicone sheet.The results from 20 days of such evaluations are presented below. 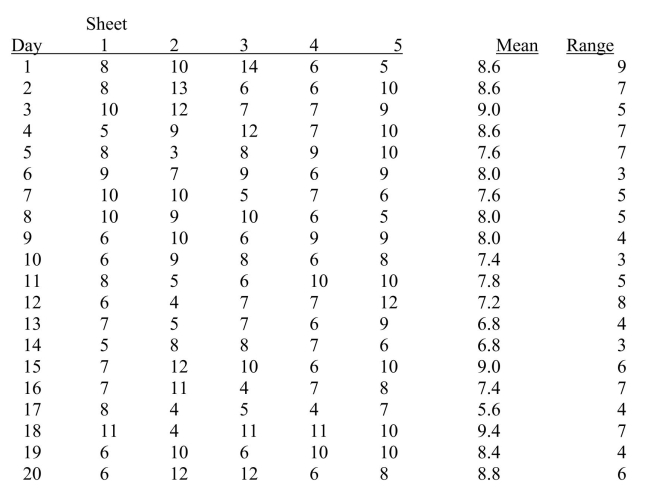 She also decides that the upper specification limit is 10 blemishes.
Referring to Scenario 19-7, an R chart is to be constructed for the number of blemishes. One way to create the lower control limit involves multiplying the mean of the sample ranges by For this data set, the value of
  is ________.
She also decides that the upper specification limit is 10 blemishes.Referring to Scenario 19-7, an R chart is to be constructed for the number of blemishes. One way to create the lower control limit involves multiplying the mean of the sample ranges by
For this data set, the value of is ________. سؤال
SCENARIO 19-7 A supplier of silicone sheets for producers of computer chips wants to evaluate her manufacturing process.She takes samples of size 5 from each day's output and counts the number of blemishes on each silicone sheet.The results from 20 days of such evaluations are presented below. She also decides that the upper specification limit is 10 blemishes.
Referring to Scenario 19-7, an chart is to be used for the number of blemishes.One way to obtain the control limits is to take the grand mean and add and subtract the product of
  times the mean of the sample ranges.For this data set, the value of
  is ________.
She also decides that the upper specification limit is 10 blemishes.Referring to Scenario 19-7, an
chart is to be used for the number of blemishes.One way to obtain the control limits is to take the grand mean and add and subtract the product of times the mean of the sample ranges.For this data set, the value of is ________. سؤال
SCENARIO 19-7 A supplier of silicone sheets for producers of computer chips wants to evaluate her manufacturing process.She takes samples of size 5 from each day's output and counts the number of blemishes on each silicone sheet.The results from 20 days of such evaluations are presented below. She also decides that the upper specification limit is 10 blemishes.
Referring to Scenario 19-7, what is the value of the CPU index?
She also decides that the upper specification limit is 10 blemishes.Referring to Scenario 19-7, what is the value of the CPU index?
سؤال
SCENARIO 19-8 Recently, a university switched to a new type of computer-based registration.The registrar is concerned with the amount of time students are spending on the computer registering under the new system.She decides to randomly select 8 students on each of the 12 days of the registration and determine the time each spends on the computer registering.The range, mean, and standard deviation of the times required to register are in the table that follows. 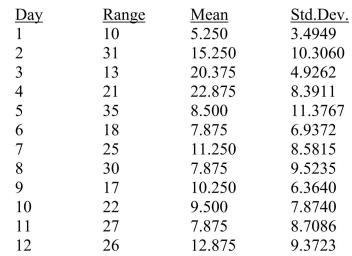
Referring to Scenario 19-8, an R chart is to be constructed for the time required to register. The center line of this R chart is located at __________.
Referring to Scenario 19-8, an R chart is to be constructed for the time required to register. The center line of this R chart is located at __________.
سؤال
SCENARIO 19-7 A supplier of silicone sheets for producers of computer chips wants to evaluate her manufacturing process.She takes samples of size 5 from each day's output and counts the number of blemishes on each silicone sheet.The results from 20 days of such evaluations are presented below. She also decides that the upper specification limit is 10 blemishes.
Referring to Scenario 19-7, an R chart is to be constructed for the number of blemishes. The upper control limit for this data set is ________.
She also decides that the upper specification limit is 10 blemishes.Referring to Scenario 19-7, an R chart is to be constructed for the number of blemishes. The upper control limit for this data set is ________.
سؤال
SCENARIO 19-6 The maker of a packaged candy wants to evaluate the quality of her production process.On each of 16 consecutive days, she samples 600 bags of candy and determines the number in each day's sample that she considers to be of poor quality.The data that she developed follow.
Referring to Scenario 19-6, a p control chart is to be constructed for these data.The lower control limit is __________, while the upper control limit is __________.
Referring to Scenario 19-6, a p control chart is to be constructed for these data.The lower control limit is __________, while the upper control limit is __________.
سؤال
SCENARIO 19-7 A supplier of silicone sheets for producers of computer chips wants to evaluate her manufacturing process.She takes samples of size 5 from each day's output and counts the number of blemishes on each silicone sheet.The results from 20 days of such evaluations are presented below. She also decides that the upper specification limit is 10 blemishes.
Referring to Scenario 19-7, an chart is to be used for the number of blemishes.The center line of this chart is located at __________.
She also decides that the upper specification limit is 10 blemishes.Referring to Scenario 19-7, an
chart is to be used for the number of blemishes.The center line of this chart is located at __________. سؤال
SCENARIO 19-6 The maker of a packaged candy wants to evaluate the quality of her production process.On each of 16 consecutive days, she samples 600 bags of candy and determines the number in each day's sample that she considers to be of poor quality.The data that she developed follow.
Referring to Scenario 19-6, construct a p control chart for these data.
Referring to Scenario 19-6, construct a p control chart for these data.
سؤال
SCENARIO 19-7 A supplier of silicone sheets for producers of computer chips wants to evaluate her manufacturing process.She takes samples of size 5 from each day's output and counts the number of blemishes on each silicone sheet.The results from 20 days of such evaluations are presented below. She also decides that the upper specification limit is 10 blemishes.
Referring to Scenario 19-7, an R chart is to be constructed for the number of blemishes. The lower control limit for this data set is ________.
She also decides that the upper specification limit is 10 blemishes.Referring to Scenario 19-7, an R chart is to be constructed for the number of blemishes. The lower control limit for this data set is ________.
سؤال
SCENARIO 19-7 A supplier of silicone sheets for producers of computer chips wants to evaluate her manufacturing process.She takes samples of size 5 from each day's output and counts the number of blemishes on each silicone sheet.The results from 20 days of such evaluations are presented below. She also decides that the upper specification limit is 10 blemishes.
Referring to Scenario 19-7, based on the chart for the number of blemishes, it appears that the process is out of control.
She also decides that the upper specification limit is 10 blemishes.Referring to Scenario 19-7, based on the
chart for the number of blemishes, it appears that the process is out of control. سؤال
SCENARIO 19-7 A supplier of silicone sheets for producers of computer chips wants to evaluate her manufacturing process.She takes samples of size 5 from each day's output and counts the number of blemishes on each silicone sheet.The results from 20 days of such evaluations are presented below. She also decides that the upper specification limit is 10 blemishes.
Referring to Scenario 19-7, what percentage of the chips will fall below the upper specification limit?
She also decides that the upper specification limit is 10 blemishes.Referring to Scenario 19-7, what percentage of the chips will fall below the upper specification limit?
سؤال
SCENARIO 19-7 A supplier of silicone sheets for producers of computer chips wants to evaluate her manufacturing process.She takes samples of size 5 from each day's output and counts the number of blemishes on each silicone sheet.The results from 20 days of such evaluations are presented below. She also decides that the upper specification limit is 10 blemishes.
Referring to Scenario 19-7, an chart is to be used for the number of blemishes.The lower control limit for this data set is ________, while the upper control limit is ________.
She also decides that the upper specification limit is 10 blemishes.Referring to Scenario 19-7, an
chart is to be used for the number of blemishes.The lower control limit for this data set is ________, while the upper control limit is ________. سؤال
SCENARIO 19-6 The maker of a packaged candy wants to evaluate the quality of her production process.On each of 16 consecutive days, she samples 600 bags of candy and determines the number in each day's sample that she considers to be of poor quality.The data that she developed follow.
Referring to Scenario 19-6, a p control chart is to be constructed for these data.The estimate of the standard error of the sample proportion is __________.
Referring to Scenario 19-6, a p control chart is to be constructed for these data.The estimate of the standard error of the sample proportion is __________.
سؤال
SCENARIO 19-7 A supplier of silicone sheets for producers of computer chips wants to evaluate her manufacturing process.She takes samples of size 5 from each day's output and counts the number of blemishes on each silicone sheet.The results from 20 days of such evaluations are presented below. She also decides that the upper specification limit is 10 blemishes.
Referring to Scenario 19-7, an R chart is to be constructed for the number of blemishes. The center line of this R chart is located at __________.
She also decides that the upper specification limit is 10 blemishes.Referring to Scenario 19-7, an R chart is to be constructed for the number of blemishes. The center line of this R chart is located at __________.
سؤال
SCENARIO 19-7 A supplier of silicone sheets for producers of computer chips wants to evaluate her manufacturing process.She takes samples of size 5 from each day's output and counts the number of blemishes on each silicone sheet.The results from 20 days of such evaluations are presented below. She also decides that the upper specification limit is 10 blemishes.
Referring to Scenario 19-7, based on the R chart, it appears that the process is out of control.
She also decides that the upper specification limit is 10 blemishes.Referring to Scenario 19-7, based on the R chart, it appears that the process is out of control.
سؤال
SCENARIO 19-7 A supplier of silicone sheets for producers of computer chips wants to evaluate her manufacturing process.She takes samples of size 5 from each day's output and counts the number of blemishes on each silicone sheet.The results from 20 days of such evaluations are presented below. She also decides that the upper specification limit is 10 blemishes.
Referring to Scenario 19-7, what is the value of factor?
She also decides that the upper specification limit is 10 blemishes.Referring to Scenario 19-7, what is the value of
factor? سؤال
SCENARIO 19-7 A supplier of silicone sheets for producers of computer chips wants to evaluate her manufacturing process.She takes samples of size 5 from each day's output and counts the number of blemishes on each silicone sheet.The results from 20 days of such evaluations are presented below. She also decides that the upper specification limit is 10 blemishes.
Referring to Scenario 19-7, construct an chart for the number of blemishes.
She also decides that the upper specification limit is 10 blemishes.Referring to Scenario 19-7, construct an
chart for the number of blemishes. سؤال
SCENARIO 19-7 A supplier of silicone sheets for producers of computer chips wants to evaluate her manufacturing process.She takes samples of size 5 from each day's output and counts the number of blemishes on each silicone sheet.The results from 20 days of such evaluations are presented below. She also decides that the upper specification limit is 10 blemishes.
Referring to Scenario 19-7, an R chart is to be constructed for the number of blemishes. One way to create the upper control limit involves multiplying the mean of the sample ranges by For this data set, the value of
  is ________.
She also decides that the upper specification limit is 10 blemishes.Referring to Scenario 19-7, an R chart is to be constructed for the number of blemishes. One way to create the upper control limit involves multiplying the mean of the sample ranges by
For this data set, the value of is ________. سؤال
SCENARIO 19-7 A supplier of silicone sheets for producers of computer chips wants to evaluate her manufacturing process.She takes samples of size 5 from each day's output and counts the number of blemishes on each silicone sheet.The results from 20 days of such evaluations are presented below. She also decides that the upper specification limit is 10 blemishes.
Referring to Scenario 19-7, construct an R chart for the number of blemishes.
She also decides that the upper specification limit is 10 blemishes.Referring to Scenario 19-7, construct an R chart for the number of blemishes.

فتح الحزمة
قم بالتسجيل لفتح البطاقات في هذه المجموعة!
Unlock Deck
Unlock Deck
1/162
العب
ملء الشاشة (f)
Deck 19: Statistical Applications in Quality Management Online
1
A process is said to be out of control if
A)a point falls above the upper or below the lower control lines.
B)eight or more consecutive points fall above the center line or eight or more consecutive points fall below the center line.
C)Either of the above.
D)None of the above.
A)a point falls above the upper or below the lower control lines.
B)eight or more consecutive points fall above the center line or eight or more consecutive points fall below the center line.
C)Either of the above.
D)None of the above.
Either of the above.
2
The principal focus of the control chart is the attempt to separate special or assignable causes of variation from common causes of variation.Which causes of variation can be reduced only by changing the system?
A)Special or assignable causes
B)Common causes
C)Total causes
D)None of the above
A)Special or assignable causes
B)Common causes
C)Total causes
D)None of the above
Common causes
3
SCENARIO 19-1 A local newspaper has 10 delivery boys who each deliver the morning paper to 50 customers every day.The owner decides to record the number of papers delivered on time for a 10-day period for one of the delivery boys and construct a p chart to see whether the percentage is too erratic.
Referring to Scenario 19-1, what is the numerical value of the upper control limit for the p chart?
A)0.926
B)0.961
C)0.979
D)1.037
Referring to Scenario 19-1, what is the numerical value of the upper control limit for the p chart?
A)0.926
B)0.961
C)0.979
D)1.037
1.037
4
SCENARIO 19-1 A local newspaper has 10 delivery boys who each deliver the morning paper to 50 customers every day.The owner decides to record the number of papers delivered on time for a 10-day period for one of the delivery boys and construct a p chart to see whether the percentage is too erratic.
Referring to Scenario 19-1, what is the numerical value of the lower control limit for the p chart?
A)0.920
B)0.911
C)0.815
D)0.798
Referring to Scenario 19-1, what is the numerical value of the lower control limit for the p chart?
A)0.920
B)0.911
C)0.815
D)0.798
فتح الحزمة
افتح القفل للوصول البطاقات البالغ عددها 162 في هذه المجموعة.
فتح الحزمة
k this deck
5
SCENARIO 19-3 A quality control analyst for a light bulb manufacturer is concerned that the time it takes to produce a batch of light bulbs is too erratic.Accordingly, the analyst randomly surveys 10 production periods each day for 14 days and records the sample mean and range for each day.
Referring to Scenario 19-3, suppose the analyst constructs an R chart to see if the variability in production times is in-control.What is the center line of this R chart?
A)4.8
B)6.0
C)6.9
D)7.1
Referring to Scenario 19-3, suppose the analyst constructs an R chart to see if the variability in production times is in-control.What is the center line of this R chart?
A)4.8
B)6.0
C)6.9
D)7.1
فتح الحزمة
افتح القفل للوصول البطاقات البالغ عددها 162 في هذه المجموعة.
فتح الحزمة
k this deck
6
Which of the following situations suggests a process that appears to be operating out of statistical control?
A)A control chart with a series of consecutive points that are above the center line and a series of consecutive points that are below the center line.
B)A control chart in which points fall outside the lower control limit.
C)A control chart in which several points fall outside the upper control limit.
D)All of the above.
فتح الحزمة
افتح القفل للوصول البطاقات البالغ عددها 162 في هذه المجموعة.
فتح الحزمة
k this deck
7
The control chart
A)focuses on the time dimension of a system.
B)captures the natural variability in the system.
C)can be used for categorical, discrete, or continuous variables.
D)All of the above.
A)focuses on the time dimension of a system.
B)captures the natural variability in the system.
C)can be used for categorical, discrete, or continuous variables.
D)All of the above.
فتح الحزمة
افتح القفل للوصول البطاقات البالغ عددها 162 في هذه المجموعة.
فتح الحزمة
k this deck
8
SCENARIO 19-2 A political pollster randomly selects a sample of 100 voters each day for 8 successive days and asks how many will vote for the incumbent.The pollster wishes to construct a p chart to see if the percentage favoring the incumbent candidate is too erratic.
Referring to Scenario 19-2, what is the numerical value of the lower control limit for the p chart?
A)0.37
B)0.41
C)0.50
D)0.71
Referring to Scenario 19-2, what is the numerical value of the lower control limit for the p chart?
A)0.37
B)0.41
C)0.50
D)0.71
فتح الحزمة
افتح القفل للوصول البطاقات البالغ عددها 162 في هذه المجموعة.
فتح الحزمة
k this deck
9
SCENARIO 19-1 A local newspaper has 10 delivery boys who each deliver the morning paper to 50 customers every day.The owner decides to record the number of papers delivered on time for a 10-day period for one of the delivery boys and construct a p chart to see whether the percentage is too erratic.
Referring to Scenario 19-1, which expression best characterizes the p chart?
A)Cycles
B)Increasing trend
C)In-control
D)Individual outliers
Referring to Scenario 19-1, which expression best characterizes the p chart?
A)Cycles
B)Increasing trend
C)In-control
D)Individual outliers
فتح الحزمة
افتح القفل للوصول البطاقات البالغ عددها 162 في هذه المجموعة.
فتح الحزمة
k this deck
10
Variation due to the inherent variability in a system of operation is called
A)special or assignable causes.
B)common or chance causes.
C)explained variation.
D)the standard deviation.
A)special or assignable causes.
B)common or chance causes.
C)explained variation.
D)the standard deviation.
فتح الحزمة
افتح القفل للوصول البطاقات البالغ عددها 162 في هذه المجموعة.
فتح الحزمة
k this deck
11
SCENARIO 19-1 A local newspaper has 10 delivery boys who each deliver the morning paper to 50 customers every day.The owner decides to record the number of papers delivered on time for a 10-day period for one of the delivery boys and construct a p chart to see whether the percentage is too erratic.
Referring to Scenario 19-1, what is the numerical value of the center line for the p chart?
A)0.926
B)0.911
C)0.885
D)0.500
Referring to Scenario 19-1, what is the numerical value of the center line for the p chart?
A)0.926
B)0.911
C)0.885
D)0.500
فتح الحزمة
افتح القفل للوصول البطاقات البالغ عددها 162 في هذه المجموعة.
فتح الحزمة
k this deck
12
Once the control limits are set for a control chart, one attempts to
A)discern patterns that might exist in values over time.
B)determine whether any points fall outside the control limits.
C)Both of the above.
D)None of the above.
A)discern patterns that might exist in values over time.
B)determine whether any points fall outside the control limits.
C)Both of the above.
D)None of the above.
فتح الحزمة
افتح القفل للوصول البطاقات البالغ عددها 162 في هذه المجموعة.
فتح الحزمة
k this deck
13
One of the morals of the red bead experiment is:
A)variation is part of the process.
B)only management can change the system.
C)it is the system that primarily determines performance.
D)All of the above.
A)variation is part of the process.
B)only management can change the system.
C)it is the system that primarily determines performance.
D)All of the above.
فتح الحزمة
افتح القفل للوصول البطاقات البالغ عددها 162 في هذه المجموعة.
فتح الحزمة
k this deck
14
Which of the following situations suggests a process that appears to be operating in a state of statistical control?
A)A control chart with a series of consecutive points that are above the center line and a series of consecutive points that are below the center line.
B)A control chart in which no points fall outside either the upper control limit or the lower control limit and no patterns are present.
C)A control chart in which several points fall outside the upper control limit.
D)All of the above.
فتح الحزمة
افتح القفل للوصول البطاقات البالغ عددها 162 في هذه المجموعة.
فتح الحزمة
k this deck
15
SCENARIO 19-2 A political pollster randomly selects a sample of 100 voters each day for 8 successive days and asks how many will vote for the incumbent.The pollster wishes to construct a p chart to see if the percentage favoring the incumbent candidate is too erratic.
Referring to Scenario 19-2, which expression best characterizes the p chart?
A)In-control
B)Increasing trend
C)Decreasing trend
D)Individual outliers
Referring to Scenario 19-2, which expression best characterizes the p chart?
A)In-control
B)Increasing trend
C)Decreasing trend
D)Individual outliers
فتح الحزمة
افتح القفل للوصول البطاقات البالغ عددها 162 في هذه المجموعة.
فتح الحزمة
k this deck
16
SCENARIO 19-3 A quality control analyst for a light bulb manufacturer is concerned that the time it takes to produce a batch of light bulbs is too erratic.Accordingly, the analyst randomly surveys 10 production periods each day for 14 days and records the sample mean and range for each day.
Referring to Scenario 19-3, suppose the analyst constructs an R chart to see if the variability in production times is in-control.What is the upper control limit for this R chart?
A)10.66
B)9.37
C)7.98
D)6.34
Referring to Scenario 19-3, suppose the analyst constructs an R chart to see if the variability in production times is in-control.What is the upper control limit for this R chart?
A)10.66
B)9.37
C)7.98
D)6.34
فتح الحزمة
افتح القفل للوصول البطاقات البالغ عددها 162 في هذه المجموعة.
فتح الحزمة
k this deck
17
Variation signaled by individual fluctuations or patterns in the data is called
A)special or assignable causes.
B)common or chance causes.
C)explained variation.
D)the standard deviation.
A)special or assignable causes.
B)common or chance causes.
C)explained variation.
D)the standard deviation.
فتح الحزمة
افتح القفل للوصول البطاقات البالغ عددها 162 في هذه المجموعة.
فتح الحزمة
k this deck
18
SCENARIO 19-2 A political pollster randomly selects a sample of 100 voters each day for 8 successive days and asks how many will vote for the incumbent.The pollster wishes to construct a p chart to see if the percentage favoring the incumbent candidate is too erratic.
Referring to Scenario 19-2, what is the numerical value of the upper control limit for the p chart?
A)0.92
B)0.89
C)0.71
D)0.62
Referring to Scenario 19-2, what is the numerical value of the upper control limit for the p chart?
A)0.92
B)0.89
C)0.71
D)0.62
فتح الحزمة
افتح القفل للوصول البطاقات البالغ عددها 162 في هذه المجموعة.
فتح الحزمة
k this deck
19
SCENARIO 19-3 A quality control analyst for a light bulb manufacturer is concerned that the time it takes to produce a batch of light bulbs is too erratic.Accordingly, the analyst randomly surveys 10 production periods each day for 14 days and records the sample mean and range for each day.
Referring to Scenario 19-3, suppose the analyst constructs an R chart to see if the variability in production times is in-control.What is the lower control limit for this R chart?
A)4.84
B)3.37
C)2.98
D)1.34
Referring to Scenario 19-3, suppose the analyst constructs an R chart to see if the variability in production times is in-control.What is the lower control limit for this R chart?
A)4.84
B)3.37
C)2.98
D)1.34
فتح الحزمة
افتح القفل للوصول البطاقات البالغ عددها 162 في هذه المجموعة.
فتح الحزمة
k this deck
20
SCENARIO 19-2 A political pollster randomly selects a sample of 100 voters each day for 8 successive days and asks how many will vote for the incumbent.The pollster wishes to construct a p chart to see if the percentage favoring the incumbent candidate is too erratic.
Referring to Scenario 19-2, what is the numerical value of the center line for the p chart?
A)0.53
B)0.56
C)0.63
D)0.66
Referring to Scenario 19-2, what is the numerical value of the center line for the p chart?
A)0.53
B)0.56
C)0.63
D)0.66
فتح الحزمة
افتح القفل للوصول البطاقات البالغ عددها 162 في هذه المجموعة.
فتح الحزمة
k this deck
21
SCENARIO 19-4 A factory supervisor is concerned that the time it takes workers to complete an important production task (measured in seconds)is too erratic and adversely affects expected profits.The supervisor proceeds by randomly sampling 5 individuals per hour for a period of 10 hours.The sample mean and range for each hour are listed below. She also decides that lower and upper specification limits for the critical-to-quality variable should be 10 and 30 seconds, respectively.
Referring to Scenario 19-4, what is the value of the C index?
She also decides that lower and upper specification limits for the critical-to-quality variable should be 10 and 30 seconds, respectively.Referring to Scenario 19-4, what is the value of the C
index? فتح الحزمة
افتح القفل للوصول البطاقات البالغ عددها 162 في هذه المجموعة.
فتح الحزمة
k this deck
22
SCENARIO 19-4 A factory supervisor is concerned that the time it takes workers to complete an important production task (measured in seconds)is too erratic and adversely affects expected profits.The supervisor proceeds by randomly sampling 5 individuals per hour for a period of 10 hours.The sample mean and range for each hour are listed below. She also decides that lower and upper specification limits for the critical-to-quality variable should be 10 and 30 seconds, respectively.
Referring to Scenario 19-4, suppose the supervisor constructs an R chart to see if the variability in collection times is in-control.What is the center line of this R chart?
A)20.00
B)20.56
C)20.40
D)24.00
She also decides that lower and upper specification limits for the critical-to-quality variable should be 10 and 30 seconds, respectively.Referring to Scenario 19-4, suppose the supervisor constructs an R chart to see if the variability in collection times is in-control.What is the center line of this R chart?
A)20.00
B)20.56
C)20.40
D)24.00
فتح الحزمة
افتح القفل للوصول البطاقات البالغ عددها 162 في هذه المجموعة.
فتح الحزمة
k this deck
23
SCENARIO 19-4 A factory supervisor is concerned that the time it takes workers to complete an important production task (measured in seconds)is too erratic and adversely affects expected profits.The supervisor proceeds by randomly sampling 5 individuals per hour for a period of 10 hours.The sample mean and range for each hour are listed below. She also decides that lower and upper specification limits for the critical-to-quality variable should be 10 and 30 seconds, respectively.
Referring to Scenario 19-4, what is the value of the CPU index?
She also decides that lower and upper specification limits for the critical-to-quality variable should be 10 and 30 seconds, respectively.Referring to Scenario 19-4, what is the value of the CPU index?
فتح الحزمة
افتح القفل للوصول البطاقات البالغ عددها 162 في هذه المجموعة.
فتح الحزمة
k this deck
24
SCENARIO 19-4 A factory supervisor is concerned that the time it takes workers to complete an important production task (measured in seconds)is too erratic and adversely affects expected profits.The supervisor proceeds by randomly sampling 5 individuals per hour for a period of 10 hours.The sample mean and range for each hour are listed below. She also decides that lower and upper specification limits for the critical-to-quality variable should be 10 and 30 seconds, respectively.
Referring to Scenario 19-4, suppose the sample mean and range data were based on 6 observations per hour instead of 5.How would this change affect the lower and upper control limits of an R chart?
A)LCL would increase; UCL would decrease.
B)LCL would remain the same; UCL would decrease.
C)Both LCL and UCL would remain the same.
D)LCL would decrease; UCL would increase.
She also decides that lower and upper specification limits for the critical-to-quality variable should be 10 and 30 seconds, respectively.Referring to Scenario 19-4, suppose the sample mean and range data were based on 6 observations per hour instead of 5.How would this change affect the lower and upper control limits of an R chart?
A)LCL would increase; UCL would decrease.
B)LCL would remain the same; UCL would decrease.
C)Both LCL and UCL would remain the same.
D)LCL would decrease; UCL would increase.
فتح الحزمة
افتح القفل للوصول البطاقات البالغ عددها 162 في هذه المجموعة.
فتح الحزمة
k this deck
25
SCENARIO 19-4 A factory supervisor is concerned that the time it takes workers to complete an important production task (measured in seconds)is too erratic and adversely affects expected profits.The supervisor proceeds by randomly sampling 5 individuals per hour for a period of 10 hours.The sample mean and range for each hour are listed below. She also decides that lower and upper specification limits for the critical-to-quality variable should be 10 and 30 seconds, respectively.
Referring to Scenario 19-4, what is the value of the C index?
She also decides that lower and upper specification limits for the critical-to-quality variable should be 10 and 30 seconds, respectively.Referring to Scenario 19-4, what is the value of the C
index? فتح الحزمة
افتح القفل للوصول البطاقات البالغ عددها 162 في هذه المجموعة.
فتح الحزمة
k this deck
26
SCENARIO 19-3 A quality control analyst for a light bulb manufacturer is concerned that the time it takes to produce a batch of light bulbs is too erratic.Accordingly, the analyst randomly surveys 10 production periods each day for 14 days and records the sample mean and range for each day.
Referring to Scenario 19-3, suppose the sample mean and range data were based on 11 observations per day instead of 10.How would this change affect the lower and upper control limits of the R chart?
A)LCL would increase; UCL would decrease.
B)LCL would remain the same; UCL would decrease.
C)Both LCL and UCL would remain the same.
D)LCL would decrease; UCL would increase.
فتح الحزمة
افتح القفل للوصول البطاقات البالغ عددها 162 في هذه المجموعة.
فتح الحزمة
k this deck
27
SCENARIO 19-4 A factory supervisor is concerned that the time it takes workers to complete an important production task (measured in seconds)is too erratic and adversely affects expected profits.The supervisor proceeds by randomly sampling 5 individuals per hour for a period of 10 hours.The sample mean and range for each hour are listed below. She also decides that lower and upper specification limits for the critical-to-quality variable should be 10 and 30 seconds, respectively.
Referring to Scenario 19-4, what is the value of the CPL index?
She also decides that lower and upper specification limits for the critical-to-quality variable should be 10 and 30 seconds, respectively.Referring to Scenario 19-4, what is the value of the CPL index?
فتح الحزمة
افتح القفل للوصول البطاقات البالغ عددها 162 في هذه المجموعة.
فتح الحزمة
k this deck
28
SCENARIO 19-4 A factory supervisor is concerned that the time it takes workers to complete an important production task (measured in seconds)is too erratic and adversely affects expected profits.The supervisor proceeds by randomly sampling 5 individuals per hour for a period of 10 hours.The sample mean and range for each hour are listed below. She also decides that lower and upper specification limits for the critical-to-quality variable should be 10 and 30 seconds, respectively.
Referring to Scenario 19-4, what is the value of factor?
She also decides that lower and upper specification limits for the critical-to-quality variable should be 10 and 30 seconds, respectively.Referring to Scenario 19-4, what is the value of
factor? فتح الحزمة
افتح القفل للوصول البطاقات البالغ عددها 162 في هذه المجموعة.
فتح الحزمة
k this deck
29
SCENARIO 19-3 A quality control analyst for a light bulb manufacturer is concerned that the time it takes to produce a batch of light bulbs is too erratic.Accordingly, the analyst randomly surveys 10 production periods each day for 14 days and records the sample mean and range for each day.
Referring to Scenario 19-3, suppose the analyst constructs an chart to see if the production process is in-control.What is the upper control limit (UCL)for this chart?
A)62.15
B)60.95
C)59.85
D)58.75
Referring to Scenario 19-3, suppose the analyst constructs an
chart to see if the production process is in-control.What is the upper control limit (UCL)for this chart?A)62.15
B)60.95
C)59.85
D)58.75
فتح الحزمة
افتح القفل للوصول البطاقات البالغ عددها 162 في هذه المجموعة.
فتح الحزمة
k this deck
30
SCENARIO 19-4 A factory supervisor is concerned that the time it takes workers to complete an important production task (measured in seconds)is too erratic and adversely affects expected profits.The supervisor proceeds by randomly sampling 5 individuals per hour for a period of 10 hours.The sample mean and range for each hour are listed below. She also decides that lower and upper specification limits for the critical-to-quality variable should be 10 and 30 seconds, respectively.
Referring to Scenario 19-4, suppose the supervisor constructs an R chart to see if the variability in collection times is in-control.This R chart is characterized by which of the following?
A)Decreasing trend
B)Increasing trend
C)In-control
D)Individual outliers
She also decides that lower and upper specification limits for the critical-to-quality variable should be 10 and 30 seconds, respectively.Referring to Scenario 19-4, suppose the supervisor constructs an R chart to see if the variability in collection times is in-control.This R chart is characterized by which of the following?
A)Decreasing trend
B)Increasing trend
C)In-control
D)Individual outliers
فتح الحزمة
افتح القفل للوصول البطاقات البالغ عددها 162 في هذه المجموعة.
فتح الحزمة
k this deck
31
The control limits are based on the standard deviation of the process.
فتح الحزمة
افتح القفل للوصول البطاقات البالغ عددها 162 في هذه المجموعة.
فتح الحزمة
k this deck
32
SCENARIO 19-4 A factory supervisor is concerned that the time it takes workers to complete an important production task (measured in seconds)is too erratic and adversely affects expected profits.The supervisor proceeds by randomly sampling 5 individuals per hour for a period of 10 hours.The sample mean and range for each hour are listed below. She also decides that lower and upper specification limits for the critical-to-quality variable should be 10 and 30 seconds, respectively.
Referring to Scenario 19-4, what percentage of the time it takes workers to complete an important production task will fall inside the specification limits?
She also decides that lower and upper specification limits for the critical-to-quality variable should be 10 and 30 seconds, respectively.Referring to Scenario 19-4, what percentage of the time it takes workers to complete an important production task will fall inside the specification limits?
فتح الحزمة
افتح القفل للوصول البطاقات البالغ عددها 162 في هذه المجموعة.
فتح الحزمة
k this deck
33
SCENARIO 19-4 A factory supervisor is concerned that the time it takes workers to complete an important production task (measured in seconds)is too erratic and adversely affects expected profits.The supervisor proceeds by randomly sampling 5 individuals per hour for a period of 10 hours.The sample mean and range for each hour are listed below. She also decides that lower and upper specification limits for the critical-to-quality variable should be 10 and 30 seconds, respectively.
Referring to Scenario 19-4, suppose the supervisor constructs an chart to see if the process is in-control.Which expression best describes this chart?
A)Decreasing trend
B)In-control
C)Increasing trend
D)Individual outliers
She also decides that lower and upper specification limits for the critical-to-quality variable should be 10 and 30 seconds, respectively.Referring to Scenario 19-4, suppose the supervisor constructs an
chart to see if the process is in-control.Which expression best describes this chart?A)Decreasing trend
B)In-control
C)Increasing trend
D)Individual outliers
فتح الحزمة
افتح القفل للوصول البطاقات البالغ عددها 162 في هذه المجموعة.
فتح الحزمة
k this deck
34
SCENARIO 19-3 A quality control analyst for a light bulb manufacturer is concerned that the time it takes to produce a batch of light bulbs is too erratic.Accordingly, the analyst randomly surveys 10 production periods each day for 14 days and records the sample mean and range for each day.
Referring to Scenario 19-3, suppose the analyst constructs an chart to see if the production process is in-control.What is the lower control limit (LCL)for this chart?
A)47.60
B)56.15
C)57.15
D)58.05
Referring to Scenario 19-3, suppose the analyst constructs an
chart to see if the production process is in-control.What is the lower control limit (LCL)for this chart?A)47.60
B)56.15
C)57.15
D)58.05
فتح الحزمة
افتح القفل للوصول البطاقات البالغ عددها 162 في هذه المجموعة.
فتح الحزمة
k this deck
35
SCENARIO 19-3 A quality control analyst for a light bulb manufacturer is concerned that the time it takes to produce a batch of light bulbs is too erratic.Accordingly, the analyst randomly surveys 10 production periods each day for 14 days and records the sample mean and range for each day.
Referring to Scenario 19-3, suppose the analyst constructs an R chart to see if the variability in production times is in-control.The R chart is characterized by which of the following?
A)Increasing trend
B)Decreasing trend
C)In-control
D)Points outside the control limits
Referring to Scenario 19-3, suppose the analyst constructs an R chart to see if the variability in production times is in-control.The R chart is characterized by which of the following?
A)Increasing trend
B)Decreasing trend
C)In-control
D)Points outside the control limits
فتح الحزمة
افتح القفل للوصول البطاقات البالغ عددها 162 في هذه المجموعة.
فتح الحزمة
k this deck
36
SCENARIO 19-3 A quality control analyst for a light bulb manufacturer is concerned that the time it takes to produce a batch of light bulbs is too erratic.Accordingly, the analyst randomly surveys 10 production periods each day for 14 days and records the sample mean and range for each day.
Referring to Scenario 19-3, suppose the analyst constructs an chart to see if the production process is in-control.Which expression best describes this chart?
A)In-control
B)Increasing trend
C)Decreasing trend
D)Individual outliers
Referring to Scenario 19-3, suppose the analyst constructs an
chart to see if the production process is in-control.Which expression best describes this chart?A)In-control
B)Increasing trend
C)Decreasing trend
D)Individual outliers
فتح الحزمة
افتح القفل للوصول البطاقات البالغ عددها 162 في هذه المجموعة.
فتح الحزمة
k this deck
37
SCENARIO 19-4 A factory supervisor is concerned that the time it takes workers to complete an important production task (measured in seconds)is too erratic and adversely affects expected profits.The supervisor proceeds by randomly sampling 5 individuals per hour for a period of 10 hours.The sample mean and range for each hour are listed below. She also decides that lower and upper specification limits for the critical-to-quality variable should be 10 and 30 seconds, respectively.
Referring to Scenario 19-4, suppose the supervisor constructs an R chart to see if the variability in collection times is in-control.What are the lower and upper control limits for this R chart?
A)
B)
C)
D)
She also decides that lower and upper specification limits for the critical-to-quality variable should be 10 and 30 seconds, respectively.Referring to Scenario 19-4, suppose the supervisor constructs an R chart to see if the variability in collection times is in-control.What are the lower and upper control limits for this R chart?
A)
B)
C)
D)
فتح الحزمة
افتح القفل للوصول البطاقات البالغ عددها 162 في هذه المجموعة.
فتح الحزمة
k this deck
38
SCENARIO 19-3 A quality control analyst for a light bulb manufacturer is concerned that the time it takes to produce a batch of light bulbs is too erratic.Accordingly, the analyst randomly surveys 10 production periods each day for 14 days and records the sample mean and range for each day.
Referring to Scenario 19-3, suppose the analyst constructs an chart to see if the production process is in-control.What is the center line for this chart?
A)64.3
B)59.5
C)58.0
D)57.1
Referring to Scenario 19-3, suppose the analyst constructs an
chart to see if the production process is in-control.What is the center line for this chart?A)64.3
B)59.5
C)58.0
D)57.1
فتح الحزمة
افتح القفل للوصول البطاقات البالغ عددها 162 في هذه المجموعة.
فتح الحزمة
k this deck
39
SCENARIO 19-4 A factory supervisor is concerned that the time it takes workers to complete an important production task (measured in seconds)is too erratic and adversely affects expected profits.The supervisor proceeds by randomly sampling 5 individuals per hour for a period of 10 hours.The sample mean and range for each hour are listed below. She also decides that lower and upper specification limits for the critical-to-quality variable should be 10 and 30 seconds, respectively.
Referring to Scenario 19-4, suppose the supervisor constructs an chart to see if the process is in-control.What is the center line of the chart?
A)20.00
B)20.26
C)21.00
D)24.26
She also decides that lower and upper specification limits for the critical-to-quality variable should be 10 and 30 seconds, respectively.Referring to Scenario 19-4, suppose the supervisor constructs an
chart to see if the process is in-control.What is the center line of the chart?A)20.00
B)20.26
C)21.00
D)24.26
فتح الحزمة
افتح القفل للوصول البطاقات البالغ عددها 162 في هذه المجموعة.
فتح الحزمة
k this deck
40
SCENARIO 19-4 A factory supervisor is concerned that the time it takes workers to complete an important production task (measured in seconds)is too erratic and adversely affects expected profits.The supervisor proceeds by randomly sampling 5 individuals per hour for a period of 10 hours.The sample mean and range for each hour are listed below. She also decides that lower and upper specification limits for the critical-to-quality variable should be 10 and 30 seconds, respectively.
Referring to Scenario 19-4, suppose the supervisor constructs an chart to see if the process is in-control.What are the lower and upper control limits of this chart?
A)
B)
C)
D)
She also decides that lower and upper specification limits for the critical-to-quality variable should be 10 and 30 seconds, respectively.Referring to Scenario 19-4, suppose the supervisor constructs an
chart to see if the process is in-control.What are the lower and upper control limits of this chart?A)
B)
C)
D)
فتح الحزمة
افتح القفل للوصول البطاقات البالغ عددها 162 في هذه المجموعة.
فتح الحزمة
k this deck
41
The R chart is a control chart used to monitor a process mean.
فتح الحزمة
افتح القفل للوصول البطاقات البالغ عددها 162 في هذه المجموعة.
فتح الحزمة
k this deck
42
SCENARIO 19-5 A manufacturer of computer disks took samples of 240 disks on 15 consecutive days.The number of disks with bad sectors was determined for each of these samples.The results are in the table that follows.
Referring to Scenario 19-5, a p control chart is to be made for these data.The center line of the control chart is __________.
Referring to Scenario 19-5, a p control chart is to be made for these data.The center line of the control chart is __________.
فتح الحزمة
افتح القفل للوصول البطاقات البالغ عددها 162 في هذه المجموعة.
فتح الحزمة
k this deck
43
SCENARIO 19-5 A manufacturer of computer disks took samples of 240 disks on 15 consecutive days.The number of disks with bad sectors was determined for each of these samples.The results are in the table that follows.
Referring to Scenario 19-5, construct a p control chart for these data.
Referring to Scenario 19-5, construct a p control chart for these data.
فتح الحزمة
افتح القفل للوصول البطاقات البالغ عددها 162 في هذه المجموعة.
فتح الحزمة
k this deck
44
The cause of variation that can be reduced only by changing the system is ______ cause variation.
فتح الحزمة
افتح القفل للوصول البطاقات البالغ عددها 162 في هذه المجموعة.
فتح الحزمة
k this deck
45
SCENARIO 19-5 A manufacturer of computer disks took samples of 240 disks on 15 consecutive days.The number of disks with bad sectors was determined for each of these samples.The results are in the table that follows.
Referring to Scenario 19-5, a p control chart is to be made for these data.The estimate of the standard error of the proportion of disks with bad sectors is __________.
Referring to Scenario 19-5, a p control chart is to be made for these data.The estimate of the standard error of the proportion of disks with bad sectors is __________.
فتح الحزمة
افتح القفل للوصول البطاقات البالغ عددها 162 في هذه المجموعة.
فتح الحزمة
k this deck
46
Changes in the system to reduce common cause variation are the responsibility of management.
فتح الحزمة
افتح القفل للوصول البطاقات البالغ عددها 162 في هذه المجموعة.
فتح الحزمة
k this deck
47
SCENARIO 19-5 A manufacturer of computer disks took samples of 240 disks on 15 consecutive days.The number of disks with bad sectors was determined for each of these samples.The results are in the table that follows.
Referring to Scenario 19-5, a p control chart is to be made for these data.The upper control limit is __________, and the lower control limit is __________.
Referring to Scenario 19-5, a p control chart is to be made for these data.The upper control limit is __________, and the lower control limit is __________.
فتح الحزمة
افتح القفل للوصول البطاقات البالغ عددها 162 في هذه المجموعة.
فتح الحزمة
k this deck
48
The p chart is a control chart used for monitoring the proportion of items that meet given specifications.
فتح الحزمة
افتح القفل للوصول البطاقات البالغ عددها 162 في هذه المجموعة.
فتح الحزمة
k this deck
49
SCENARIO 19-6 The maker of a packaged candy wants to evaluate the quality of her production process.On each of 16 consecutive days, she samples 600 bags of candy and determines the number in each day's sample that she considers to be of poor quality.The data that she developed follow.
Referring to Scenario 19-6, a p control chart is to be constructed for these data.The center line for the chart should be located at __________.
Referring to Scenario 19-6, a p control chart is to be constructed for these data.The center line for the chart should be located at __________.
فتح الحزمة
افتح القفل للوصول البطاقات البالغ عددها 162 في هذه المجموعة.
فتح الحزمة
k this deck
50
_______ causes of variation are correctable without modifying the system.
فتح الحزمة
افتح القفل للوصول البطاقات البالغ عددها 162 في هذه المجموعة.
فتح الحزمة
k this deck
51
SCENARIO 19-6 The maker of a packaged candy wants to evaluate the quality of her production process.On each of 16 consecutive days, she samples 600 bags of candy and determines the number in each day's sample that she considers to be of poor quality.The data that she developed follow.
Referring to Scenario 19-6, the estimate of the proportion of poor quality bags of candy is __________.
Referring to Scenario 19-6, the estimate of the proportion of poor quality bags of candy is __________.
فتح الحزمة
افتح القفل للوصول البطاقات البالغ عددها 162 في هذه المجموعة.
فتح الحزمة
k this deck
52
The purpose of a control chart is to eliminate common cause variation.
فتح الحزمة
افتح القفل للوصول البطاقات البالغ عددها 162 في هذه المجموعة.
فتح الحزمة
k this deck
53
Common causes of variation are correctable without modifying the system.
فتح الحزمة
افتح القفل للوصول البطاقات البالغ عددها 162 في هذه المجموعة.
فتح الحزمة
k this deck
54
Special or assignable causes of variation are signaled by individual fluctuations or patterns in the data.
فتح الحزمة
افتح القفل للوصول البطاقات البالغ عددها 162 في هذه المجموعة.
فتح الحزمة
k this deck
55
Common causes of variation represent variation due to the inherent variability in the system.
فتح الحزمة
افتح القفل للوصول البطاقات البالغ عددها 162 في هذه المجموعة.
فتح الحزمة
k this deck
56
In the United States, the control limits on a control chart are placed so that they are 3 standard deviations above and below a central line.
فتح الحزمة
افتح القفل للوصول البطاقات البالغ عددها 162 في هذه المجموعة.
فتح الحزمة
k this deck
57
It is not possible for the chart to be out-of-control when the R chart is in control.
chart to be out-of-control when the R chart is in control. فتح الحزمة
افتح القفل للوصول البطاقات البالغ عددها 162 في هذه المجموعة.
فتح الحزمة
k this deck
58
SCENARIO 19-5 A manufacturer of computer disks took samples of 240 disks on 15 consecutive days.The number of disks with bad sectors was determined for each of these samples.The results are in the table that follows.
Referring to Scenario 19-5, the best estimate of the mean proportion of disks with bad sectors is __________.
Referring to Scenario 19-5, the best estimate of the mean proportion of disks with bad sectors is __________.
فتح الحزمة
افتح القفل للوصول البطاقات البالغ عددها 162 في هذه المجموعة.
فتح الحزمة
k this deck
59
One of the morals of the red bead experiment is that variation is part of any process.
فتح الحزمة
افتح القفل للوصول البطاقات البالغ عددها 162 في هذه المجموعة.
فتح الحزمة
k this deck
60
SCENARIO 19-5 A manufacturer of computer disks took samples of 240 disks on 15 consecutive days.The number of disks with bad sectors was determined for each of these samples.The results are in the table that follows.
Referring to Scenario 19-5, the process seems to be in control.
Referring to Scenario 19-5, the process seems to be in control.
فتح الحزمة
افتح القفل للوصول البطاقات البالغ عددها 162 في هذه المجموعة.
فتح الحزمة
k this deck
61
SCENARIO 19-6 The maker of a packaged candy wants to evaluate the quality of her production process.On each of 16 consecutive days, she samples 600 bags of candy and determines the number in each day's sample that she considers to be of poor quality.The data that she developed follow.
Referring to Scenario 19-6, the process seems to be in control.
Referring to Scenario 19-6, the process seems to be in control.
فتح الحزمة
افتح القفل للوصول البطاقات البالغ عددها 162 في هذه المجموعة.
فتح الحزمة
k this deck
62
SCENARIO 19-7 A supplier of silicone sheets for producers of computer chips wants to evaluate her manufacturing process.She takes samples of size 5 from each day's output and counts the number of blemishes on each silicone sheet.The results from 20 days of such evaluations are presented below. She also decides that the upper specification limit is 10 blemishes.
Referring to Scenario 19-7, an R chart is to be constructed for the number of blemishes. One way to create the lower control limit involves multiplying the mean of the sample ranges by For this data set, the value of is ________.
She also decides that the upper specification limit is 10 blemishes.Referring to Scenario 19-7, an R chart is to be constructed for the number of blemishes. One way to create the lower control limit involves multiplying the mean of the sample ranges by
For this data set, the value of is ________. فتح الحزمة
افتح القفل للوصول البطاقات البالغ عددها 162 في هذه المجموعة.
فتح الحزمة
k this deck
63
SCENARIO 19-7 A supplier of silicone sheets for producers of computer chips wants to evaluate her manufacturing process.She takes samples of size 5 from each day's output and counts the number of blemishes on each silicone sheet.The results from 20 days of such evaluations are presented below. She also decides that the upper specification limit is 10 blemishes.
Referring to Scenario 19-7, an chart is to be used for the number of blemishes.One way to obtain the control limits is to take the grand mean and add and subtract the product of times the mean of the sample ranges.For this data set, the value of is ________.
She also decides that the upper specification limit is 10 blemishes.Referring to Scenario 19-7, an
chart is to be used for the number of blemishes.One way to obtain the control limits is to take the grand mean and add and subtract the product of times the mean of the sample ranges.For this data set, the value of is ________. فتح الحزمة
افتح القفل للوصول البطاقات البالغ عددها 162 في هذه المجموعة.
فتح الحزمة
k this deck
64
SCENARIO 19-7 A supplier of silicone sheets for producers of computer chips wants to evaluate her manufacturing process.She takes samples of size 5 from each day's output and counts the number of blemishes on each silicone sheet.The results from 20 days of such evaluations are presented below. She also decides that the upper specification limit is 10 blemishes.
Referring to Scenario 19-7, what is the value of the CPU index?
She also decides that the upper specification limit is 10 blemishes.Referring to Scenario 19-7, what is the value of the CPU index?
فتح الحزمة
افتح القفل للوصول البطاقات البالغ عددها 162 في هذه المجموعة.
فتح الحزمة
k this deck
65
SCENARIO 19-8 Recently, a university switched to a new type of computer-based registration.The registrar is concerned with the amount of time students are spending on the computer registering under the new system.She decides to randomly select 8 students on each of the 12 days of the registration and determine the time each spends on the computer registering.The range, mean, and standard deviation of the times required to register are in the table that follows.
Referring to Scenario 19-8, an R chart is to be constructed for the time required to register. The center line of this R chart is located at __________.
Referring to Scenario 19-8, an R chart is to be constructed for the time required to register. The center line of this R chart is located at __________.
فتح الحزمة
افتح القفل للوصول البطاقات البالغ عددها 162 في هذه المجموعة.
فتح الحزمة
k this deck
66
SCENARIO 19-7 A supplier of silicone sheets for producers of computer chips wants to evaluate her manufacturing process.She takes samples of size 5 from each day's output and counts the number of blemishes on each silicone sheet.The results from 20 days of such evaluations are presented below. She also decides that the upper specification limit is 10 blemishes.
Referring to Scenario 19-7, an R chart is to be constructed for the number of blemishes. The upper control limit for this data set is ________.
She also decides that the upper specification limit is 10 blemishes.Referring to Scenario 19-7, an R chart is to be constructed for the number of blemishes. The upper control limit for this data set is ________.
فتح الحزمة
افتح القفل للوصول البطاقات البالغ عددها 162 في هذه المجموعة.
فتح الحزمة
k this deck
67
SCENARIO 19-6 The maker of a packaged candy wants to evaluate the quality of her production process.On each of 16 consecutive days, she samples 600 bags of candy and determines the number in each day's sample that she considers to be of poor quality.The data that she developed follow.
Referring to Scenario 19-6, a p control chart is to be constructed for these data.The lower control limit is __________, while the upper control limit is __________.
Referring to Scenario 19-6, a p control chart is to be constructed for these data.The lower control limit is __________, while the upper control limit is __________.
فتح الحزمة
افتح القفل للوصول البطاقات البالغ عددها 162 في هذه المجموعة.
فتح الحزمة
k this deck
68
SCENARIO 19-7 A supplier of silicone sheets for producers of computer chips wants to evaluate her manufacturing process.She takes samples of size 5 from each day's output and counts the number of blemishes on each silicone sheet.The results from 20 days of such evaluations are presented below. She also decides that the upper specification limit is 10 blemishes.
Referring to Scenario 19-7, an chart is to be used for the number of blemishes.The center line of this chart is located at __________.
She also decides that the upper specification limit is 10 blemishes.Referring to Scenario 19-7, an
chart is to be used for the number of blemishes.The center line of this chart is located at __________. فتح الحزمة
افتح القفل للوصول البطاقات البالغ عددها 162 في هذه المجموعة.
فتح الحزمة
k this deck
69
SCENARIO 19-6 The maker of a packaged candy wants to evaluate the quality of her production process.On each of 16 consecutive days, she samples 600 bags of candy and determines the number in each day's sample that she considers to be of poor quality.The data that she developed follow.
Referring to Scenario 19-6, construct a p control chart for these data.
Referring to Scenario 19-6, construct a p control chart for these data.
فتح الحزمة
افتح القفل للوصول البطاقات البالغ عددها 162 في هذه المجموعة.
فتح الحزمة
k this deck
70
SCENARIO 19-7 A supplier of silicone sheets for producers of computer chips wants to evaluate her manufacturing process.She takes samples of size 5 from each day's output and counts the number of blemishes on each silicone sheet.The results from 20 days of such evaluations are presented below. She also decides that the upper specification limit is 10 blemishes.
Referring to Scenario 19-7, an R chart is to be constructed for the number of blemishes. The lower control limit for this data set is ________.
She also decides that the upper specification limit is 10 blemishes.Referring to Scenario 19-7, an R chart is to be constructed for the number of blemishes. The lower control limit for this data set is ________.
فتح الحزمة
افتح القفل للوصول البطاقات البالغ عددها 162 في هذه المجموعة.
فتح الحزمة
k this deck
71
SCENARIO 19-7 A supplier of silicone sheets for producers of computer chips wants to evaluate her manufacturing process.She takes samples of size 5 from each day's output and counts the number of blemishes on each silicone sheet.The results from 20 days of such evaluations are presented below. She also decides that the upper specification limit is 10 blemishes.
Referring to Scenario 19-7, based on the chart for the number of blemishes, it appears that the process is out of control.
She also decides that the upper specification limit is 10 blemishes.Referring to Scenario 19-7, based on the
chart for the number of blemishes, it appears that the process is out of control. فتح الحزمة
افتح القفل للوصول البطاقات البالغ عددها 162 في هذه المجموعة.
فتح الحزمة
k this deck
72
SCENARIO 19-7 A supplier of silicone sheets for producers of computer chips wants to evaluate her manufacturing process.She takes samples of size 5 from each day's output and counts the number of blemishes on each silicone sheet.The results from 20 days of such evaluations are presented below. She also decides that the upper specification limit is 10 blemishes.
Referring to Scenario 19-7, what percentage of the chips will fall below the upper specification limit?
She also decides that the upper specification limit is 10 blemishes.Referring to Scenario 19-7, what percentage of the chips will fall below the upper specification limit?
فتح الحزمة
افتح القفل للوصول البطاقات البالغ عددها 162 في هذه المجموعة.
فتح الحزمة
k this deck
73
SCENARIO 19-7 A supplier of silicone sheets for producers of computer chips wants to evaluate her manufacturing process.She takes samples of size 5 from each day's output and counts the number of blemishes on each silicone sheet.The results from 20 days of such evaluations are presented below. She also decides that the upper specification limit is 10 blemishes.
Referring to Scenario 19-7, an chart is to be used for the number of blemishes.The lower control limit for this data set is ________, while the upper control limit is ________.
She also decides that the upper specification limit is 10 blemishes.Referring to Scenario 19-7, an
chart is to be used for the number of blemishes.The lower control limit for this data set is ________, while the upper control limit is ________. فتح الحزمة
افتح القفل للوصول البطاقات البالغ عددها 162 في هذه المجموعة.
فتح الحزمة
k this deck
74
SCENARIO 19-6 The maker of a packaged candy wants to evaluate the quality of her production process.On each of 16 consecutive days, she samples 600 bags of candy and determines the number in each day's sample that she considers to be of poor quality.The data that she developed follow.
Referring to Scenario 19-6, a p control chart is to be constructed for these data.The estimate of the standard error of the sample proportion is __________.
Referring to Scenario 19-6, a p control chart is to be constructed for these data.The estimate of the standard error of the sample proportion is __________.
فتح الحزمة
افتح القفل للوصول البطاقات البالغ عددها 162 في هذه المجموعة.
فتح الحزمة
k this deck
75
SCENARIO 19-7 A supplier of silicone sheets for producers of computer chips wants to evaluate her manufacturing process.She takes samples of size 5 from each day's output and counts the number of blemishes on each silicone sheet.The results from 20 days of such evaluations are presented below. She also decides that the upper specification limit is 10 blemishes.
Referring to Scenario 19-7, an R chart is to be constructed for the number of blemishes. The center line of this R chart is located at __________.
She also decides that the upper specification limit is 10 blemishes.Referring to Scenario 19-7, an R chart is to be constructed for the number of blemishes. The center line of this R chart is located at __________.
فتح الحزمة
افتح القفل للوصول البطاقات البالغ عددها 162 في هذه المجموعة.
فتح الحزمة
k this deck
76
SCENARIO 19-7 A supplier of silicone sheets for producers of computer chips wants to evaluate her manufacturing process.She takes samples of size 5 from each day's output and counts the number of blemishes on each silicone sheet.The results from 20 days of such evaluations are presented below. She also decides that the upper specification limit is 10 blemishes.
Referring to Scenario 19-7, based on the R chart, it appears that the process is out of control.
She also decides that the upper specification limit is 10 blemishes.Referring to Scenario 19-7, based on the R chart, it appears that the process is out of control.
فتح الحزمة
افتح القفل للوصول البطاقات البالغ عددها 162 في هذه المجموعة.
فتح الحزمة
k this deck
77
SCENARIO 19-7 A supplier of silicone sheets for producers of computer chips wants to evaluate her manufacturing process.She takes samples of size 5 from each day's output and counts the number of blemishes on each silicone sheet.The results from 20 days of such evaluations are presented below. She also decides that the upper specification limit is 10 blemishes.
Referring to Scenario 19-7, what is the value of factor?
She also decides that the upper specification limit is 10 blemishes.Referring to Scenario 19-7, what is the value of
factor? فتح الحزمة
افتح القفل للوصول البطاقات البالغ عددها 162 في هذه المجموعة.
فتح الحزمة
k this deck
78
SCENARIO 19-7 A supplier of silicone sheets for producers of computer chips wants to evaluate her manufacturing process.She takes samples of size 5 from each day's output and counts the number of blemishes on each silicone sheet.The results from 20 days of such evaluations are presented below. She also decides that the upper specification limit is 10 blemishes.
Referring to Scenario 19-7, construct an chart for the number of blemishes.
She also decides that the upper specification limit is 10 blemishes.Referring to Scenario 19-7, construct an
chart for the number of blemishes. فتح الحزمة
افتح القفل للوصول البطاقات البالغ عددها 162 في هذه المجموعة.
فتح الحزمة
k this deck
79
SCENARIO 19-7 A supplier of silicone sheets for producers of computer chips wants to evaluate her manufacturing process.She takes samples of size 5 from each day's output and counts the number of blemishes on each silicone sheet.The results from 20 days of such evaluations are presented below. She also decides that the upper specification limit is 10 blemishes.
Referring to Scenario 19-7, an R chart is to be constructed for the number of blemishes. One way to create the upper control limit involves multiplying the mean of the sample ranges by For this data set, the value of is ________.
She also decides that the upper specification limit is 10 blemishes.Referring to Scenario 19-7, an R chart is to be constructed for the number of blemishes. One way to create the upper control limit involves multiplying the mean of the sample ranges by
For this data set, the value of is ________. فتح الحزمة
افتح القفل للوصول البطاقات البالغ عددها 162 في هذه المجموعة.
فتح الحزمة
k this deck
80
SCENARIO 19-7 A supplier of silicone sheets for producers of computer chips wants to evaluate her manufacturing process.She takes samples of size 5 from each day's output and counts the number of blemishes on each silicone sheet.The results from 20 days of such evaluations are presented below. She also decides that the upper specification limit is 10 blemishes.
Referring to Scenario 19-7, construct an R chart for the number of blemishes.
She also decides that the upper specification limit is 10 blemishes.Referring to Scenario 19-7, construct an R chart for the number of blemishes.
فتح الحزمة
افتح القفل للوصول البطاقات البالغ عددها 162 في هذه المجموعة.
فتح الحزمة
k this deck
فتح الحزمة
افتح القفل للوصول البطاقات البالغ عددها 162 في هذه المجموعة.


