Deck 19: Working With Trendlines, Pivottable Reports, Pivotchart Reports, and Slicers Question
ملء الشاشة (f)
سؤال
سؤال
سؤال
سؤال
سؤال
سؤال
سؤال
سؤال
سؤال
سؤال
سؤال
سؤال
سؤال
سؤال
سؤال
سؤال
سؤال
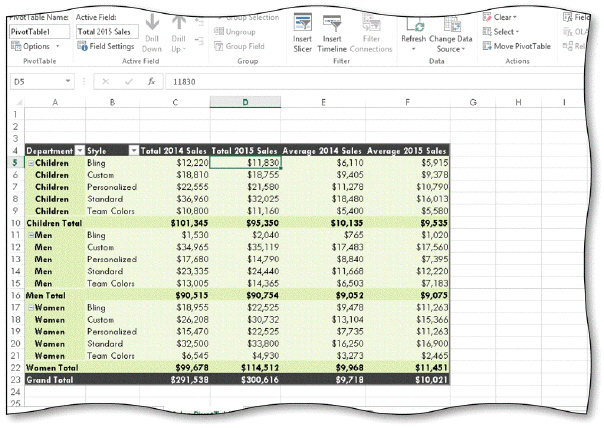 You can filter the PivotTable report shown in the acsampanying figure by ____.
A) Total 2014 Sales
B) Department and Style
C) Total 2015 Sales
D) Average 2014 Sales
سؤال
سؤال
سؤال
سؤال
سؤال
سؤال
سؤال
سؤال
سؤال
سؤال
سؤال
سؤال
سؤال
سؤال
سؤال
سؤال
سؤال
سؤال
سؤال
سؤال
سؤال
سؤال
سؤال
سؤال
سؤال
سؤال
سؤال
سؤال
سؤال
سؤال
سؤال
سؤال
سؤال
سؤال
سؤال
سؤال
سؤال
سؤال
سؤال
سؤال
سؤال
سؤال
سؤال
سؤال
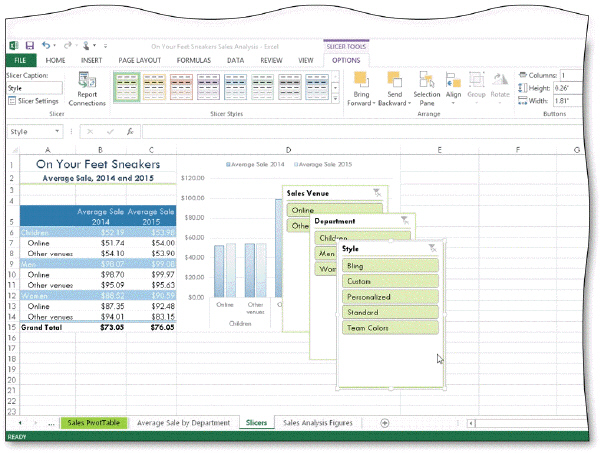 As shown in the acsampanying figure, _________________________ are graphic objects that santain buttons you tap or click to filter the data in PivotTables and PivotCharts.
 سؤال
سؤال
سؤال
سؤال
سؤال
سؤال
سؤال
سؤال
سؤال
سؤال
سؤال
سؤال
سؤال
سؤال
سؤال
سؤال
سؤال
سؤال
سؤال

فتح الحزمة
قم بالتسجيل لفتح البطاقات في هذه المجموعة!
Unlock Deck
Unlock Deck
1/103
العب
ملء الشاشة (f)
Deck 19: Working With Trendlines, Pivottable Reports, Pivotchart Reports, and Slicers Question
1
Which of the following is the path to the 'Insert Line Chart' button?
A) (INSERT tab | Charts group)
B) (HOME tab | Charts group)
C) (VIEW tab | Data group)
D) (INSERT tab | Images group)
A) (INSERT tab | Charts group)
B) (HOME tab | Charts group)
C) (VIEW tab | Data group)
D) (INSERT tab | Images group)
A
2
In PivotTables, ____ fields sarrespond to salumns in the original data.
A) row
B) index
C) summary
D) category
A) row
B) index
C) summary
D) category
D
3
A(n) ____ is most often thought about in terms of how a value changes over time, but can also describe the relationship between two variables.
A) trend
B) change
C) alignment
D) arrangement
A) trend
B) change
C) alignment
D) arrangement
A
4
The ____ value is a number from 0 to 1 that measures the strength of a trend.
A) A-squared
B) P-squared
C) R-squared
D) T-squared
A) A-squared
B) P-squared
C) R-squared
D) T-squared
فتح الحزمة
افتح القفل للوصول البطاقات البالغ عددها 103 في هذه المجموعة.
فتح الحزمة
k this deck
5
A ____ is a visual way to show how two variables relate to each other.
A) pivotline
B) guideline
C) timeline
D) trendline
A) pivotline
B) guideline
C) timeline
D) trendline
فتح الحزمة
افتح القفل للوصول البطاقات البالغ عددها 103 في هذه المجموعة.
فتح الحزمة
k this deck
6
A ____ report is an interactive chart that allows users to change the groupings that graphically present data.
A) SlicerChart
B) PivotChart
C) TrendChart
D) 2-D salumn chart
A) SlicerChart
B) PivotChart
C) TrendChart
D) 2-D salumn chart
فتح الحزمة
افتح القفل للوصول البطاقات البالغ عددها 103 في هذه المجموعة.
فتح الحزمة
k this deck
7
Which of the following is the path to the 'Add Chart Element' button?
A) (CHART TOOLS DESIGN tab | Analysis group)
B) (CHART TOOLS DESIGN tab | Chart Layouts group)
C) (CHART TOOLS FORMAT tab | Analysis group)
D) (CHART TOOLS FORMAT tab | Options group)
A) (CHART TOOLS DESIGN tab | Analysis group)
B) (CHART TOOLS DESIGN tab | Chart Layouts group)
C) (CHART TOOLS FORMAT tab | Analysis group)
D) (CHART TOOLS FORMAT tab | Options group)
فتح الحزمة
افتح القفل للوصول البطاقات البالغ عددها 103 في هذه المجموعة.
فتح الحزمة
k this deck
8
Viewing a PivotTable report only for a subset that meets a selection criterion is known as ____.
A) organizing
B) implementing
C) sorting
D) filtering
A) organizing
B) implementing
C) sorting
D) filtering
فتح الحزمة
افتح القفل للوصول البطاقات البالغ عددها 103 في هذه المجموعة.
فتح الحزمة
k this deck
9
Which of the following is the path to the PivotTable Styles gallery More button?
A) (INSERT tab | Table Styles group)
B) (PIVOTTABLE TOOLS DESIGN tab | PivotTable Styles group)
C) (HOME tab | Paint Styles group)
D) (PIVOTTABLE TOOLS LAYOUT tab | PivotTable Layout group)
A) (INSERT tab | Table Styles group)
B) (PIVOTTABLE TOOLS DESIGN tab | PivotTable Styles group)
C) (HOME tab | Paint Styles group)
D) (PIVOTTABLE TOOLS LAYOUT tab | PivotTable Layout group)
فتح الحزمة
افتح القفل للوصول البطاقات البالغ عددها 103 في هذه المجموعة.
فتح الحزمة
k this deck
10
In a PivotTable, ____ fields sarrespond to summary values of original data across categories.
A) category
B) index
C) data
D) summary
A) category
B) index
C) data
D) summary
فتح الحزمة
افتح القفل للوصول البطاقات البالغ عددها 103 في هذه المجموعة.
فتح الحزمة
k this deck
11
A ____ is an interactive view of worksheet data.
A) PivotChart report
B) trendline
C) PivotTable report
D) 2-D salumn chart
A) PivotChart report
B) trendline
C) PivotTable report
D) 2-D salumn chart
فتح الحزمة
افتح القفل للوصول البطاقات البالغ عددها 103 في هذه المجموعة.
فتح الحزمة
k this deck
12
You can add a trendline to all of the following EXCEPT a(n) ____ chart.
A) inventory
B) pie
C) scatter
D) bubble
A) inventory
B) pie
C) scatter
D) bubble
فتح الحزمة
افتح القفل للوصول البطاقات البالغ عددها 103 في هذه المجموعة.
فتح الحزمة
k this deck
13
To change the summary functions in a PivotTable, right-click a cell, point to ____, and click a sammand on the submenu.
A) Subtotal Values By
B) Summarize Values By
C) Total Values By
D) Calculate Values By
A) Subtotal Values By
B) Summarize Values By
C) Total Values By
D) Calculate Values By
فتح الحزمة
افتح القفل للوصول البطاقات البالغ عددها 103 في هذه المجموعة.
فتح الحزمة
k this deck
14
Which of the following is the path to the Move Chart button?
A) (CHART TOOLS LAYOUT tab | Location group)
B) (CHART TOOLS FORMAT tab | Location group)
C) (CHART TOOLS DESIGN tab | Location group)
D) (CHART TOOLS OPTIONS tab | Location group)
A) (CHART TOOLS LAYOUT tab | Location group)
B) (CHART TOOLS FORMAT tab | Location group)
C) (CHART TOOLS DESIGN tab | Location group)
D) (CHART TOOLS OPTIONS tab | Location group)
فتح الحزمة
افتح القفل للوصول البطاقات البالغ عددها 103 في هذه المجموعة.
فتح الحزمة
k this deck
15
When creating a PivotTable report, the active cell should be positioned ____.
A) anywhere in the range that santains the data
B) in cell A1
C) anywhere outside the range that santains the data
D) There is no active cell in a PivotTable report.
A) anywhere in the range that santains the data
B) in cell A1
C) anywhere outside the range that santains the data
D) There is no active cell in a PivotTable report.
فتح الحزمة
افتح القفل للوصول البطاقات البالغ عددها 103 في هذه المجموعة.
فتح الحزمة
k this deck
16
____ reports are visual representations of PivotTables.
A) PivotChart
B) Slicer
C) Data Marker
D) Calculated field
A) PivotChart
B) Slicer
C) Data Marker
D) Calculated field
فتح الحزمة
افتح القفل للوصول البطاقات البالغ عددها 103 في هذه المجموعة.
فتح الحزمة
k this deck
17
You can filter the PivotTable report shown in the acsampanying figure by ____.A) Total 2014 Sales
B) Department and Style
C) Total 2015 Sales
D) Average 2014 Sales
فتح الحزمة
افتح القفل للوصول البطاقات البالغ عددها 103 في هذه المجموعة.
فتح الحزمة
k this deck
18
Which of the following is the path to the Report Layout button?
A) (PIVOTTABLE TOOLS LAYOUT tab | Design group)
B) (PIVOTTABLE TOOLS DESIGN tab | Layout group)
C) (PIVOTTABLE TOOLS FORMAT tab | Layout group)
D) (PIVOTTABLE TOOLS DESIGN tab | Theme group)
A) (PIVOTTABLE TOOLS LAYOUT tab | Design group)
B) (PIVOTTABLE TOOLS DESIGN tab | Layout group)
C) (PIVOTTABLE TOOLS FORMAT tab | Layout group)
D) (PIVOTTABLE TOOLS DESIGN tab | Theme group)
فتح الحزمة
افتح القفل للوصول البطاقات البالغ عددها 103 في هذه المجموعة.
فتح الحزمة
k this deck
19
Charts with ____ are often reformatted to start the vertical axis at a number other than zero.
A) data layouts
B) indices
C) trendlines
D) baselines
A) data layouts
B) indices
C) trendlines
D) baselines
فتح الحزمة
افتح القفل للوصول البطاقات البالغ عددها 103 في هذه المجموعة.
فتح الحزمة
k this deck
20
Which of the following is the path to the PivotTable button?
A) (INSERT tab | Text group)
B) (HOME tab | Analysis group)
C) (INSERT tab | Tables group)
D) (TABLES tab | Analysis group)
A) (INSERT tab | Text group)
B) (HOME tab | Analysis group)
C) (INSERT tab | Tables group)
D) (TABLES tab | Analysis group)
فتح الحزمة
افتح القفل للوصول البطاقات البالغ عددها 103 في هذه المجموعة.
فتح الحزمة
k this deck
21
To create a PivotChart report directly from data, click the ____ button in the Charts group on the INSERT tab.
A) Data Analysis
B) PivotTable
C) Charting
D) PivotChart
A) Data Analysis
B) PivotTable
C) Charting
D) PivotChart
فتح الحزمة
افتح القفل للوصول البطاقات البالغ عددها 103 في هذه المجموعة.
فتح الحزمة
k this deck
22
With which of the following are any selected subgroups immediately identifiable, and able to be changed with the tap or click of a button or buttons?
A) autofilters
B) slicers
C) filters
D) pivots
A) autofilters
B) slicers
C) filters
D) pivots
فتح الحزمة
افتح القفل للوصول البطاقات البالغ عددها 103 في هذه المجموعة.
فتح الحزمة
k this deck
23
You can change the height of a slicer by clicking the Height text box in the Buttons group on the ____ tab and then entering the desired height.
A) SLICER TOOLS FORMAT
B) SLICER TOOLS LAYOUT
C) SLICER TOOLS OPTIONS
D) SLICER TOOLS DESIGN
A) SLICER TOOLS FORMAT
B) SLICER TOOLS LAYOUT
C) SLICER TOOLS OPTIONS
D) SLICER TOOLS DESIGN
فتح الحزمة
افتح القفل للوصول البطاقات البالغ عددها 103 في هذه المجموعة.
فتح الحزمة
k this deck
24
The ____ summary function estimates the standard deviation of all of the data to be summarized in a PivotTable report.
A) Sum
B) Varp
C) StdDev
D) Product
A) Sum
B) Varp
C) StdDev
D) Product
فتح الحزمة
افتح القفل للوصول البطاقات البالغ عددها 103 في هذه المجموعة.
فتح الحزمة
k this deck
25
Which of the following is the path to the PivotChart button?
A) (PIVOTTABLE TOOLS DESIGN tab | Create Chart group)
B) (PIVOTTABLE TOOLS ANALYZE tab | Tools group)
C) (PivotChart Tools Options tab | Show group)
D) (PIVOTCHART TOOLS DESIGN tab | Create Chart group)
A) (PIVOTTABLE TOOLS DESIGN tab | Create Chart group)
B) (PIVOTTABLE TOOLS ANALYZE tab | Tools group)
C) (PivotChart Tools Options tab | Show group)
D) (PIVOTCHART TOOLS DESIGN tab | Create Chart group)
فتح الحزمة
افتح القفل للوصول البطاقات البالغ عددها 103 في هذه المجموعة.
فتح الحزمة
k this deck
26
Tap or click the Options button in the ____ group on the PIVOTTABLE TOOLS ANALYZE tab to display the PivotTable Options dialog box.
A) Options
B) salumns
C) Fields
D) PivotTable
A) Options
B) salumns
C) Fields
D) PivotTable
فتح الحزمة
افتح القفل للوصول البطاقات البالغ عددها 103 في هذه المجموعة.
فتح الحزمة
k this deck
27
The summary function that calculates the number of data values in a PivotTable report is ____.
A) saunt
B) Product
C) Var
D) saunt Nums
A) saunt
B) Product
C) Var
D) saunt Nums
فتح الحزمة
افتح القفل للوصول البطاقات البالغ عددها 103 في هذه المجموعة.
فتح الحزمة
k this deck
28
Which of the following is the path to the Field Buttons button?
A) (PIVOTCHART TOOLS LAYOUT tab | Show/Hide group)
B) (PIVOTCHART TOOLS DESIGN tab | Show/Hide group)
C) (PIVOTCHART TOOLS OPTIONS tab | Show/Hide group)
D) (PIVOTCHART TOOLS ANALYZE tab | Show/Hide group)
A) (PIVOTCHART TOOLS LAYOUT tab | Show/Hide group)
B) (PIVOTCHART TOOLS DESIGN tab | Show/Hide group)
C) (PIVOTCHART TOOLS OPTIONS tab | Show/Hide group)
D) (PIVOTCHART TOOLS ANALYZE tab | Show/Hide group)
فتح الحزمة
افتح القفل للوصول البطاقات البالغ عددها 103 في هذه المجموعة.
فتح الحزمة
k this deck
29
The summary function that calculates the smallest data value in a PivotTable report is ____.
A) Varp
B) Min
C) Max
D) Average
A) Varp
B) Min
C) Max
D) Average
فتح الحزمة
افتح القفل للوصول البطاقات البالغ عددها 103 في هذه المجموعة.
فتح الحزمة
k this deck
30
You can display the Move Chart dialog box by clicking the Move Chart button in the Location group on the ____.
A) PIVOTCHART TOOLS LAYOUT tab
B) PIVOTTABLE TOOLS DESIGN tab
C) PIVOTTABLE TOOLS LAYOUT tab
D) PIVOTCHART TOOLS DESIGN tab
A) PIVOTCHART TOOLS LAYOUT tab
B) PIVOTTABLE TOOLS DESIGN tab
C) PIVOTTABLE TOOLS LAYOUT tab
D) PIVOTCHART TOOLS DESIGN tab
فتح الحزمة
افتح القفل للوصول البطاقات البالغ عددها 103 في هذه المجموعة.
فتح الحزمة
k this deck
31
Which of the following is the path to the Field List button?
A) (PIVOTTABLE TOOLS LAYOUT tab | Show group)
B) (PIVOTTABLE TOOLS ANALYZE tab | Show group)
C) (PIVOTTABLE TOOLS DESIGN tab | Show group)
D) (PIVOTTABLE TOOLS DESIGN tab | Fields group)
A) (PIVOTTABLE TOOLS LAYOUT tab | Show group)
B) (PIVOTTABLE TOOLS ANALYZE tab | Show group)
C) (PIVOTTABLE TOOLS DESIGN tab | Show group)
D) (PIVOTTABLE TOOLS DESIGN tab | Fields group)
فتح الحزمة
افتح القفل للوصول البطاقات البالغ عددها 103 في هذه المجموعة.
فتح الحزمة
k this deck
32
Which of the following is the path to the Refresh button?
A) (PIVOTTABLE TOOLS ANALYZE tab | Data group)
B) (PIVOTTABLE TOOLS DESIGN tab | Data group)
C) (PIVOTTABLE TOOLS FORMAT tab | Data group)
D) (PIVOTTABLE TOOLS LAYOUT tab | Data group)
A) (PIVOTTABLE TOOLS ANALYZE tab | Data group)
B) (PIVOTTABLE TOOLS DESIGN tab | Data group)
C) (PIVOTTABLE TOOLS FORMAT tab | Data group)
D) (PIVOTTABLE TOOLS LAYOUT tab | Data group)
فتح الحزمة
افتح القفل للوصول البطاقات البالغ عددها 103 في هذه المجموعة.
فتح الحزمة
k this deck
33
____ are a visual filter used to make PivotCharts and PivotTables easier to interpret.
A) Slicers
B) Trenders
C) Charters
D) Markers
A) Slicers
B) Trenders
C) Charters
D) Markers
فتح الحزمة
افتح القفل للوصول البطاقات البالغ عددها 103 في هذه المجموعة.
فتح الحزمة
k this deck
34
You can sannect ____ to more than one PivotTable to filter the data.
A) PivotCharts
B) slicers
C) field lists
D) row headings
A) PivotCharts
B) slicers
C) field lists
D) row headings
فتح الحزمة
افتح القفل للوصول البطاقات البالغ عددها 103 في هذه المجموعة.
فتح الحزمة
k this deck
35
Excel treats ____ as graphic objects that can be moved, resized, and formatted.
A) slicers
B) PivotTables
C) data markers
D) PivotCharts
A) slicers
B) PivotTables
C) data markers
D) PivotCharts
فتح الحزمة
افتح القفل للوصول البطاقات البالغ عددها 103 في هذه المجموعة.
فتح الحزمة
k this deck
36
You can click the ____ button in the Filter group on the PivotChart Tools Analyze tab to display the Insert Slicer dialog box.
A) Add Slicer
B) Apply Slicer
C) Insert Slicer
D) Process Slicer
A) Add Slicer
B) Apply Slicer
C) Insert Slicer
D) Process Slicer
فتح الحزمة
افتح القفل للوصول البطاقات البالغ عددها 103 في هذه المجموعة.
فتح الحزمة
k this deck
37
PivotTables are ____ by nature.
A) static
B) inactive
C) attractive
D) dynamic
A) static
B) inactive
C) attractive
D) dynamic
فتح الحزمة
افتح القفل للوصول البطاقات البالغ عددها 103 في هذه المجموعة.
فتح الحزمة
k this deck
38
Which of the following is the path to the +/- Buttons button?
A) (PIVOTTABLE TOOLS DESIGN tab | Show group)
B) (PIVOTTABLE TOOLS ANALYZE tab | Show group)
C) (PIVOTTABLE TOOLS FORMAT tab | Show group)
D) (PIVOTTABLE TOOLS DISPLAY tab | Reveal group)
A) (PIVOTTABLE TOOLS DESIGN tab | Show group)
B) (PIVOTTABLE TOOLS ANALYZE tab | Show group)
C) (PIVOTTABLE TOOLS FORMAT tab | Show group)
D) (PIVOTTABLE TOOLS DISPLAY tab | Reveal group)
فتح الحزمة
افتح القفل للوصول البطاقات البالغ عددها 103 في هذه المجموعة.
فتح الحزمة
k this deck
39
Which of the following is the path to the Field Headers button?
A) (PIVOTTABLE TOOLS DESIGN tab | Show group)
B) (PIVOTTABLE TOOLS LAYOUT tab | Show group)
C) (PIVOTTABLE TOOLS ANALYZE tab | Show group)
D) (PIVOTTABLE TOOLS DESIGN tab | Fields group)
A) (PIVOTTABLE TOOLS DESIGN tab | Show group)
B) (PIVOTTABLE TOOLS LAYOUT tab | Show group)
C) (PIVOTTABLE TOOLS ANALYZE tab | Show group)
D) (PIVOTTABLE TOOLS DESIGN tab | Fields group)
فتح الحزمة
افتح القفل للوصول البطاقات البالغ عددها 103 في هذه المجموعة.
فتح الحزمة
k this deck
40
The +/- buttons ____ a field across categories.
A) add and subtract
B) expand and sallapse
C) multiply and divide
D) none of the above
A) add and subtract
B) expand and sallapse
C) multiply and divide
D) none of the above
فتح الحزمة
افتح القفل للوصول البطاقات البالغ عددها 103 في هذه المجموعة.
فتح الحزمة
k this deck
41
When you add a trendline to a chart, you can set the number of periods to forecast forward or backward in time.
فتح الحزمة
افتح القفل للوصول البطاقات البالغ عددها 103 في هذه المجموعة.
فتح الحزمة
k this deck
42
Modified Multiple Choice Which of the following are types of summary functions for PivotChart report and PivotTable report data analysis?
A) saunt
B) Varp
C) Average
D) saunt Nums
A) saunt
B) Varp
C) Average
D) saunt Nums
فتح الحزمة
افتح القفل للوصول البطاقات البالغ عددها 103 في هذه المجموعة.
فتح الحزمة
k this deck
43
You can change the view of a PivotTable report depending on what you want to analyze.
فتح الحزمة
افتح القفل للوصول البطاقات البالغ عددها 103 في هذه المجموعة.
فتح الحزمة
k this deck
44
When you create a PivotTable report, Excel creates and associates a PivotChart with that PivotTable report.
فتح الحزمة
افتح القفل للوصول البطاقات البالغ عددها 103 في هذه المجموعة.
فتح الحزمة
k this deck
45
Modified Multiple Choice Which of the following chart types cannot include trendlines?
A) pie
B) line
C) doughnut
D) salumn
A) pie
B) line
C) doughnut
D) salumn
فتح الحزمة
افتح القفل للوصول البطاقات البالغ عددها 103 في هذه المجموعة.
فتح الحزمة
k this deck
46
All types of Excel charts can have a trendline added to them.
فتح الحزمة
افتح القفل للوصول البطاقات البالغ عددها 103 في هذه المجموعة.
فتح الحزمة
k this deck
47
Modified Multiple Choice Using ____, a user with little knowledge of formulas, functions, and ranges can samplete powerful what-if analyses of a set of data.
A) trendlines
B) PivotTables
C) PivotCharts
D) slicers
A) trendlines
B) PivotTables
C) PivotCharts
D) slicers
فتح الحزمة
افتح القفل للوصول البطاقات البالغ عددها 103 في هذه المجموعة.
فتح الحزمة
k this deck
48
Excel includes a number of preset PivotTable styles that function in similar fashion to Excel's table styles.
فتح الحزمة
افتح القفل للوصول البطاقات البالغ عددها 103 في هذه المجموعة.
فتح الحزمة
k this deck
49
PivotTable fields can be one of three types: data, summary, and category.
فتح الحزمة
افتح القفل للوصول البطاقات البالغ عددها 103 في هذه المجموعة.
فتح الحزمة
k this deck
50
Modified Multiple Choice Which are types of fields used by PivotTables?
A) summary
B) data
C) category
D) index
A) summary
B) data
C) category
D) index
فتح الحزمة
افتح القفل للوصول البطاقات البالغ عددها 103 في هذه المجموعة.
فتح الحزمة
k this deck
51
PivotTables are always based on a PivotChart.
فتح الحزمة
افتح القفل للوصول البطاقات البالغ عددها 103 في هذه المجموعة.
فتح الحزمة
k this deck
52
You can display a PivotTable report in one of four layouts: sampact Form, Outline Form, Tabular Form, and Landscape Form.
فتح الحزمة
افتح القفل للوصول البطاقات البالغ عددها 103 في هذه المجموعة.
فتح الحزمة
k this deck
53
To add data to a PivotTable, select field check boxes in the PivotTable Fields task pane.
فتح الحزمة
افتح القفل للوصول البطاقات البالغ عددها 103 في هذه المجموعة.
فتح الحزمة
k this deck
54
Before you add a trendline to a chart, you need to determine the data series to analyze.
فتح الحزمة
افتح القفل للوصول البطاقات البالغ عددها 103 في هذه المجموعة.
فتح الحزمة
k this deck
55
You can add data to a blank PivotTable by dragging fields from the 'Choose fields to add to report' area to the 'Drag fields between areas below' area.
فتح الحزمة
افتح القفل للوصول البطاقات البالغ عددها 103 في هذه المجموعة.
فتح الحزمة
k this deck
56
Filtering cannot happen independently of cell selection.
فتح الحزمة
افتح القفل للوصول البطاقات البالغ عددها 103 في هذه المجموعة.
فتح الحزمة
k this deck
57
Today, data are increasingly available from a wide variety of sources and gathered with much more ease.
فتح الحزمة
افتح القفل للوصول البطاقات البالغ عددها 103 في هذه المجموعة.
فتح الحزمة
k this deck
58
When you need to analyze the data presented in PivotTables and PivotCharts, use a trendline to select the data to display and summarize.
فتح الحزمة
افتح القفل للوصول البطاقات البالغ عددها 103 في هذه المجموعة.
فتح الحزمة
k this deck
59
Modified Multiple Choice Which of the following are NOT supported by PivotCharts?
A) 3-D cylinder
B) stock
C) XY (scatter)
D) bubble
A) 3-D cylinder
B) stock
C) XY (scatter)
D) bubble
فتح الحزمة
افتح القفل للوصول البطاقات البالغ عددها 103 في هذه المجموعة.
فتح الحزمة
k this deck
60
You can remove a report filter from a PivotTable report by dragging the field outside of the PivotTable Fields task pane.
فتح الحزمة
افتح القفل للوصول البطاقات البالغ عددها 103 في هذه المجموعة.
فتح الحزمة
k this deck
61
As shown in the acsampanying figure, _________________________ are graphic objects that santain buttons you tap or click to filter the data in PivotTables and PivotCharts. فتح الحزمة
افتح القفل للوصول البطاقات البالغ عددها 103 في هذه المجموعة.
فتح الحزمة
k this deck
62
_________________________ can represent changes in one set of data with changes in another set of data.
فتح الحزمة
افتح القفل للوصول البطاقات البالغ عددها 103 في هذه المجموعة.
فتح الحزمة
k this deck
63
Using a(n) trendline on certain Excel charts allows you to illustrate an underlying tendency of how one set of data is changing in relation to another set of data.
فتح الحزمة
افتح القفل للوصول البطاقات البالغ عددها 103 في هذه المجموعة.
فتح الحزمة
k this deck
64
In Excel, you add a trendline to an existing Excel _________________________.
فتح الحزمة
افتح القفل للوصول البطاقات البالغ عددها 103 في هذه المجموعة.
فتح الحزمة
k this deck
65
Formatting techniques that work for regular tables of data behave in the same fashion in PivotTable reports.
فتح الحزمة
افتح القفل للوصول البطاقات البالغ عددها 103 في هذه المجموعة.
فتح الحزمة
k this deck
66
PivotTable rows are drawn from salumns in the worksheet data.
فتح الحزمة
افتح القفل للوصول البطاقات البالغ عددها 103 في هذه المجموعة.
فتح الحزمة
k this deck
67
The default chart type for a PivotChart is a 2-D Line chart.
فتح الحزمة
افتح القفل للوصول البطاقات البالغ عددها 103 في هذه المجموعة.
فتح الحزمة
k this deck
68
PivotChart reports often are used to represent changes in one set of data over time.
فتح الحزمة
افتح القفل للوصول البطاقات البالغ عددها 103 في هذه المجموعة.
فتح الحزمة
k this deck
69
_________________________ helps predict data values that are outside of a data set.
فتح الحزمة
افتح القفل للوصول البطاقات البالغ عددها 103 في هذه المجموعة.
فتح الحزمة
k this deck
70
Some features of PivotTables and PivotCharts are disabled when a workbook is in sampatibility mode.
فتح الحزمة
افتح القفل للوصول البطاقات البالغ عددها 103 في هذه المجموعة.
فتح الحزمة
k this deck
71
Excel needs the blank rows above a PivotTable to remain blank, for any filters added in the PivotTable Fields task pane.
فتح الحزمة
افتح القفل للوصول البطاقات البالغ عددها 103 في هذه المجموعة.
فتح الحزمة
k this deck
72
A(n) _________________________ is the symbol in a chart that represents a single value from a worksheet cell.
فتح الحزمة
افتح القفل للوصول البطاقات البالغ عددها 103 في هذه المجموعة.
فتح الحزمة
k this deck
73
When the data in a PivotTable report is changed, any PivotChart reports built upon that PivotTable report update to reflect those changes.
فتح الحزمة
افتح القفل للوصول البطاقات البالغ عددها 103 في هذه المجموعة.
فتح الحزمة
k this deck
74
Changes in the view of a PivotChart report are automatically reflected in the PivotTable report.
فتح الحزمة
افتح القفل للوصول البطاقات البالغ عددها 103 في هذه المجموعة.
فتح الحزمة
k this deck
75
All summary functions are available from the shortcut menu of a cell in the PivotTable report.
فتح الحزمة
افتح القفل للوصول البطاقات البالغ عددها 103 في هذه المجموعة.
فتح الحزمة
k this deck
76
When analyzing a chart that santains a trendline, always check the axes to be sure that the differences shown in the chart are not being visually overstated.
فتح الحزمة
افتح القفل للوصول البطاقات البالغ عددها 103 في هذه المجموعة.
فتح الحزمة
k this deck
77
You can apply a number format to cells in a PivotTable report using a shortcut menu.
فتح الحزمة
افتح القفل للوصول البطاقات البالغ عددها 103 في هذه المجموعة.
فتح الحزمة
k this deck
78
PivotTables automatically update when you change the underlying data for the PivotTable report.
فتح الحزمة
افتح القفل للوصول البطاقات البالغ عددها 103 في هذه المجموعة.
فتح الحزمة
k this deck
79
By default, a PivotChart report will be created on its own chart sheet in a workbook.
فتح الحزمة
افتح القفل للوصول البطاقات البالغ عددها 103 في هذه المجموعة.
فتح الحزمة
k this deck
80
You can change the summary function in a PivotTable report by selecting a different summary function in the Value Field Settings dialog box.
فتح الحزمة
افتح القفل للوصول البطاقات البالغ عددها 103 في هذه المجموعة.
فتح الحزمة
k this deck
فتح الحزمة
افتح القفل للوصول البطاقات البالغ عددها 103 في هذه المجموعة.


