Deck 19: Questions that Involve Online Topics
ملء الشاشة (f)
سؤال
سؤال
سؤال
سؤال
سؤال
سؤال
سؤال
سؤال
سؤال
سؤال
سؤال
سؤال
سؤال
سؤال
سؤال
سؤال
سؤال
سؤال
سؤال
سؤال
سؤال
سؤال
سؤال
سؤال
سؤال
سؤال
سؤال
سؤال
سؤال
سؤال
سؤال
سؤال
سؤال
سؤال
سؤال
سؤال
سؤال
سؤال
سؤال
سؤال
سؤال
سؤال
سؤال
سؤال
سؤال
سؤال
سؤال
سؤال
سؤال
سؤال
سؤال
سؤال
سؤال
سؤال
سؤال
سؤال
The finite population correction factor is
A)
B)
C)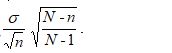
D)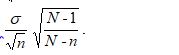
A)
B)
C)
D)
سؤال
سؤال
سؤال
سؤال
سؤال
سؤال
سؤال
سؤال
سؤال
سؤال
سؤال
سؤال
سؤال
سؤال
سؤال
سؤال
سؤال
سؤال
سؤال
سؤال
سؤال
سؤال
سؤال
سؤال

فتح الحزمة
قم بالتسجيل لفتح البطاقات في هذه المجموعة!
Unlock Deck
Unlock Deck
1/321
العب
ملء الشاشة (f)
Deck 19: Questions that Involve Online Topics
1
One of the reasons that a correction for continuity adjustment is needed when approximating the binomial distribution with a normal distribution is because a random variable having a binomial distribution can have only a specified value while a random variable having a normal distribution can take on any values within an interval around that specified value.
True
2
If a new machine of a production plant is functioning properly, only 1% of the items produced will be defective. Out of the 1,000 items the plant produces on a single day, the approximate probability that no more than 0.2% of the items will be defective if the new machine is indeed functioning properly is ________.
0.002769
3
If a new machine of a production plant is functioning properly, only 1% of the items produced will be defective. Out of the 1,000 items the plant produces on a single day, the approximate probability that exactly 0.2% of the items will be defective if the new machine is indeed functioning properly is ________.
0.002270
4
One of the reasons that a correction for continuity adjustment is needed when approximating the binomial distribution with a normal distribution is because the normal distribution is used for a discrete random variable while the binomial distribution is used for a continuous random variable.
فتح الحزمة
افتح القفل للوصول البطاقات البالغ عددها 321 في هذه المجموعة.
فتح الحزمة
k this deck
5
Based on past experience, only 0.5% of the invoices of a company contain an error. Out of the 1,500 invoices that the company will issue, what is the approximate probability that exactly 2 invoices will contain an error?
فتح الحزمة
افتح القفل للوصول البطاقات البالغ عددها 321 في هذه المجموعة.
فتح الحزمة
k this deck
6
When you use the Poisson distribution to approximate the binomial distribution, the standard deviation is nπ where n is the sample size and π is the probability of an event of interest.
فتح الحزمة
افتح القفل للوصول البطاقات البالغ عددها 321 في هذه المجموعة.
فتح الحزمة
k this deck
7
You can use the Poisson distribution to approximate the binomial distribution when the sample size is large and the probability of an event of interest is very small.
فتح الحزمة
افتح القفل للوصول البطاقات البالغ عددها 321 في هذه المجموعة.
فتح الحزمة
k this deck
8
When you use the Poisson distribution to approximate the binomial distribution, the mean is nπ where n is the sample size and π is the probability of an event of interest.
فتح الحزمة
افتح القفل للوصول البطاقات البالغ عددها 321 في هذه المجموعة.
فتح الحزمة
k this deck
9
Based on past experience, only 0.5% of the invoices of a company contain an error. Out of the 1,500 invoices that the company will issue, what is the approximate probability that less than 4 invoices will contain an error?
فتح الحزمة
افتح القفل للوصول البطاقات البالغ عددها 321 في هذه المجموعة.
فتح الحزمة
k this deck
10
When you use the Poisson distribution to approximate the binomial distribution, the number of events of interest can be larger than the sample size.
فتح الحزمة
افتح القفل للوصول البطاقات البالغ عددها 321 في هذه المجموعة.
فتح الحزمة
k this deck
11
If a new machine of a production plant is functioning properly, only 1% of the items produced will be defective. Out of the 1,000 items the plant produces on a single day, the approximate probability that less than 0.2% of the items will be defective if the new machine is indeed functioning properly is ________.
فتح الحزمة
افتح القفل للوصول البطاقات البالغ عددها 321 في هذه المجموعة.
فتح الحزمة
k this deck
12
If a new machine of a production plant is functioning properly, only 1% of the items produced will be defective. Out of the 1,000 items the plant produces on a single day, the approximate probability that none of the items will be defective if the new machine is indeed functioning properly is ________.
فتح الحزمة
افتح القفل للوصول البطاقات البالغ عددها 321 في هذه المجموعة.
فتح الحزمة
k this deck
13
One of the reasons that a correction for continuity adjustment is needed when approximating the binomial distribution with a normal distribution is because the probability of getting a specific value of a random variable is zero with the normal distribution.
فتح الحزمة
افتح القفل للوصول البطاقات البالغ عددها 321 في هذه المجموعة.
فتح الحزمة
k this deck
14
Based on past experience, only 0.5% of the invoices of a company contain an error. Out of the 1,500 invoices that the company will issue, what is the approximate probability that more than 4 invoices will contain an error?
فتح الحزمة
افتح القفل للوصول البطاقات البالغ عددها 321 في هذه المجموعة.
فتح الحزمة
k this deck
15
Based on past experience, only 0.5% of the invoices of a company contain an error. Out of the 1,500 invoices that the company will issue, what is the approximate probability that at least 4 invoices will contain an error?
فتح الحزمة
افتح القفل للوصول البطاقات البالغ عددها 321 في هذه المجموعة.
فتح الحزمة
k this deck
16
Based on past experience, only 0.5% of the invoices of a company contain an error. Out of the 1,500 invoices that the company will issue, what is the approximate probability that no more than 4 invoices will contain an error?
فتح الحزمة
افتح القفل للوصول البطاقات البالغ عددها 321 في هذه المجموعة.
فتح الحزمة
k this deck
17
If a new machine of a production plant is functioning properly, only 1% of the items produced will be defective. Out of the 1,000 items the plant produces on a single day, the approximate probability that at least 0.2% of the items will be defective if the new machine is indeed functioning properly is ________.
فتح الحزمة
افتح القفل للوصول البطاقات البالغ عددها 321 في هذه المجموعة.
فتح الحزمة
k this deck
18
If a new machine of a production plant is functioning properly, only 1% of the items produced will be defective. Out of the 1,000 items the plant produces on a single day, the approximate probability that more than 0.2% of the items will be defective if the new machine is indeed functioning properly is ________.
فتح الحزمة
افتح القفل للوصول البطاقات البالغ عددها 321 في هذه المجموعة.
فتح الحزمة
k this deck
19
To determine the probability of getting fewer than 3 events of interest in a binomial distribution, you will find the area under the normal curve for X = 3.5 and below.
فتح الحزمة
افتح القفل للوصول البطاقات البالغ عددها 321 في هذه المجموعة.
فتح الحزمة
k this deck
20
Based on past experience, only 0.5% of the invoices of a company contain an error. Out of the 1,500 invoices that the company will issue, what is the approximate probability that zero invoices will contain an error?
فتح الحزمة
افتح القفل للوصول البطاقات البالغ عددها 321 في هذه المجموعة.
فتح الحزمة
k this deck
21
TABLE 6-1
A company has 125 personal computers. The probability that any one of them will require repair on a given day is 0.15.
Referring to Table 6-1 and assuming that the number of computers that requires repair on a given day follows a binomial distribution, compute the probability that there will be more than 25 computers that require repair on a given day using a normal approximation.
فتح الحزمة
افتح القفل للوصول البطاقات البالغ عددها 321 في هذه المجموعة.
فتح الحزمة
k this deck
22
To determine the probability of getting more than 3 events of interest in a binomial distribution, you will find the area under the normal curve for X = 3.5 and above.
فتح الحزمة
افتح القفل للوصول البطاقات البالغ عددها 321 في هذه المجموعة.
فتح الحزمة
k this deck
23
As a general rule, one can use the normal distribution to approximate a binomial distribution whenever nπ is at least 5.
فتح الحزمة
افتح القفل للوصول البطاقات البالغ عددها 321 في هذه المجموعة.
فتح الحزمة
k this deck
24
TABLE 6-1
A company has 125 personal computers. The probability that any one of them will require repair on a given day is 0.15.
Referring to Table 6-1 and assuming that the number of computers that requires repair on a given day follows a binomial distribution, compute the probability that there will be exactly 10 computers that require repair on a given day using a normal approximation.
فتح الحزمة
افتح القفل للوصول البطاقات البالغ عددها 321 في هذه المجموعة.
فتح الحزمة
k this deck
25
TABLE 6-1
A company has 125 personal computers. The probability that any one of them will require repair on a given day is 0.15.
Referring to Table 6-1 and assuming that the number of computers that requires repair on a given day follows a binomial distribution, compute the probability that there will be no more than 8 computers that require repair on a given day using a normal approximation.
فتح الحزمة
افتح القفل للوصول البطاقات البالغ عددها 321 في هذه المجموعة.
فتح الحزمة
k this deck
26
TABLE 6-1
A company has 125 personal computers. The probability that any one of them will require repair on a given day is 0.15.
Referring to Table 6-1 and assuming that the number of computers that requires repair on a given day follows a binomial distribution, compute the probability that there will be more than 25 but less than 30 computers that require repair on a given day using a normal approximation.
فتح الحزمة
افتح القفل للوصول البطاقات البالغ عددها 321 في هذه المجموعة.
فتح الحزمة
k this deck
27
As a general rule, one can use the normal distribution to approximate a binomial distribution whenever n(π - 1) is at least 5.
فتح الحزمة
افتح القفل للوصول البطاقات البالغ عددها 321 في هذه المجموعة.
فتح الحزمة
k this deck
28
TABLE 6-1
A company has 125 personal computers. The probability that any one of them will require repair on a given day is 0.15.
Referring to Table 6-1 and assuming that the number of computers that requires repair on a given day follows a binomial distribution, compute the probability that there will be less than 8 computers that require repair on a given day using a normal approximation.
فتح الحزمة
افتح القفل للوصول البطاقات البالغ عددها 321 في هذه المجموعة.
فتح الحزمة
k this deck
29
To determine the probability of getting between 3 and 4 events of interest in a binomial distribution, you will find the area under the normal curve between X = 3.5 and 4.5.
فتح الحزمة
افتح القفل للوصول البطاقات البالغ عددها 321 في هذه المجموعة.
فتح الحزمة
k this deck
30
As a general rule, one can use the normal distribution to approximate a binomial distribution whenever nπ and n(π - 1) are at least 5.
فتح الحزمة
افتح القفل للوصول البطاقات البالغ عددها 321 في هذه المجموعة.
فتح الحزمة
k this deck
31
TABLE 6-1
A company has 125 personal computers. The probability that any one of them will require repair on a given day is 0.15.
Referring to Table 6-1 and assuming that the number of computers that requires repair on a given day follows a binomial distribution, compute the probability that there will be at least 25 computers that require repair on a given day using a normal approximation.
فتح الحزمة
افتح القفل للوصول البطاقات البالغ عددها 321 في هذه المجموعة.
فتح الحزمة
k this deck
32
As a general rule, one can use the normal distribution to approximate a binomial distribution whenever the sample size is at least 15.
فتح الحزمة
افتح القفل للوصول البطاقات البالغ عددها 321 في هذه المجموعة.
فتح الحزمة
k this deck
33
To determine the probability of getting at least 3 events of interest in a binomial distribution, you will find the area under the normal curve for X = 2.5 and above.
فتح الحزمة
افتح القفل للوصول البطاقات البالغ عددها 321 في هذه المجموعة.
فتح الحزمة
k this deck
34
To determine the probability of getting between 2 and 4 events of interest in a binomial distribution, you will find the area under the normal curve between X = 1.5 and 4.5.
فتح الحزمة
افتح القفل للوصول البطاقات البالغ عددها 321 في هذه المجموعة.
فتح الحزمة
k this deck
35
TABLE 6-1
A company has 125 personal computers. The probability that any one of them will require repair on a given day is 0.15.
Referring to Table 6-1, which of the following is one of the properties required so that the binomial distribution can be used to compute the probability that no more than 2 computers will require repair on a given day?
A) The probability that a computer that will require repair in the morning is the same as that in the afternoon.
B) A randomly selected computer on a given day will either require a repair or will not.
C) The number of computers that will require repair in the morning is independent of the number of computers that will require repair in the afternoon.
D) The probability that two or more computers that will require repair in a given day approaches zero.
فتح الحزمة
افتح القفل للوصول البطاقات البالغ عددها 321 في هذه المجموعة.
فتح الحزمة
k this deck
36
TABLE 6-1
A company has 125 personal computers. The probability that any one of them will require repair on a given day is 0.15.
Referring to Table 6-1 and assuming that the number of computers that requires repair on a given day follows a binomial distribution, compute the probability that there will be between 25 and 30 computers that require repair on a given day using a normal approximation.
فتح الحزمة
افتح القفل للوصول البطاقات البالغ عددها 321 في هذه المجموعة.
فتح الحزمة
k this deck
37
TABLE 6-1
A company has 125 personal computers. The probability that any one of them will require repair on a given day is 0.15.
Referring to Table 6-1, which of the following is one of the properties required so that the binomial distribution can be used to compute the probability that no more than 2 computers will require repair on a given day?
A) The number of personal computers the company owns on a given day is fixed.
B) The probability that a computer that will require repair in the morning is the same as that in the afternoon.
C) The number of computers that will require repair in the morning is independent of the number of computers that will require repair in the afternoon.
D) The probability that two or more computers that will require repair in a given day approaches zero.
فتح الحزمة
افتح القفل للوصول البطاقات البالغ عددها 321 في هذه المجموعة.
فتح الحزمة
k this deck
38
As a general rule, one can use the normal distribution to approximate a binomial distribution whenever the sample size is at least 30.
فتح الحزمة
افتح القفل للوصول البطاقات البالغ عددها 321 في هذه المجموعة.
فتح الحزمة
k this deck
39
TABLE 6-1
A company has 125 personal computers. The probability that any one of them will require repair on a given day is 0.15.
Referring to Table 6-1, which of the following is one of the properties required so that the binomial distribution can be used to compute the probability that no more than 2 computers will require repair on a given day?
A) The probability that a computer that will require repair in the morning is the same as that in the afternoon.
B) The number of computers that will require repair in the morning is independent of the number of computers that will require repair in the afternoon.
C) The probability that any one of the computers that will require repair on a given day will not affect or change the probability that any other computers that will require repair on the same day.
D) The probability that two or more computers that will require repair in a given day approaches zero.
فتح الحزمة
افتح القفل للوصول البطاقات البالغ عددها 321 في هذه المجموعة.
فتح الحزمة
k this deck
40
To determine the probability of getting no more than 3 events of interest in a binomial distribution, you will find the area under the normal curve for X = 2.5 and below.
فتح الحزمة
افتح القفل للوصول البطاقات البالغ عددها 321 في هذه المجموعة.
فتح الحزمة
k this deck
41
TABLE 7-2
According to a survey, only 15% of customers who visited the website of a major retail store made a purchase. Random samples of size 50 are selected from a population of 900. Use the finite population correction factor.
True or False: Referring to Table 7-2, the requirements for using a normal distribution to approximate a binomial distribution is fulfilled.
فتح الحزمة
افتح القفل للوصول البطاقات البالغ عددها 321 في هذه المجموعة.
فتح الحزمة
k this deck
42
TABLE 7-2
According to a survey, only 15% of customers who visited the website of a major retail store made a purchase. Random samples of size 50 are selected from a population of 900. Use the finite population correction factor.
Referring to Table 7-2, what proportion of the samples will have between 20% and 30% of customers who will make a purchase after visiting the website?
فتح الحزمة
افتح القفل للوصول البطاقات البالغ عددها 321 في هذه المجموعة.
فتح الحزمة
k this deck
43
TABLE 7-1
Times spent studying by students in the week before final exams follow a normal distribution with standard deviation 8 hours. A random sample of 4 students was taken from a population of 50 in order to estimate the mean study time for the population of all students. Use the finite population correction.
Referring to Table 7-1, what is the probability that the sample mean is more than 3 hours below the population mean?
فتح الحزمة
افتح القفل للوصول البطاقات البالغ عددها 321 في هذه المجموعة.
فتح الحزمة
k this deck
44
TABLE 7-2
According to a survey, only 15% of customers who visited the website of a major retail store made a purchase. Random samples of size 50 are selected from a population of 900. Use the finite population correction factor.
Referring to Table 7-2, 90% of the samples will have less than what percentage of customers who will make a purchase after visiting the website?
فتح الحزمة
افتح القفل للوصول البطاقات البالغ عددها 321 في هذه المجموعة.
فتح الحزمة
k this deck
45
TABLE 7-1
Times spent studying by students in the week before final exams follow a normal distribution with standard deviation 8 hours. A random sample of 4 students was taken from a population of 50 in order to estimate the mean study time for the population of all students. Use the finite population correction.
Referring to Table 7-1, 80% of all the samples of 4 will have a sample mean of no more than how many hours from the population mean?
فتح الحزمة
افتح القفل للوصول البطاقات البالغ عددها 321 في هذه المجموعة.
فتح الحزمة
k this deck
46
TABLE 7-1
Times spent studying by students in the week before final exams follow a normal distribution with standard deviation 8 hours. A random sample of 4 students was taken from a population of 50 in order to estimate the mean study time for the population of all students. Use the finite population correction.
Referring to Table 7-1, 10% of all the samples of 4 will have a sample mean of at least how many hours below the population mean?
فتح الحزمة
افتح القفل للوصول البطاقات البالغ عددها 321 في هذه المجموعة.
فتح الحزمة
k this deck
47
You use the finite population correction factor when
A) you sample without replacement and the sample size is larger than 5% of the population size.
B) you sample without replacement and the sample size is smaller than 5% of the population size.
C) you sample with replacement and the sample size is larger than 5% of the population size.
D) you sample with replacement and the sample size is smaller than 5% of the population size.
فتح الحزمة
افتح القفل للوصول البطاقات البالغ عددها 321 في هذه المجموعة.
فتح الحزمة
k this deck
48
TABLE 7-2
According to a survey, only 15% of customers who visited the website of a major retail store made a purchase. Random samples of size 50 are selected from a population of 900. Use the finite population correction factor.
Referring to Table 7-2, what is the probability that a random sample of 50 will have at least 30% of customers who will make a purchase after visiting the website?
فتح الحزمة
افتح القفل للوصول البطاقات البالغ عددها 321 في هذه المجموعة.
فتح الحزمة
k this deck
49
TABLE 7-2
According to a survey, only 15% of customers who visited the website of a major retail store made a purchase. Random samples of size 50 are selected from a population of 900. Use the finite population correction factor.
Referring to Table 7-2, the mean of all the sample proportions of 50 customers who will make a purchase after visiting the website is ________.
فتح الحزمة
افتح القفل للوصول البطاقات البالغ عددها 321 في هذه المجموعة.
فتح الحزمة
k this deck
50
TABLE 7-1
Times spent studying by students in the week before final exams follow a normal distribution with standard deviation 8 hours. A random sample of 4 students was taken from a population of 50 in order to estimate the mean study time for the population of all students. Use the finite population correction.
Referring to Table 7-1, what is the probability that the sample mean differs from the population mean by more than 3 hours?
فتح الحزمة
افتح القفل للوصول البطاقات البالغ عددها 321 في هذه المجموعة.
فتح الحزمة
k this deck
51
TABLE 6-1
A company has 125 personal computers. The probability that any one of them will require repair on a given day is 0.15.
Referring to Table 6-1 and assuming that the number of computers that requires repair on a given day follows a binomial distribution, compute the probability that there will be less than 25 or more than 30 computers that require repair on a given day using a normal approximation.
فتح الحزمة
افتح القفل للوصول البطاقات البالغ عددها 321 في هذه المجموعة.
فتح الحزمة
k this deck
52
The use of the finite population correction factor when sampling without replacement from finite populations will
A) increase the standard error of the mean.
B) not affect the standard error of the mean.
C) reduce the standard error of the mean.
D) only affect the proportion, not the mean.
A) increase the standard error of the mean.
B) not affect the standard error of the mean.
C) reduce the standard error of the mean.
D) only affect the proportion, not the mean.
فتح الحزمة
افتح القفل للوصول البطاقات البالغ عددها 321 في هذه المجموعة.
فتح الحزمة
k this deck
53
TABLE 7-1
Times spent studying by students in the week before final exams follow a normal distribution with standard deviation 8 hours. A random sample of 4 students was taken from a population of 50 in order to estimate the mean study time for the population of all students. Use the finite population correction.
Referring to Table 7-1, what is the probability that the sample mean exceeds the population mean by more than 2 hours?
فتح الحزمة
افتح القفل للوصول البطاقات البالغ عددها 321 في هذه المجموعة.
فتح الحزمة
k this deck
54
TABLE 7-2
According to a survey, only 15% of customers who visited the website of a major retail store made a purchase. Random samples of size 50 are selected from a population of 900. Use the finite population correction factor.
Referring to Table 7-2, what proportion of the samples will have less than 15% of customers who will make a purchase after visiting the website?
فتح الحزمة
افتح القفل للوصول البطاقات البالغ عددها 321 في هذه المجموعة.
فتح الحزمة
k this deck
55
TABLE 7-1
Times spent studying by students in the week before final exams follow a normal distribution with standard deviation 8 hours. A random sample of 4 students was taken from a population of 50 in order to estimate the mean study time for the population of all students. Use the finite population correction.
Referring to Table 7-1, 90% of all the samples of 4 will have a sample mean of no more than how many hours from the population mean?
فتح الحزمة
افتح القفل للوصول البطاقات البالغ عددها 321 في هذه المجموعة.
فتح الحزمة
k this deck
56
The finite population correction factor is
A)
B)
C)
D)
A)
B)
C)
D)
فتح الحزمة
افتح القفل للوصول البطاقات البالغ عددها 321 في هذه المجموعة.
فتح الحزمة
k this deck
57
TABLE 7-2
According to a survey, only 15% of customers who visited the website of a major retail store made a purchase. Random samples of size 50 are selected from a population of 900. Use the finite population correction factor.
Referring to Table 7-2, the standard error of all the sample proportions of customers who will make a purchase after visiting the website is ________.
فتح الحزمة
افتح القفل للوصول البطاقات البالغ عددها 321 في هذه المجموعة.
فتح الحزمة
k this deck
58
TABLE 7-1
Times spent studying by students in the week before final exams follow a normal distribution with standard deviation 8 hours. A random sample of 4 students was taken from a population of 50 in order to estimate the mean study time for the population of all students. Use the finite population correction.
Referring to Table 7-1, 5% of all the samples of 4 will have a sample mean of at least how many hours above the population mean?
فتح الحزمة
افتح القفل للوصول البطاقات البالغ عددها 321 في هذه المجموعة.
فتح الحزمة
k this deck
59
TABLE 7-1
Times spent studying by students in the week before final exams follow a normal distribution with standard deviation 8 hours. A random sample of 4 students was taken from a population of 50 in order to estimate the mean study time for the population of all students. Use the finite population correction.
Referring to Table 7-1, what is the standard error of all the sample means?
فتح الحزمة
افتح القفل للوصول البطاقات البالغ عددها 321 في هذه المجموعة.
فتح الحزمة
k this deck
60
TABLE 7-1
Times spent studying by students in the week before final exams follow a normal distribution with standard deviation 8 hours. A random sample of 4 students was taken from a population of 50 in order to estimate the mean study time for the population of all students. Use the finite population correction.
Referring to Table 7-1, what is the probability that the sample mean differs from the population mean by less than 2 hours?
فتح الحزمة
افتح القفل للوصول البطاقات البالغ عددها 321 في هذه المجموعة.
فتح الحزمة
k this deck
61
TABLE 8-1
A random sample of 100 stores from a large chain of 500 garden supply stores was selected to determine the mean number of lawnmowers sold at an end-of-season clearance sale. The sample results indicated a mean of 6 and a standard deviation of 2 lawnmowers sold. A 95% confidence interval (5.623 to 6.377) was established based on these results.
Referring to Table 8-1, of all possible samples of 100 stores drawn from the population of 1,000 stores, 95% of the sample means will fall between 5.623 and 6.377 lawnmowers.
فتح الحزمة
افتح القفل للوصول البطاقات البالغ عددها 321 في هذه المجموعة.
فتح الحزمة
k this deck
62
TABLE 7-2
According to a survey, only 15% of customers who visited the website of a major retail store made a purchase. Random samples of size 50 are selected from a population of 900. Use the finite population correction factor.
Referring to Table 7-2, 90% of the samples will have more than what percentage of customers who will make a purchase after visiting the website?
فتح الحزمة
افتح القفل للوصول البطاقات البالغ عددها 321 في هذه المجموعة.
فتح الحزمة
k this deck
63
TABLE 8-1
A random sample of 100 stores from a large chain of 500 garden supply stores was selected to determine the mean number of lawnmowers sold at an end-of-season clearance sale. The sample results indicated a mean of 6 and a standard deviation of 2 lawnmowers sold. A 95% confidence interval (5.623 to 6.377) was established based on these results.
Referring to Table 8-1, there are 10 possible samples of 100 stores that can be selected out of the population of 1,000 stores.
فتح الحزمة
افتح القفل للوصول البطاقات البالغ عددها 321 في هذه المجموعة.
فتح الحزمة
k this deck
64
TABLE 8-1
A random sample of 100 stores from a large chain of 500 garden supply stores was selected to determine the mean number of lawnmowers sold at an end-of-season clearance sale. The sample results indicated a mean of 6 and a standard deviation of 2 lawnmowers sold. A 95% confidence interval (5.623 to 6.377) was established based on these results.
Referring to Table 8-1, of all possible samples of 100 stores taken from the population of 1,000 stores, 95% of the confidence intervals developed will contain the true population mean within the interval.
فتح الحزمة
افتح القفل للوصول البطاقات البالغ عددها 321 في هذه المجموعة.
فتح الحزمة
k this deck
65
TABLE 8-1
A random sample of 100 stores from a large chain of 500 garden supply stores was selected to determine the mean number of lawnmowers sold at an end-of-season clearance sale. The sample results indicated a mean of 6 and a standard deviation of 2 lawnmowers sold. A 95% confidence interval (5.623 to 6.377) was established based on these results.
Referring to Table 8-1, 95% of the stores have sold between 5.623 and 6.377 lawnmowers.
فتح الحزمة
افتح القفل للوصول البطاقات البالغ عددها 321 في هذه المجموعة.
فتح الحزمة
k this deck
66
TABLE 8-1
A random sample of 100 stores from a large chain of 500 garden supply stores was selected to determine the mean number of lawnmowers sold at an end-of-season clearance sale. The sample results indicated a mean of 6 and a standard deviation of 2 lawnmowers sold. A 95% confidence interval (5.623 to 6.377) was established based on these results.
Referring to Table 8-1, if the population had consisted of 1,000 stores, the confidence interval estimate of the mean with finite population correction would have been wider in range.
فتح الحزمة
افتح القفل للوصول البطاقات البالغ عددها 321 في هذه المجموعة.
فتح الحزمة
k this deck
67
TABLE 8-1
A random sample of 100 stores from a large chain of 500 garden supply stores was selected to determine the mean number of lawnmowers sold at an end-of-season clearance sale. The sample results indicated a mean of 6 and a standard deviation of 2 lawnmowers sold. A 95% confidence interval (5.623 to 6.377) was established based on these results.
Referring to Table 8-1, if the population had consisted of 400 stores, the confidence interval estimate of the mean with finite population correction would have been wider in range.
فتح الحزمة
افتح القفل للوصول البطاقات البالغ عددها 321 في هذه المجموعة.
فتح الحزمة
k this deck
68
TABLE 8-1
A random sample of 100 stores from a large chain of 500 garden supply stores was selected to determine the mean number of lawnmowers sold at an end-of-season clearance sale. The sample results indicated a mean of 6 and a standard deviation of 2 lawnmowers sold. A 95% confidence interval (5.623 to 6.377) was established based on these results.
Referring to Table 8-1, we do not know for sure whether the true population mean is between 5.623 and 6.377 lawnmowers sold.
فتح الحزمة
افتح القفل للوصول البطاقات البالغ عددها 321 في هذه المجموعة.
فتح الحزمة
k this deck
69
TABLE 8-2
A wealthy real estate investor wants to decide whether it is a good investment to build a high-end shopping complex in a suburban county near Chicago. His main concern is the total market value of the 3,605 houses in the suburban county. He commissioned a statistical consulting group to take a sample of 200 houses and obtained a sample mean market price of $225,000 and a sample standard deviation of $38,700. The consulting group also found out that the mean differences between market prices and appraised prices was $125,000 with a standard deviation of $3,400. Also the proportion of houses in the sample that are appraised for higher than the market prices is 0.24.
Referring to Table 8-2, what will be the 90% confidence interval for the mean market price of the houses in the suburban county constructed by the consulting group?
فتح الحزمة
افتح القفل للوصول البطاقات البالغ عددها 321 في هذه المجموعة.
فتح الحزمة
k this deck
70
TABLE 8-2
A wealthy real estate investor wants to decide whether it is a good investment to build a high-end shopping complex in a suburban county near Chicago. His main concern is the total market value of the 3,605 houses in the suburban county. He commissioned a statistical consulting group to take a sample of 200 houses and obtained a sample mean market price of $225,000 and a sample standard deviation of $38,700. The consulting group also found out that the mean differences between market prices and appraised prices was $125,000 with a standard deviation of $3,400. Also the proportion of houses in the sample that are appraised for higher than the market prices is 0.24.
Referring to Table 8-2, if the investor wants a 95% confidence on estimating the true population mean market price of the houses in the suburban county to be within $10,000, how large a sample will he need?
فتح الحزمة
افتح القفل للوصول البطاقات البالغ عددها 321 في هذه المجموعة.
فتح الحزمة
k this deck
71
If we are performing a two-tail test of whether μ = 100, the probability of detecting a shift of the mean to 105 will be ________ the probability of detecting a shift of the mean to 110.
A) less than
B) greater than
C) equal to
D) not comparable to
A) less than
B) greater than
C) equal to
D) not comparable to
فتح الحزمة
افتح القفل للوصول البطاقات البالغ عددها 321 في هذه المجموعة.
فتح الحزمة
k this deck
72
TABLE 8-2
A wealthy real estate investor wants to decide whether it is a good investment to build a high-end shopping complex in a suburban county near Chicago. His main concern is the total market value of the 3,605 houses in the suburban county. He commissioned a statistical consulting group to take a sample of 200 houses and obtained a sample mean market price of $225,000 and a sample standard deviation of $38,700. The consulting group also found out that the mean differences between market prices and appraised prices was $125,000 with a standard deviation of $3,400. Also the proportion of houses in the sample that are appraised for higher than the market prices is 0.24.
Referring to Table 8-2, what will be the 90% confidence interval for the total difference between the market prices and appraised prices of the houses in the suburban county constructed by the consulting group?
فتح الحزمة
افتح القفل للوصول البطاقات البالغ عددها 321 في هذه المجموعة.
فتح الحزمة
k this deck
73
For a given level of significance, if the sample size is increased but the summary statistics remain the same, the probability of committing a Type II error will increase.
فتح الحزمة
افتح القفل للوصول البطاقات البالغ عددها 321 في هذه المجموعة.
فتح الحزمة
k this deck
74
For a given level of significance, if the sample size is increased but the summary statistics remain the same, the probability of committing a Type I error will increase.
فتح الحزمة
افتح القفل للوصول البطاقات البالغ عددها 321 في هذه المجموعة.
فتح الحزمة
k this deck
75
For a given level of significance, if the sample size is increased but the summary statistics remain the same, the power of the test will increase.
فتح الحزمة
افتح القفل للوصول البطاقات البالغ عددها 321 في هذه المجموعة.
فتح الحزمة
k this deck
76
TABLE 9-1
A manufacturer produces light bulbs that have a mean life of at least 500 hours when the production process is working properly. Based on past experience, the population standard deviation is 50 hours and the light bulb life is normally distributed. The operations manager stops the production process if there is evidence that the population mean light bulb life is below 500 hours.
Referring to Table 9-1, if you select a sample of 100 light bulbs and are willing to have a level of significance of 0.10, the probability of a Type II error is ________ if the population mean bulb life is 490 hours.
فتح الحزمة
افتح القفل للوصول البطاقات البالغ عددها 321 في هذه المجموعة.
فتح الحزمة
k this deck
77
For a given sample size, the probability of committing a Type II error will increase when the probability of committing a Type I error is reduced.
فتح الحزمة
افتح القفل للوصول البطاقات البالغ عددها 321 في هذه المجموعة.
فتح الحزمة
k this deck
78
TABLE 8-2
A wealthy real estate investor wants to decide whether it is a good investment to build a high-end shopping complex in a suburban county near Chicago. His main concern is the total market value of the 3,605 houses in the suburban county. He commissioned a statistical consulting group to take a sample of 200 houses and obtained a sample mean market price of $225,000 and a sample standard deviation of $38,700. The consulting group also found out that the mean differences between market prices and appraised prices was $125,000 with a standard deviation of $3,400. Also the proportion of houses in the sample that are appraised for higher than the market prices is 0.24.
Referring to Table 8-2, what will be the 90% confidence interval for the total market price of the houses in the suburban county constructed by the consulting group?
فتح الحزمة
افتح القفل للوصول البطاقات البالغ عددها 321 في هذه المجموعة.
فتح الحزمة
k this deck
79
TABLE 8-1
A random sample of 100 stores from a large chain of 500 garden supply stores was selected to determine the mean number of lawnmowers sold at an end-of-season clearance sale. The sample results indicated a mean of 6 and a standard deviation of 2 lawnmowers sold. A 95% confidence interval (5.623 to 6.377) was established based on these results.
Referring to Table 8-1, the confidence interval estimate of the mean with finite population correction will be wider in range than confidence interval estimate without finite population correction.
فتح الحزمة
افتح القفل للوصول البطاقات البالغ عددها 321 في هذه المجموعة.
فتح الحزمة
k this deck
80
TABLE 8-2
A wealthy real estate investor wants to decide whether it is a good investment to build a high-end shopping complex in a suburban county near Chicago. His main concern is the total market value of the 3,605 houses in the suburban county. He commissioned a statistical consulting group to take a sample of 200 houses and obtained a sample mean market price of $225,000 and a sample standard deviation of $38,700. The consulting group also found out that the mean differences between market prices and appraised prices was $125,000 with a standard deviation of $3,400. Also the proportion of houses in the sample that are appraised for higher than the market prices is 0.24.
Referring to Table 8-2, what will be the 90% confidence interval for the population proportion of houses that will be appraised for higher than the market prices?
فتح الحزمة
افتح القفل للوصول البطاقات البالغ عددها 321 في هذه المجموعة.
فتح الحزمة
k this deck
فتح الحزمة
افتح القفل للوصول البطاقات البالغ عددها 321 في هذه المجموعة.


