Deck 18: Understanding and Representing Concepts of Data
ملء الشاشة (f)
سؤال
سؤال
سؤال
سؤال
سؤال
سؤال
سؤال
سؤال
سؤال
سؤال
سؤال
سؤال
سؤال
سؤال
سؤال
سؤال
سؤال
سؤال
سؤال
سؤال
سؤال
TIMSS: The graph below shows the number of pens, pencils, rulers, and erasers sold by a store in one week.
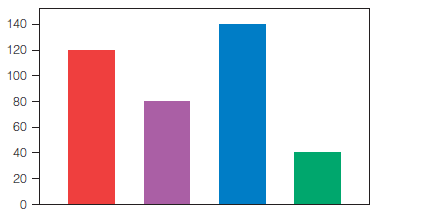
The names of the items are missing from the graph. Pens were the item most often sold, and fewer erasers than any other items were sold. More pencils than rulers were sold. How many pencils were sold?
A)40 pencils
B)80 pencils
C)120 pencils
D)140 pencils
The names of the items are missing from the graph. Pens were the item most often sold, and fewer erasers than any other items were sold. More pencils than rulers were sold. How many pencils were sold?
A)40 pencils
B)80 pencils
C)120 pencils
D)140 pencils
سؤال
سؤال
NAEP: The pie chart below shows the portion of time Brooklyn spent on homework in each subject last week.
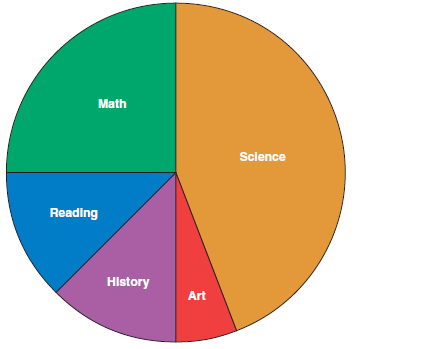
If Brooklyn spent two hours on mathematics, about how many hours did Brooklyn spend on homework altogether?
A)4 hours
B)8 hours
C)12 hours
D)16 hours
If Brooklyn spent two hours on mathematics, about how many hours did Brooklyn spend on homework altogether?
A)4 hours
B)8 hours
C)12 hours
D)16 hours
سؤال
سؤال
سؤال
سؤال
سؤال
سؤال
سؤال
سؤال
سؤال
سؤال
سؤال
سؤال
سؤال
سؤال
سؤال
سؤال
سؤال
سؤال
سؤال
A TV reporter showed this graph during a newscast and said: "The graph shows that there is a huge increase in the number of robberies from 2016 to 2017."
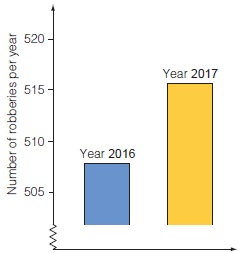
Do you consider the reporter's statement to be a reasonable interpretation of the graph? Give an explanation to support your answer.
Do you consider the reporter's statement to be a reasonable interpretation of the graph? Give an explanation to support your answer.
سؤال

فتح الحزمة
قم بالتسجيل لفتح البطاقات في هذه المجموعة!
Unlock Deck
Unlock Deck
1/43
العب
ملء الشاشة (f)
Deck 18: Understanding and Representing Concepts of Data
1
The difference between an object graph and a picture graph is that:
A)the object graph is more accurate than a picture graph.
B)the object graph uses actual objects and the picture graph uses drawings.
C)the object graph is not as easily understood as the picture graph.
D)the object graph is similar to a line plot but the picture graph is not.
A)the object graph is more accurate than a picture graph.
B)the object graph uses actual objects and the picture graph uses drawings.
C)the object graph is not as easily understood as the picture graph.
D)the object graph is similar to a line plot but the picture graph is not.
the object graph uses actual objects and the picture graph uses drawings.
2
A line plot is:
A)another name for a line graph.
B)used to show interval data.
C)another name for a stem-and-leaf plot.
D)used to show individual data points.
A)another name for a line graph.
B)used to show interval data.
C)another name for a stem-and-leaf plot.
D)used to show individual data points.
used to show individual data points.
3
Suppose childre n are asked to give the number of children in their families, and they find that two children is the most frequent answer. They are working with the:
A)mean.
B)median.
C)mode.
D)range.
A)mean.
B)median.
C)mode.
D)range.
mode.
4
The difference between a bar graph and a line plot is:
A)a bar graph shows interval data, and the line plot does not.
B)a bar graph shows more detail than a line plot.
C)a line plot shows individual pieces of data, and the bar graph does not.
D)very little, as they are essentially the same graph.
A)a bar graph shows interval data, and the line plot does not.
B)a bar graph shows more detail than a line plot.
C)a line plot shows individual pieces of data, and the bar graph does not.
D)very little, as they are essentially the same graph.
فتح الحزمة
افتح القفل للوصول البطاقات البالغ عددها 43 في هذه المجموعة.
فتح الحزمة
k this deck
5
A line graph is better for:
A)discrete data.
B)continuous data.
C)interval data.
D)categorical data.
A)discrete data.
B)continuous data.
C)interval data.
D)categorical data.
فتح الحزمة
افتح القفل للوصول البطاقات البالغ عددها 43 في هذه المجموعة.
فتح الحزمة
k this deck
6
According to the NCTM, the main purpose of collecting data is to:
A)answer questions when the answers are not immediately obvious.
B)satisfy state and national standards.
C)satisfy the data analysis content standard.
D)find definitive answers to given information.
A)answer questions when the answers are not immediately obvious.
B)satisfy state and national standards.
C)satisfy the data analysis content standard.
D)find definitive answers to given information.
فتح الحزمة
افتح القفل للوصول البطاقات البالغ عددها 43 في هذه المجموعة.
فتح الحزمة
k this deck
7
In a given survey, 2 children preferred vanilla ice cream, 5 preferred chocolate ice cream, 7 preferred chocolate chip ice cream, and 10 preferred cookie dough ice cream. Asked to make a bar graph of the data, Sara chose to label the vertical axis with these numbers (2, 5, 7, 10), marking each number along the axis, one after the other. Which of the following is a true statement about this graph?
A)This is an accurate portrayal of the information.
B)The graph is distorted because the numbers are not equally spaced.
C)The graph has inaccurate or nonexistent labels on the horizontal axis.
D)The graph should have shown the individual data points.
A)This is an accurate portrayal of the information.
B)The graph is distorted because the numbers are not equally spaced.
C)The graph has inaccurate or nonexistent labels on the horizontal axis.
D)The graph should have shown the individual data points.
فتح الحزمة
افتح القفل للوصول البطاقات البالغ عددها 43 في هذه المجموعة.
فتح الحزمة
k this deck
8
Prerequisites for constructing circle graphs include all of the following except for :
A)understanding decimals and fractions.
B)measuring angles with a protractor.
C)understanding percents.
D)understanding numerical data.
A)understanding decimals and fractions.
B)measuring angles with a protractor.
C)understanding percents.
D)understanding numerical data.
فتح الحزمة
افتح القفل للوصول البطاقات البالغ عددها 43 في هذه المجموعة.
فتح الحزمة
k this deck
9
The following are questions that should be asked when working with meaningful collection and display of data except for :
A)What is the question that justifies the data collection?
B)What information is needed to answer the question?
C)What is the easiest graph to make with the data?
D)How can the information be organized and analyzed?
A)What is the question that justifies the data collection?
B)What information is needed to answer the question?
C)What is the easiest graph to make with the data?
D)How can the information be organized and analyzed?
فتح الحزمة
افتح القفل للوصول البطاقات البالغ عددها 43 في هذه المجموعة.
فتح الحزمة
k this deck
10
Comparing a bar graph to a histogram, which of the following is a true statement?
A)A bar graph illustrates interval data and a histogram illustrates discrete data.
B)A bar graph is a specialized type of histogram.
C)A bar graph has separate bars while the histogram has bars that must touch.
D)A histogram is a specialized type of bar graph.
A)A bar graph illustrates interval data and a histogram illustrates discrete data.
B)A bar graph is a specialized type of histogram.
C)A bar graph has separate bars while the histogram has bars that must touch.
D)A histogram is a specialized type of bar graph.
فتح الحزمة
افتح القفل للوصول البطاقات البالغ عددها 43 في هذه المجموعة.
فتح الحزمة
k this deck
11
The mean and the median can be determined for:
A)numerical data.
B)categorical data.
C)both numerical and categorical data.
D)neither numerical nor categorical data.
A)numerical data.
B)categorical data.
C)both numerical and categorical data.
D)neither numerical nor categorical data.
فتح الحزمة
افتح القفل للوصول البطاقات البالغ عددها 43 في هذه المجموعة.
فتح الحزمة
k this deck
12
An outlier will affect which of the following measures the most?
A)mode
B)median
C)mean
D)interquartile range
A)mode
B)median
C)mean
D)interquartile range
فتح الحزمة
افتح القفل للوصول البطاقات البالغ عددها 43 في هذه المجموعة.
فتح الحزمة
k this deck
13
A teacher measured the heights of children in her classroom and determined that the mean was 56 inches and the median was 54 inches. Which of the following statements is true?
A)Half the children were taller than 56 inches.
B)The average height of the children was 55 inches.
C)Half the children were taller than 54 inches.
D)The average height of the children was 54 inches.
A)Half the children were taller than 56 inches.
B)The average height of the children was 55 inches.
C)Half the children were taller than 54 inches.
D)The average height of the children was 54 inches.
فتح الحزمة
افتح القفل للوصول البطاقات البالغ عددها 43 في هذه المجموعة.
فتح الحزمة
k this deck
14
The mode can be determined for:
A)numerical data only.
B)categorical data only.
C)both numerical and categorical data.
D)neither numerical nor categorical data.
A)numerical data only.
B)categorical data only.
C)both numerical and categorical data.
D)neither numerical nor categorical data.
فتح الحزمة
افتح القفل للوصول البطاقات البالغ عددها 43 في هذه المجموعة.
فتح الحزمة
k this deck
15
Stem-and-leaf plots are especially useful for displaying:
A)raw data.
B)categorical data.
C)continuous data.
D)interval data.
A)raw data.
B)categorical data.
C)continuous data.
D)interval data.
فتح الحزمة
افتح القفل للوصول البطاقات البالغ عددها 43 في هذه المجموعة.
فتح الحزمة
k this deck
16
Circle graphs are used to illustrate:
A)categorical data.
B)numerical data.
C)interval data.
D)continuous data.
A)categorical data.
B)numerical data.
C)interval data.
D)continuous data.
فتح الحزمة
افتح القفل للوصول البطاقات البالغ عددها 43 في هذه المجموعة.
فتح الحزمة
k this deck
17
A line graph could be used in each of the following situations except for :
A)trends over time.
B)data such as height and weight.
C)the number of siblings children have.
D)situations in which one value changes in relation to another.
A)trends over time.
B)data such as height and weight.
C)the number of siblings children have.
D)situations in which one value changes in relation to another.
فتح الحزمة
افتح القفل للوصول البطاقات البالغ عددها 43 في هذه المجموعة.
فتح الحزمة
k this deck
18
The following are true statements about box-and-whisker plots except for :
A)Box-and-whisker plots are used to compare two different data sets.
B)Box-and-whisker plots represent data in 25% increments.
C)Box-and-whisker plots represent how scattered the data are.
D)Box-and-whisker plots are use to find the mean and standard deviation of a set of data.
A)Box-and-whisker plots are used to compare two different data sets.
B)Box-and-whisker plots represent data in 25% increments.
C)Box-and-whisker plots represent how scattered the data are.
D)Box-and-whisker plots are use to find the mean and standard deviation of a set of data.
فتح الحزمة
افتح القفل للوصول البطاقات البالغ عددها 43 في هذه المجموعة.
فتح الحزمة
k this deck
19
A box-and-whisker plots graphically displays:
A)the mean, the median, and the mode.
B)the mean, the median, and the lower quartile.
C)the median, the lower quartile, and the mode.
D)the median, the lower quartile, and the third quartile.
A)the mean, the median, and the mode.
B)the mean, the median, and the lower quartile.
C)the median, the lower quartile, and the mode.
D)the median, the lower quartile, and the third quartile.
فتح الحزمة
افتح القفل للوصول البطاقات البالغ عددها 43 في هذه المجموعة.
فتح الحزمة
k this deck
20
Which of the following is not a characteristic of a hat plot?
A)A hat plot displays all of the data.
B)A hat plot shows the median.
C)A hat plot shows the high and low data points.
D)A hat plot displays the range of data.
A)A hat plot displays all of the data.
B)A hat plot shows the median.
C)A hat plot shows the high and low data points.
D)A hat plot displays the range of data.
فتح الحزمة
افتح القفل للوصول البطاقات البالغ عددها 43 في هذه المجموعة.
فتح الحزمة
k this deck
21
TIMSS: The graph below shows the number of pens, pencils, rulers, and erasers sold by a store in one week.
The names of the items are missing from the graph. Pens were the item most often sold, and fewer erasers than any other items were sold. More pencils than rulers were sold. How many pencils were sold?
A)40 pencils
B)80 pencils
C)120 pencils
D)140 pencils
The names of the items are missing from the graph. Pens were the item most often sold, and fewer erasers than any other items were sold. More pencils than rulers were sold. How many pencils were sold?
A)40 pencils
B)80 pencils
C)120 pencils
D)140 pencils
فتح الحزمة
افتح القفل للوصول البطاقات البالغ عددها 43 في هذه المجموعة.
فتح الحزمة
k this deck
22
Data collection is more meaningful for younger children if it relates to their lives. Give three examples of data collection activities that would further children's understanding of data collection.
فتح الحزمة
افتح القفل للوصول البطاقات البالغ عددها 43 في هذه المجموعة.
فتح الحزمة
k this deck
23
NAEP: The pie chart below shows the portion of time Brooklyn spent on homework in each subject last week.
If Brooklyn spent two hours on mathematics, about how many hours did Brooklyn spend on homework altogether?
A)4 hours
B)8 hours
C)12 hours
D)16 hours
If Brooklyn spent two hours on mathematics, about how many hours did Brooklyn spend on homework altogether?
A)4 hours
B)8 hours
C)12 hours
D)16 hours
فتح الحزمة
افتح القفل للوصول البطاقات البالغ عددها 43 في هذه المجموعة.
فتح الحزمة
k this deck
24
All of the following data values are represented on a box-and-whisker plot except for:
A)mean.
B)median.
C)outliers.
D)third quadrant.
A)mean.
B)median.
C)outliers.
D)third quadrant.
فتح الحزمة
افتح القفل للوصول البطاقات البالغ عددها 43 في هذه المجموعة.
فتح الحزمة
k this deck
25
In order to determine the average price of a room at a New York City hotel, you would determine the
A)mean.
B)median.
C)mode.
D)range.
A)mean.
B)median.
C)mode.
D)range.
فتح الحزمة
افتح القفل للوصول البطاقات البالغ عددها 43 في هذه المجموعة.
فتح الحزمة
k this deck
26
34. What are the major concepts about data collection that a teacher should strive for?
فتح الحزمة
افتح القفل للوصول البطاقات البالغ عددها 43 في هذه المجموعة.
فتح الحزمة
k this deck
27
Teacher Licensing Examination Questions
Praxis: The hand spans of ninth-grade students at Martin Luther King, Jr. High are approximately normally distributed, with a mean of 7 inches and a standard deviation of 1 inch. Of the following groups of measurements of hand span, which is expected to contain the largest number of ninth-graders?
A)less than 6 inches
B)greater than 7 inches
C)between 6 and 8 inches
D)between 5 and 7 inches
فتح الحزمة
افتح القفل للوصول البطاقات البالغ عددها 43 في هذه المجموعة.
فتح الحزمة
k this deck
28
Which of these measures of central tendency will be affected by an outlier?
A)mean
B)median
C)mode
D)mean, median, and mode
A)mean
B)median
C)mode
D)mean, median, and mode
فتح الحزمة
افتح القفل للوصول البطاقات البالغ عددها 43 في هذه المجموعة.
فتح الحزمة
k this deck
29
A student asks you to explain why there are both histograms and bar graphs. Give examples that illustrate the differences between these two types of graphs.
فتح الحزمة
افتح القفل للوصول البطاقات البالغ عددها 43 في هذه المجموعة.
فتح الحزمة
k this deck
30
In order to determine the favorite ice cream flavor of the class, you would determine the
A)mean.
B)median.
C)mode.
D)range.
A)mean.
B)median.
C)mode.
D)range.
فتح الحزمة
افتح القفل للوصول البطاقات البالغ عددها 43 في هذه المجموعة.
فتح الحزمة
k this deck
31
Explain the differences between object graphs and picture graphs.
فتح الحزمة
افتح القفل للوصول البطاقات البالغ عددها 43 في هذه المجموعة.
فتح الحزمة
k this deck
32
Which of the following is categorical data?
A)shoe size
B)height
C)weight
D)age
A)shoe size
B)height
C)weight
D)age
فتح الحزمة
افتح القفل للوصول البطاقات البالغ عددها 43 في هذه المجموعة.
فتح الحزمة
k this deck
33
In order to find the class average on a test, you would determine the
A)mean.
B)median.
C)mode.
D)range.
A)mean.
B)median.
C)mode.
D)range.
فتح الحزمة
افتح القفل للوصول البطاقات البالغ عددها 43 في هذه المجموعة.
فتح الحزمة
k this deck
34
Find the median of the following set:
{7, 9, 12, 6, 18, 44}
A)16
B)10
C)10.5
D)12
{7, 9, 12, 6, 18, 44}
A)16
B)10
C)10.5
D)12
فتح الحزمة
افتح القفل للوصول البطاقات البالغ عددها 43 في هذه المجموعة.
فتح الحزمة
k this deck
35
What are two misconceptions children are prone to experience when working with bar graphs?
فتح الحزمة
افتح القفل للوصول البطاقات البالغ عددها 43 في هذه المجموعة.
فتح الحزمة
k this deck
36
Children have difficulty deciding when the mode, median, and mean would be appropriate measures of data. Give one situation for each measure of central tendency that would help children remember the differences and uses for these measures.
فتح الحزمة
افتح القفل للوصول البطاقات البالغ عددها 43 في هذه المجموعة.
فتح الحزمة
k this deck
37
Explain the difference between categorical and numerical data.
فتح الحزمة
افتح القفل للوصول البطاقات البالغ عددها 43 في هذه المجموعة.
فتح الحزمة
k this deck
38
Using tables is one of the first data collection devices that children use to display data. Why are tables particularly suited to young children's understanding of data collection?
فتح الحزمة
افتح القفل للوصول البطاقات البالغ عددها 43 في هذه المجموعة.
فتح الحزمة
k this deck
39
Children use circle graphs:
A)only after they can impute percentages.
B)only after they understand angle measure.
C)when they can informally compare areas.
D)when they are ready to construct their own circle graphs.
A)only after they can impute percentages.
B)only after they understand angle measure.
C)when they can informally compare areas.
D)when they are ready to construct their own circle graphs.
فتح الحزمة
افتح القفل للوصول البطاقات البالغ عددها 43 في هذه المجموعة.
فتح الحزمة
k this deck
40
Young children would work with graphs in which order?
A)object, bar, picture
B)bar, picture, object
C)object, picture, bar
D)bar, object, picture
A)object, bar, picture
B)bar, picture, object
C)object, picture, bar
D)bar, object, picture
فتح الحزمة
افتح القفل للوصول البطاقات البالغ عددها 43 في هذه المجموعة.
فتح الحزمة
k this deck
41
Is it possible to create stem-and-leaf plots and box-and-whisker plots with the same data set? If so, give an example that could be used for both. Then explain the differences, if any, in the two different graphs.
فتح الحزمة
افتح القفل للوصول البطاقات البالغ عددها 43 في هذه المجموعة.
فتح الحزمة
k this deck
42
A TV reporter showed this graph during a newscast and said: "The graph shows that there is a huge increase in the number of robberies from 2016 to 2017."
Do you consider the reporter's statement to be a reasonable interpretation of the graph? Give an explanation to support your answer.
Do you consider the reporter's statement to be a reasonable interpretation of the graph? Give an explanation to support your answer.
فتح الحزمة
افتح القفل للوصول البطاقات البالغ عددها 43 في هذه المجموعة.
فتح الحزمة
k this deck
43
Circle graphs are difficult for children to create until they have reached the maturation level of middle school. What are some ways that elementary teachers can introduce circle graphs before that time?
فتح الحزمة
افتح القفل للوصول البطاقات البالغ عددها 43 في هذه المجموعة.
فتح الحزمة
k this deck
فتح الحزمة
افتح القفل للوصول البطاقات البالغ عددها 43 في هذه المجموعة.


