Deck 18: Excel 2007 Unit D: Working With Charts
ملء الشاشة (f)
سؤال
سؤال
سؤال
سؤال
سؤال
سؤال
سؤال
سؤال
سؤال
سؤال
سؤال
سؤال
سؤال
سؤال
سؤال
سؤال
سؤال
سؤال
سؤال
سؤال
سؤال
سؤال
 As shown in the figure above, item 5 represents ____.
A) a plot area
B) tick marks
C) a data series
D) a legend
سؤال
 As shown in the figure above, item ____ represents the vertical axis.
A) 1
B) 3
C) 6
D) 7
سؤال
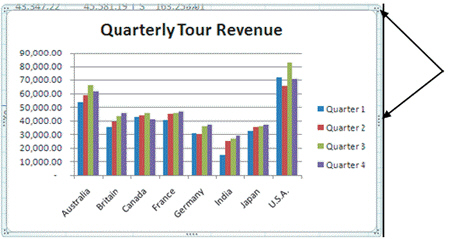 The arrows shown in the figure above point to ____.
A) data markers
B) I-beams
C) legends
D) sizing handles
سؤال
سؤال
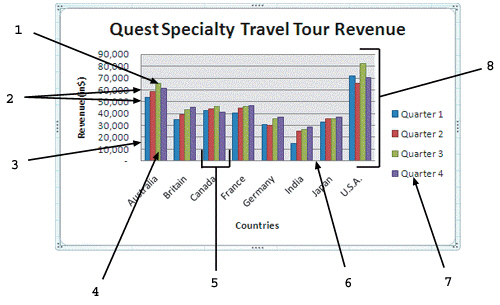 As shown in the figure above, item ____ represents the horizontal axis.
A) 2
B) 3
C) 6
D) 7
سؤال
سؤال
 As shown in the figure above, item 4 points to a ____.
A) data point
B) tick mark
C) data series
D) data marker
سؤال
سؤال
 As shown in the figure above, item 7 represents ____.
A) data markers
B) tick marks
C) the plot area
D) the legend
سؤال
 The chart shown in the figure above is a(n) ____ chart.
A) clustered column
B) exploding pie
C) scatter
D) line
سؤال
سؤال
سؤال
سؤال
سؤال
 As shown in the figure above, item ____ represents a data point.
A) 1
B) 3
C) 4
D) 7
سؤال
سؤال
سؤال
سؤال
سؤال
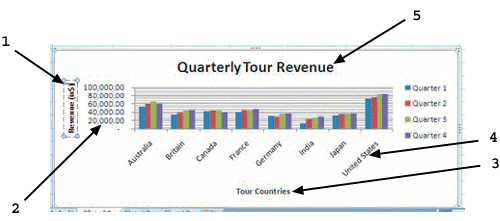 As shown in the figure above, item 3 points to a ____.
A) vertical axis label
B) horizontal axis label
C) horizontal axis title
D) vertical axis title
سؤال
 As shown in the figure above, item 8 represents the ____________________.
 سؤال
 As shown in the figure above, item 2 points to a ____.
A) vertical axis label
B) horizontal axis label
C) horizontal axis title
D) vertical axis title
سؤال
سؤال
سؤال
 As shown in the figure above, item 5 points to the ____________________.
 سؤال
سؤال
 As shown in the figure above, item 2 points to ____________________.
 سؤال
سؤال
سؤال
سؤال
سؤال
سؤال
سؤال
سؤال
سؤال
 As shown in the figure above, item 1 points to a ____.
A) vertical axis label
B) horizontal axis label
C) horizontal axis title
D) vertical axis title
سؤال
سؤال
 As shown in the figure above, item 4 points to a ____.
A) vertical axis label
B) horizontal axis label
C) horizontal axis title
D) vertical axis title
سؤال
سؤال
Match between columns
سؤال
You are having trouble keeping track of your personal spending and you decide to create a worksheet and a chart to help you better understand and plan for your personal expenses. The worksheet and chart are shown below.  You want to explain Other Expenses a little more in the chart by using a text annotation. Write the procedure for adding a text box with the text Ex - gym fees, health insurance to the chart.
You want to explain Other Expenses a little more in the chart by using a text annotation. Write the procedure for adding a text box with the text Ex - gym fees, health insurance to the chart. سؤال
You are a manager in the Sales department for a clothing store that has three locations. You have prepared the following worksheet containing data about the sales figures for the company, which also has a chart of the data.  What are the horizontal axis labels in the chart?
What are the horizontal axis labels in the chart? سؤال
You are a manager in the Sales department for a clothing store that has three locations. You have prepared the following worksheet containing data about the sales figures for the company, which also has a chart of the data.  Which store location had the highest sales in the 2nd Quarter? Which had the lowest sales in the same quarter?
Which store location had the highest sales in the 2nd Quarter? Which had the lowest sales in the same quarter? سؤال
You are a manager in the Sales department for a clothing store that has three locations. You have prepared the following worksheet containing data about the sales figures for the company, which also has a chart of the data. 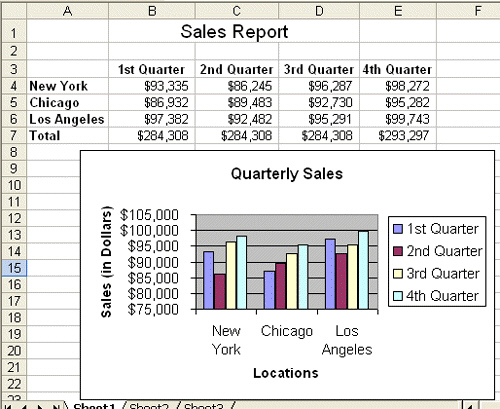 What is the chart type of the chart shown in the figure above? Is it an embedded chart?
What is the chart type of the chart shown in the figure above? Is it an embedded chart? سؤال
You are having trouble keeping track of your personal spending and you decide to create a worksheet and a chart to help you better understand and plan for your personal expenses. The worksheet and chart are shown below. 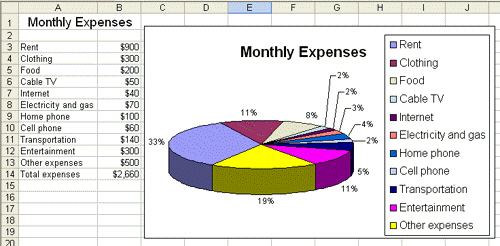 You want to explode the slide for Clothing . Write the procedure for doing this.
You want to explode the slide for Clothing . Write the procedure for doing this.
فتح الحزمة
قم بالتسجيل لفتح البطاقات في هذه المجموعة!
Unlock Deck
Unlock Deck
1/66
العب
ملء الشاشة (f)
Deck 18: Excel 2007 Unit D: Working With Charts
1
The area inside the horizontal and vertical axes is the legend .
False
2
A(n) ____ identifies each data series in a chart.
A) axis
B) data point
C) data marker
D) legend
A) axis
B) data point
C) data marker
D) legend
D
3
You can use buttons on the Insert tab of the Ribbon to create and modify a chart.
True
4
A collection of related data points is called a ____.
A) data marker
B) tick mark
C) data point
D) data series
A) data marker
B) tick mark
C) data point
D) data series
فتح الحزمة
افتح القفل للوصول البطاقات البالغ عددها 66 في هذه المجموعة.
فتح الحزمة
k this deck
5
WordArt, which lets you create curved or stylized text, can be created using the Chart Tools Format tab.
فتح الحزمة
افتح القفل للوصول البطاقات البالغ عددها 66 في هذه المجموعة.
فتح الحزمة
k this deck
6
A bar chart compares trends over even time intervals.
فتح الحزمة
افتح القفل للوصول البطاقات البالغ عددها 66 في هذه المجموعة.
فتح الحزمة
k this deck
7
Sub gridlines show the values between the tick marks.
فتح الحزمة
افتح القفل للوصول البطاقات البالغ عددها 66 في هذه المجموعة.
فتح الحزمة
k this deck
8
The x-axis and y-axis are, respectively, the ____.
A) horizontal and vertical axes
B) data series and gridlines
C) tick markers and data series
D) vertical and horizontal axes
A) horizontal and vertical axes
B) data series and gridlines
C) tick markers and data series
D) vertical and horizontal axes
فتح الحزمة
افتح القفل للوصول البطاقات البالغ عددها 66 في هذه المجموعة.
فتح الحزمة
k this deck
9
You can resize a chart to improve its appearance by dragging its sizing handles .
فتح الحزمة
افتح القفل للوصول البطاقات البالغ عددها 66 في هذه المجموعة.
فتح الحزمة
k this deck
10
The z-axis of 3-D charts is used for comparing data across both categories and values.
فتح الحزمة
افتح القفل للوصول البطاقات البالغ عددها 66 في هذه المجموعة.
فتح الحزمة
k this deck
11
Each value in a cell selected for a chart is called a ____.
A) data marker
B) tick mark
C) data point
D) data series
A) data marker
B) tick mark
C) data point
D) data series
فتح الحزمة
افتح القفل للوصول البطاقات البالغ عددها 66 في هذه المجموعة.
فتح الحزمة
k this deck
12
A chart sheet is a sheet in a workbook that contains only a chart, which is linked to the workbook data.
فتح الحزمة
افتح القفل للوصول البطاقات البالغ عددها 66 في هذه المجموعة.
فتح الحزمة
k this deck
13
Moving a chart object around on a worksheet can affect the data in the worksheet.
فتح الحزمة
افتح القفل للوصول البطاقات البالغ عددها 66 في هذه المجموعة.
فتح الحزمة
k this deck
14
When the landscape orientation is selected, the data and chart will be positioned vertically on a page.
فتح الحزمة
افتح القفل للوصول البطاقات البالغ عددها 66 في هذه المجموعة.
فتح الحزمة
k this deck
15
Any data changed in the worksheet is automatically updated in the chart.
فتح الحزمة
افتح القفل للوصول البطاقات البالغ عددها 66 في هذه المجموعة.
فتح الحزمة
k this deck
16
A chart must be located in a specific cell or at a specific range address.
فتح الحزمة
افتح القفل للوصول البطاقات البالغ عددها 66 في هذه المجموعة.
فتح الحزمة
k this deck
17
You can create multiple charts based on the same worksheet data.
فتح الحزمة
افتح القفل للوصول البطاقات البالغ عددها 66 في هذه المجموعة.
فتح الحزمة
k this deck
18
In a pie chart, you can emphasize one data point by dissecting , or pulling that slice away from, the pie chart.
فتح الحزمة
افتح القفل للوصول البطاقات البالغ عددها 66 في هذه المجموعة.
فتح الحزمة
k this deck
19
The horizontal axis is also called the value axis.
فتح الحزمة
افتح القفل للوصول البطاقات البالغ عددها 66 في هذه المجموعة.
فتح الحزمة
k this deck
20
____ indicate the scale of measure for each value on the y-axis.
A) Data points
B) Tick marks
C) Data markers
D) Data series
A) Data points
B) Tick marks
C) Data markers
D) Data series
فتح الحزمة
افتح القفل للوصول البطاقات البالغ عددها 66 في هذه المجموعة.
فتح الحزمة
k this deck
21
Which two charts compare trends over time intervals?
A) Bar and pie
B) Pie and area
C) Area and line
D) Line and scatter
A) Bar and pie
B) Pie and area
C) Area and line
D) Line and scatter
فتح الحزمة
افتح القفل للوصول البطاقات البالغ عددها 66 في هذه المجموعة.
فتح الحزمة
k this deck
22
As shown in the figure above, item 5 represents ____.A) a plot area
B) tick marks
C) a data series
D) a legend
فتح الحزمة
افتح القفل للوصول البطاقات البالغ عددها 66 في هذه المجموعة.
فتح الحزمة
k this deck
23
As shown in the figure above, item ____ represents the vertical axis.A) 1
B) 3
C) 6
D) 7
فتح الحزمة
افتح القفل للوصول البطاقات البالغ عددها 66 في هذه المجموعة.
فتح الحزمة
k this deck
24
The arrows shown in the figure above point to ____.A) data markers
B) I-beams
C) legends
D) sizing handles
فتح الحزمة
افتح القفل للوصول البطاقات البالغ عددها 66 في هذه المجموعة.
فتح الحزمة
k this deck
25
To show how individual volume changes over time in relation to total volume, use a(n) ____.
A) area chart
B) bar chart
C) column chart
D) line chart
A) area chart
B) bar chart
C) column chart
D) line chart
فتح الحزمة
افتح القفل للوصول البطاقات البالغ عددها 66 في هذه المجموعة.
فتح الحزمة
k this deck
26
As shown in the figure above, item ____ represents the horizontal axis.A) 2
B) 3
C) 6
D) 7
فتح الحزمة
افتح القفل للوصول البطاقات البالغ عددها 66 في هذه المجموعة.
فتح الحزمة
k this deck
27
A(n) ____ chart compares distinct object levels using a vertical format; is the Excel default.
A) line
B) area
C) column
D) pie
A) line
B) area
C) column
D) pie
فتح الحزمة
افتح القفل للوصول البطاقات البالغ عددها 66 في هذه المجموعة.
فتح الحزمة
k this deck
28
As shown in the figure above, item 4 points to a ____.A) data point
B) tick mark
C) data series
D) data marker
فتح الحزمة
افتح القفل للوصول البطاقات البالغ عددها 66 في هذه المجموعة.
فتح الحزمة
k this deck
29
On a chart created in Excel, the horizontal axis is called the ____.
A) x-axis
B) y-axis
C) data marker
D) legend
A) x-axis
B) y-axis
C) data marker
D) legend
فتح الحزمة
افتح القفل للوصول البطاقات البالغ عددها 66 في هذه المجموعة.
فتح الحزمة
k this deck
30
As shown in the figure above, item 7 represents ____.A) data markers
B) tick marks
C) the plot area
D) the legend
فتح الحزمة
افتح القفل للوصول البطاقات البالغ عددها 66 في هذه المجموعة.
فتح الحزمة
k this deck
31
The chart shown in the figure above is a(n) ____ chart.A) clustered column
B) exploding pie
C) scatter
D) line
فتح الحزمة
افتح القفل للوصول البطاقات البالغ عددها 66 في هذه المجموعة.
فتح الحزمة
k this deck
32
A pie chart ____.
A) compares distinct, unrelated objects over time using a horizontal format
B) compares trends over even time intervals
C) compares trends over uneven time or measurement intervals
D) compares sizes of pieces as part of a whole
A) compares distinct, unrelated objects over time using a horizontal format
B) compares trends over even time intervals
C) compares trends over uneven time or measurement intervals
D) compares sizes of pieces as part of a whole
فتح الحزمة
افتح القفل للوصول البطاقات البالغ عددها 66 في هذه المجموعة.
فتح الحزمة
k this deck
33
____ are the horizontal and vertical lines in a chart that enable the eye to follow the value on an axis.
A) Tick marks
B) Axis lines
C) Arrows
D) Gridlines
A) Tick marks
B) Axis lines
C) Arrows
D) Gridlines
فتح الحزمة
افتح القفل للوصول البطاقات البالغ عددها 66 في هذه المجموعة.
فتح الحزمة
k this deck
34
On a chart created in Excel, the vertical axis is called the ____.
A) x-axis
B) y-axis
C) data marker
D) legend
A) x-axis
B) y-axis
C) data marker
D) legend
فتح الحزمة
افتح القفل للوصول البطاقات البالغ عددها 66 في هذه المجموعة.
فتح الحزمة
k this deck
35
A scatter chart ____.
A) compares distinct, unrelated objects over time using a horizontal format
B) compares trends over even time intervals
C) compares trends over uneven time or measurement intervals
D) combines a column and line chart to compare data requiring different scales of measure
A) compares distinct, unrelated objects over time using a horizontal format
B) compares trends over even time intervals
C) compares trends over uneven time or measurement intervals
D) combines a column and line chart to compare data requiring different scales of measure
فتح الحزمة
افتح القفل للوصول البطاقات البالغ عددها 66 في هذه المجموعة.
فتح الحزمة
k this deck
36
As shown in the figure above, item ____ represents a data point.A) 1
B) 3
C) 4
D) 7
فتح الحزمة
افتح القفل للوصول البطاقات البالغ عددها 66 في هذه المجموعة.
فتح الحزمة
k this deck
37
You can apply a chart type to an existing data series in a chart to create a(n) ____ chart.
A) nested
B) combination
C) complex
D) exploded
A) nested
B) combination
C) complex
D) exploded
فتح الحزمة
افتح القفل للوصول البطاقات البالغ عددها 66 في هذه المجموعة.
فتح الحزمة
k this deck
38
Which chart type would you use to compare distinct objects over time using a horizontal format?
A) Area
B) Bar
C) Column
D) Line
A) Area
B) Bar
C) Column
D) Line
فتح الحزمة
افتح القفل للوصول البطاقات البالغ عددها 66 في هذه المجموعة.
فتح الحزمة
k this deck
39
A chart that is inserted directly in the current worksheet is called a(n) ____ chart.
A) inner
B) embedded
C) sub
D) interactive
A) inner
B) embedded
C) sub
D) interactive
فتح الحزمة
افتح القفل للوصول البطاقات البالغ عددها 66 في هذه المجموعة.
فتح الحزمة
k this deck
40
You can modify the data range and configuration of a chart in the ____ group of the Chart Tools Design tab.
A) Data
B) Type
C) Chart Layouts
D) Chart Styles
A) Data
B) Type
C) Chart Layouts
D) Chart Styles
فتح الحزمة
افتح القفل للوصول البطاقات البالغ عددها 66 في هذه المجموعة.
فتح الحزمة
k this deck
41
As shown in the figure above, item 3 points to a ____.A) vertical axis label
B) horizontal axis label
C) horizontal axis title
D) vertical axis title
فتح الحزمة
افتح القفل للوصول البطاقات البالغ عددها 66 في هذه المجموعة.
فتح الحزمة
k this deck
42
As shown in the figure above, item 8 represents the ____________________. فتح الحزمة
افتح القفل للوصول البطاقات البالغ عددها 66 في هذه المجموعة.
فتح الحزمة
k this deck
43
As shown in the figure above, item 2 points to a ____.A) vertical axis label
B) horizontal axis label
C) horizontal axis title
D) vertical axis title
فتح الحزمة
افتح القفل للوصول البطاقات البالغ عددها 66 في هذه المجموعة.
فتح الحزمة
k this deck
44
____ make it possible to apply multiple formats to a data series, such as an outline, fill color, and text color, all with a single click.
A) Text annotations
B) Gridlines
C) Markers
D) Styles
A) Text annotations
B) Gridlines
C) Markers
D) Styles
فتح الحزمة
افتح القفل للوصول البطاقات البالغ عددها 66 في هذه المجموعة.
فتح الحزمة
k this deck
45
Describe four commonly used Excel chart types.
فتح الحزمة
افتح القفل للوصول البطاقات البالغ عددها 66 في هذه المجموعة.
فتح الحزمة
k this deck
46
As shown in the figure above, item 5 points to the ____________________. فتح الحزمة
افتح القفل للوصول البطاقات البالغ عددها 66 في هذه المجموعة.
فتح الحزمة
k this deck
47
You can add a text box using the Chart Tools ____ tab.
A) Design
B) Layout
C) Format
D) Text
A) Design
B) Layout
C) Format
D) Text
فتح الحزمة
افتح القفل للوصول البطاقات البالغ عددها 66 في هذه المجموعة.
فتح الحزمة
k this deck
48
As shown in the figure above, item 2 points to ____________________. فتح الحزمة
افتح القفل للوصول البطاقات البالغ عددها 66 في هذه المجموعة.
فتح الحزمة
k this deck
49
Describe some of the formatting changes that you can make to a chart using the Chart Tools Format tab.
فتح الحزمة
افتح القفل للوصول البطاقات البالغ عددها 66 في هذه المجموعة.
فتح الحزمة
k this deck
50
When the mouse pointer hovers over any chart object, the name of the selected object appears on screen as a(n) ____________________.
فتح الحزمة
افتح القفل للوصول البطاقات البالغ عددها 66 في هذه المجموعة.
فتح الحزمة
k this deck
51
In a pie chart, slices that are pulled away are said to be ____.
A) identified
B) exploded
C) opened
D) extracted
A) identified
B) exploded
C) opened
D) extracted
فتح الحزمة
افتح القفل للوصول البطاقات البالغ عددها 66 في هذه المجموعة.
فتح الحزمة
k this deck
52
The ____________________, the small series of dots at the corners and sides of the chart's border, indicate that the chart is selected.
فتح الحزمة
افتح القفل للوصول البطاقات البالغ عددها 66 في هذه المجموعة.
فتح الحزمة
k this deck
53
Text annotations are ____ that you can add to further describe the data in your chart.
A) arrows
B) titles
C) labels
D) notes
A) arrows
B) titles
C) labels
D) notes
فتح الحزمة
افتح القفل للوصول البطاقات البالغ عددها 66 في هذه المجموعة.
فتح الحزمة
k this deck
54
Describe some of the changes that the Chart Tools Layout tab allows you to make to a chart.
فتح الحزمة
افتح القفل للوصول البطاقات البالغ عددها 66 في هذه المجموعة.
فتح الحزمة
k this deck
55
You can add data labels by selecting your chart, and clicking the Data Labels button in the Labels group in the Chart Tools ____ tab on the Ribbon.
A) Design
B) Layout
C) Format
D) Text
A) Design
B) Layout
C) Format
D) Text
فتح الحزمة
افتح القفل للوصول البطاقات البالغ عددها 66 في هذه المجموعة.
فتح الحزمة
k this deck
56
Discuss the guidelines that you should use for planning a chart.
فتح الحزمة
افتح القفل للوصول البطاقات البالغ عددها 66 في هذه المجموعة.
فتح الحزمة
k this deck
57
As shown in the figure above, item 1 points to a ____.A) vertical axis label
B) horizontal axis label
C) horizontal axis title
D) vertical axis title
فتح الحزمة
افتح القفل للوصول البطاقات البالغ عددها 66 في هذه المجموعة.
فتح الحزمة
k this deck
58
Describe some of the changes that you can make to a chart using the Chart Tools Design tab.
فتح الحزمة
افتح القفل للوصول البطاقات البالغ عددها 66 في هذه المجموعة.
فتح الحزمة
k this deck
59
As shown in the figure above, item 4 points to a ____.A) vertical axis label
B) horizontal axis label
C) horizontal axis title
D) vertical axis title
فتح الحزمة
افتح القفل للوصول البطاقات البالغ عددها 66 في هذه المجموعة.
فتح الحزمة
k this deck
60
____ lets you create diagram types including List, Process, Cycle, Hierarchy, Relationship, Matrix, and Pyramid.
A) SmartArt
B) WordArt
C) ClipArt
D) 3-DArt
A) SmartArt
B) WordArt
C) ClipArt
D) 3-DArt
فتح الحزمة
افتح القفل للوصول البطاقات البالغ عددها 66 في هذه المجموعة.
فتح الحزمة
k this deck
61
Match between columns
فتح الحزمة
افتح القفل للوصول البطاقات البالغ عددها 66 في هذه المجموعة.
فتح الحزمة
k this deck
62
You are having trouble keeping track of your personal spending and you decide to create a worksheet and a chart to help you better understand and plan for your personal expenses. The worksheet and chart are shown below. You want to explain Other Expenses a little more in the chart by using a text annotation. Write the procedure for adding a text box with the text Ex - gym fees, health insurance to the chart.
You want to explain Other Expenses a little more in the chart by using a text annotation. Write the procedure for adding a text box with the text Ex - gym fees, health insurance to the chart. فتح الحزمة
افتح القفل للوصول البطاقات البالغ عددها 66 في هذه المجموعة.
فتح الحزمة
k this deck
63
You are a manager in the Sales department for a clothing store that has three locations. You have prepared the following worksheet containing data about the sales figures for the company, which also has a chart of the data. What are the horizontal axis labels in the chart?
What are the horizontal axis labels in the chart? فتح الحزمة
افتح القفل للوصول البطاقات البالغ عددها 66 في هذه المجموعة.
فتح الحزمة
k this deck
64
You are a manager in the Sales department for a clothing store that has three locations. You have prepared the following worksheet containing data about the sales figures for the company, which also has a chart of the data. Which store location had the highest sales in the 2nd Quarter? Which had the lowest sales in the same quarter?
Which store location had the highest sales in the 2nd Quarter? Which had the lowest sales in the same quarter? فتح الحزمة
افتح القفل للوصول البطاقات البالغ عددها 66 في هذه المجموعة.
فتح الحزمة
k this deck
65
You are a manager in the Sales department for a clothing store that has three locations. You have prepared the following worksheet containing data about the sales figures for the company, which also has a chart of the data. What is the chart type of the chart shown in the figure above? Is it an embedded chart?
What is the chart type of the chart shown in the figure above? Is it an embedded chart? فتح الحزمة
افتح القفل للوصول البطاقات البالغ عددها 66 في هذه المجموعة.
فتح الحزمة
k this deck
66
You are having trouble keeping track of your personal spending and you decide to create a worksheet and a chart to help you better understand and plan for your personal expenses. The worksheet and chart are shown below. You want to explode the slide for Clothing . Write the procedure for doing this.
You want to explode the slide for Clothing . Write the procedure for doing this. فتح الحزمة
افتح القفل للوصول البطاقات البالغ عددها 66 في هذه المجموعة.
فتح الحزمة
k this deck
فتح الحزمة
افتح القفل للوصول البطاقات البالغ عددها 66 في هذه المجموعة.


