Deck 6: Correlational Methods and Statistics
ملء الشاشة (f)
سؤال
سؤال
سؤال
سؤال
سؤال
سؤال
سؤال
سؤال
سؤال
سؤال
سؤال
سؤال
سؤال
سؤال
سؤال
سؤال
سؤال
سؤال
سؤال
سؤال
سؤال
سؤال
سؤال
سؤال
سؤال
سؤال
سؤال
سؤال
سؤال
سؤال
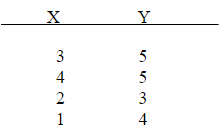
Calculate the Pearson product-moment correlation for the data below.
سؤال
سؤال
سؤال
سؤال
سؤال
سؤال
سؤال
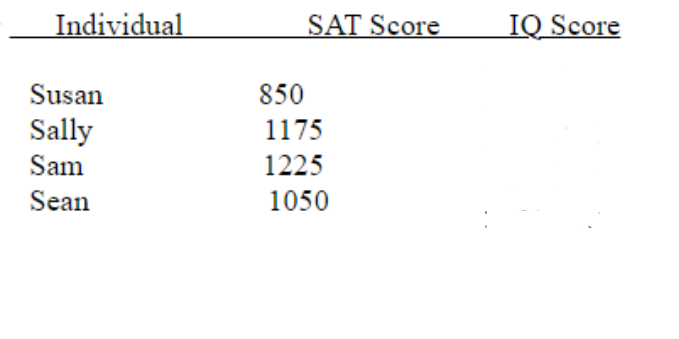
Assume that the regression equation for the relationship between SAT scores and IQ scores is y=9 + 0.105x. What would you expect the IQ score to be for the following individuals given their SAT scores?
سؤال

فتح الحزمة
قم بالتسجيل لفتح البطاقات في هذه المجموعة!
Unlock Deck
Unlock Deck
1/38
العب
ملء الشاشة (f)
Deck 6: Correlational Methods and Statistics
1
A correlation coefficient of 0.00 is to _____ as a correlation coefficient of -1.00 is to _____.
A)no relationship; weak relationship
B)no relationship; perfect relationship
C)weak relationship; no relationship
D)perfect relationship; no relationship
A)no relationship; weak relationship
B)no relationship; perfect relationship
C)weak relationship; no relationship
D)perfect relationship; no relationship
no relationship; perfect relationship
2
General State University recently decided to discontinue its use of the GRE as an admissions tool for its graduate programs because they observed no correlation between GRE scores and subsequent GPAs. Ninety percent of the grades awarded in the graduate programs at General State University are A's. What General State has failed to consider in this situation is the issue of
A)curvilinear relationships.
B)causality.
C)the third-variable problem.
D)restrictive range.
A)curvilinear relationships.
B)causality.
C)the third-variable problem.
D)restrictive range.
restrictive range.
3
The problem of a correlation between two variables being dependent on another variable is called _____.
A)the third-variable problem
B)causality
C)directionality
D)restrictive range
A)the third-variable problem
B)causality
C)directionality
D)restrictive range
the third-variable problem
4
When there is a _____ relationship, as scores on X increase, scores on Y also increase.
A)positive
B)negative
C)curvilinear
D)zero
A)positive
B)negative
C)curvilinear
D)zero
فتح الحزمة
افتح القفل للوصول البطاقات البالغ عددها 38 في هذه المجموعة.
فتح الحزمة
k this deck
5
If the points on a scatterplot are spread all over the graph, this would suggest that the two variables depicted are
A)normally distributed.
B)positively correlated.
C)strongly related.
D)not correlated.
A)normally distributed.
B)positively correlated.
C)strongly related.
D)not correlated.
فتح الحزمة
افتح القفل للوصول البطاقات البالغ عددها 38 في هذه المجموعة.
فتح الحزمة
k this deck
6
The problem of _____ can often be identified by using a _____.
A)causality; point-biserial correlation
B)directionality; phi coefficient
C)third variables; partial correlation
D)restrictive range; point-biserial correlation
A)causality; point-biserial correlation
B)directionality; phi coefficient
C)third variables; partial correlation
D)restrictive range; point-biserial correlation
فتح الحزمة
افتح القفل للوصول البطاقات البالغ عددها 38 في هذه المجموعة.
فتح الحزمة
k this deck
7
Which of the following correlation coefficients represents the variables with the weakest degree of relationship?
A)+0.99
B)‑1.00
C)+0.01
D)‑0.59
A)+0.99
B)‑1.00
C)+0.01
D)‑0.59
فتح الحزمة
افتح القفل للوصول البطاقات البالغ عددها 38 في هذه المجموعة.
فتح الحزمة
k this deck
8
Two variables increasing and decreasing together is to _____ as two variables moving in opposite directions is to _____.
A)no relationship; curvilinear relationship
B)curvilinear relationship; negative relationship
C)positive relationship; negative relationship
D)negative relationship; positive relationship
A)no relationship; curvilinear relationship
B)curvilinear relationship; negative relationship
C)positive relationship; negative relationship
D)negative relationship; positive relationship
فتح الحزمة
افتح القفل للوصول البطاقات البالغ عددها 38 في هذه المجموعة.
فتح الحزمة
k this deck
9
Which of the following correlation coefficients represents the variables with the strongest degree of relationship?
A)+0.99
B)‑1.00
C)+0.01
D)‑0.59
A)+0.99
B)‑1.00
C)+0.01
D)‑0.59
فتح الحزمة
افتح القفل للوصول البطاقات البالغ عددها 38 في هذه المجموعة.
فتح الحزمة
k this deck
10
A correlation coefficient of _____ indicates that the variables form a perfect linear relationship.
A)+1.00
B)‑1.00
C)0.00
D)both +1.00 and -1.00
A)+1.00
B)‑1.00
C)0.00
D)both +1.00 and -1.00
فتح الحزمة
افتح القفل للوصول البطاقات البالغ عددها 38 في هذه المجموعة.
فتح الحزمة
k this deck
11
In the case of a negative relationship, as scores on X _____, scores on Y _____.
A)increase; decrease
B)increase; increase
C)decrease; decrease
D)none of the other alternatives is correct
A)increase; decrease
B)increase; increase
C)decrease; decrease
D)none of the other alternatives is correct
فتح الحزمة
افتح القفل للوصول البطاقات البالغ عددها 38 في هذه المجموعة.
فتح الحزمة
k this deck
12
Jim thought that the strong negative correlation that he observed between depression and self-esteem meant that having a low self-esteem led to high levels of depression. Jim is misinterpreting the correlation by assuming
A)causality.
B)directionality.
C)that there is a third variable.
D)both causality and directionality.
A)causality.
B)directionality.
C)that there is a third variable.
D)both causality and directionality.
فتح الحزمة
افتح القفل للوصول البطاقات البالغ عددها 38 في هذه المجموعة.
فتح الحزمة
k this deck
13
Per the text, we would expect the correlation between smoking and lung cancer to be _____ whereas we would expect the correlation between mountain elevation and temperature to be _____.
A)curvilinear; negative
B)positive; negative
C)negative; positive
D)positive; curvilinear
A)curvilinear; negative
B)positive; negative
C)negative; positive
D)positive; curvilinear
فتح الحزمة
افتح القفل للوصول البطاقات البالغ عددها 38 في هذه المجموعة.
فتح الحزمة
k this deck
14
A correlation coefficient of +1.00 is to _____ as a correlation coefficient of -1.00 is to _____.
A)perfect relationship; perfect relationship
B)perfect relationship; no relationship
C)straight linear relationship; curvilinear relationship
D)curvilinear relationship; straight linear relationship
A)perfect relationship; perfect relationship
B)perfect relationship; no relationship
C)straight linear relationship; curvilinear relationship
D)curvilinear relationship; straight linear relationship
فتح الحزمة
افتح القفل للوصول البطاقات البالغ عددها 38 في هذه المجموعة.
فتح الحزمة
k this deck
15
An indication of the strength of the relationship between two variables is the _____.
A)slope
B)sign
C)scatterplot
D)magnitude
A)slope
B)sign
C)scatterplot
D)magnitude
فتح الحزمة
افتح القفل للوصول البطاقات البالغ عددها 38 في هذه المجموعة.
فتح الحزمة
k this deck
16
A variable that is truncated and has limited variability is said to have _____.
A)directionality
B)a third variable
C)causality
D)a restricted range
A)directionality
B)a third variable
C)causality
D)a restricted range
فتح الحزمة
افتح القفل للوصول البطاقات البالغ عددها 38 في هذه المجموعة.
فتح الحزمة
k this deck
17
In the case of a positive relationship, as scores on X _____, scores on Y _____.
A)increase; decrease
B)decrease; increase
C)decrease; decrease
D)none of the other alternatives is correct
A)increase; decrease
B)decrease; increase
C)decrease; decrease
D)none of the other alternatives is correct
فتح الحزمة
افتح القفل للوصول البطاقات البالغ عددها 38 في هذه المجموعة.
فتح الحزمة
k this deck
18
The _____ indicates the magnitude of a correlation coefficient.
A)slope
B)sign
C)absolute value
D)none of the alternative is correct
A)slope
B)sign
C)absolute value
D)none of the alternative is correct
فتح الحزمة
افتح القفل للوصول البطاقات البالغ عددها 38 في هذه المجموعة.
فتح الحزمة
k this deck
19
When there is a _____ relationship, as scores on X increase, scores on Y decrease.
A)positive
B)negative
C)curvilinear
D)zero
A)positive
B)negative
C)curvilinear
D)zero
فتح الحزمة
افتح القفل للوصول البطاقات البالغ عددها 38 في هذه المجموعة.
فتح الحزمة
k this deck
20
If the points on a scatterplot are clustered in a pattern that extends from the lower left to the upper right, this would suggest that the two variables depicted are
A)normally distributed.
B)positively correlated.
C)regressing toward the average.
D)negatively correlated.
A)normally distributed.
B)positively correlated.
C)regressing toward the average.
D)negatively correlated.
فتح الحزمة
افتح القفل للوصول البطاقات البالغ عددها 38 في هذه المجموعة.
فتح الحزمة
k this deck
21
In a recent study it was found that the correlation between self-esteem and depression was ‑0.64. Explain what this means. Calculate the coefficient of determination for this correlation and explain what information this provides.
فتح الحزمة
افتح القفل للوصول البطاقات البالغ عددها 38 في هذه المجموعة.
فتح الحزمة
k this deck
22
Pam is interested is assessing the degree of relationship between gender and test grades in her psychology class. Pam should use the _____ correlation coefficient to assess this.
A)partial
B)point-biserial
C)phi
D)Pearson product-moment
A)partial
B)point-biserial
C)phi
D)Pearson product-moment
فتح الحزمة
افتح القفل للوصول البطاقات البالغ عددها 38 في هذه المجموعة.
فتح الحزمة
k this deck
23
Explain when each of the correlation coefficients listed below should be used.
فتح الحزمة
افتح القفل للوصول البطاقات البالغ عددها 38 في هذه المجموعة.
فتح الحزمة
k this deck
24
Two nominal variables are to _____ coefficient as two ordinal variables are to _____ coefficient.
A)Pearson product-moment correlation; Spearman rank-order correlation
B)Spearman rank-order correlation; Pearson product-moment correlation
C)phi; Spearman rank-order correlation
D)point-biserial correlation; Spearman rank-order correlation
A)Pearson product-moment correlation; Spearman rank-order correlation
B)Spearman rank-order correlation; Pearson product-moment correlation
C)phi; Spearman rank-order correlation
D)point-biserial correlation; Spearman rank-order correlation
فتح الحزمة
افتح القفل للوصول البطاقات البالغ عددها 38 في هذه المجموعة.
فتح الحزمة
k this deck
25
What is the third-variable problem and how does the partial correlation technique help with this problem?
فتح الحزمة
افتح القفل للوصول البطاقات البالغ عددها 38 في هذه المجموعة.
فتح الحزمة
k this deck
26
What is a person-who argument?
فتح الحزمة
افتح القفل للوصول البطاقات البالغ عددها 38 في هذه المجموعة.
فتح الحزمة
k this deck
27
Two interval/ratio variables are to _____ coefficient as one interval/ratio variable and one nominal variable are to _____ coefficient.
A)Pearson product-moment correlation; Spearman rank-order correlation
B)Spearman rank-order correlation; Pearson product-moment correlation
C)phi; Spearman rank-order correlation
D)Pearson product-moment correlation; point-biserial correlation
A)Pearson product-moment correlation; Spearman rank-order correlation
B)Spearman rank-order correlation; Pearson product-moment correlation
C)phi; Spearman rank-order correlation
D)Pearson product-moment correlation; point-biserial correlation
فتح الحزمة
افتح القفل للوصول البطاقات البالغ عددها 38 في هذه المجموعة.
فتح الحزمة
k this deck
28
The _____ is a measure of the proportion of variance in one of the variables that is accounted for by the other variable.
A)Spearman rank-order correlation coefficient
B)coefficient of determination
C)point-biserial correlation coefficient
D)Pearson product-moment correlation coefficient
A)Spearman rank-order correlation coefficient
B)coefficient of determination
C)point-biserial correlation coefficient
D)Pearson product-moment correlation coefficient
فتح الحزمة
افتح القفل للوصول البطاقات البالغ عددها 38 في هذه المجموعة.
فتح الحزمة
k this deck
29
In a recent study it was found that the correlation between self-esteem and depression was ‑0.64. Tom interprets this to mean that low levels of self-esteem lead to high levels of depression and vice versa. How is Tom misinterpreting these data?
فتح الحزمة
افتح القفل للوصول البطاقات البالغ عددها 38 في هذه المجموعة.
فتح الحزمة
k this deck
30
Calculate the Pearson product-moment correlation for the data below.
فتح الحزمة
افتح القفل للوصول البطاقات البالغ عددها 38 في هذه المجموعة.
فتح الحزمة
k this deck
31
Explain when each of the correlation coefficients listed below should be used.
فتح الحزمة
افتح القفل للوصول البطاقات البالغ عددها 38 في هذه المجموعة.
فتح الحزمة
k this deck
32
Explain how curvilinear relationships can be a problem when interpreting correlation coefficients.
فتح الحزمة
افتح القفل للوصول البطاقات البالغ عددها 38 في هذه المجموعة.
فتح الحزمة
k this deck
33
_____ is a procedure which allows us to predict an individual's score on one variable based on knowing one or more other variables.
A)Pearson product-moment correlation coefficient
B)Coefficient of determination
C)Regression analyses
D)Point-biserial correlation coefficient
A)Pearson product-moment correlation coefficient
B)Coefficient of determination
C)Regression analyses
D)Point-biserial correlation coefficient
فتح الحزمة
افتح القفل للوصول البطاقات البالغ عددها 38 في هذه المجموعة.
فتح الحزمة
k this deck
34
If a correlation coefficient that you expected to be fairly high, turns out to be very low, you should investigate whether there is a
A)restrictive range on one or both variables.
B)curvilinear relationship between the variables.
C)third variable inhibiting the relationship.
D)restrictive range on one or both variables and a curvilinear relationship between the variables.
A)restrictive range on one or both variables.
B)curvilinear relationship between the variables.
C)third variable inhibiting the relationship.
D)restrictive range on one or both variables and a curvilinear relationship between the variables.
فتح الحزمة
افتح القفل للوصول البطاقات البالغ عددها 38 في هذه المجموعة.
فتح الحزمة
k this deck
35
If both variables are measured on a nominal scale, what type of correlation coefficient is appropriate?
A)Spearman's rank-order correlation coefficient
B)phi coefficient
C)point-biserial correlation coefficient
D)none, because correlations cannot be computed on nominal data
A)Spearman's rank-order correlation coefficient
B)phi coefficient
C)point-biserial correlation coefficient
D)none, because correlations cannot be computed on nominal data
فتح الحزمة
افتح القفل للوصول البطاقات البالغ عددها 38 في هذه المجموعة.
فتح الحزمة
k this deck
36
Imagine that you assessed the relationship between the variables of nutrition and general health. Draw the scatterplot depicting what this relationship would look like.
فتح الحزمة
افتح القفل للوصول البطاقات البالغ عددها 38 في هذه المجموعة.
فتح الحزمة
k this deck
37
Assume that the regression equation for the relationship between SAT scores and IQ scores is y=9 + 0.105x. What would you expect the IQ score to be for the following individuals given their SAT scores?
فتح الحزمة
افتح القفل للوصول البطاقات البالغ عددها 38 في هذه المجموعة.
فتح الحزمة
k this deck
38
Suppose that the correlation between height and weight for adults is +0.75. What proportion (or percent) of the variability in weight is accounted for by the relationship with height?
A)75%
B)25%
C)56%
D)unable to determine
A)75%
B)25%
C)56%
D)unable to determine
فتح الحزمة
افتح القفل للوصول البطاقات البالغ عددها 38 في هذه المجموعة.
فتح الحزمة
k this deck
فتح الحزمة
افتح القفل للوصول البطاقات البالغ عددها 38 في هذه المجموعة.


