Deck 3: Frequency Distributions
ملء الشاشة (f)
سؤال
A psychologist is interested in the social interactions of preschool children. She measures the number of verbal interactions that each child at a preschool engages in during a day. Here is the frequency distribution of the data.  The 50th percentile point is _________.
A) 65.50
B) 62.15
C) 65.00
D) 74.00
The 50th percentile point is _________.A) 65.50
B) 62.15
C) 65.00
D) 74.00
سؤال
A researcher has collected some data on the amount of time in seconds (to the nearest 0.1 second) that it took trained rats to run through a maze. The data is shown below arranged in a frequency distribution of grouped scores.  The cumulative percentage for the interval 5.2-5.5 is _________.
A) 13.89%
B) 47.22%
C) 22.22%
D) 36.11%
The cumulative percentage for the interval 5.2-5.5 is _________.A) 13.89%
B) 47.22%
C) 22.22%
D) 36.11%
سؤال
A psychologist is interested in the social interactions of preschool children. She measures the number of verbal interactions that each child at a preschool engages in during a day. Here is the frequency distribution of the data.  The cumulative frequency for the interval 46-55 is _________.
A) 4
B) 9
C) 0.29
D) 13
The cumulative frequency for the interval 46-55 is _________.A) 4
B) 9
C) 0.29
D) 13
سؤال
سؤال
A psychologist is interested in the social interactions of preschool children. She measures the number of verbal interactions that each child at a preschool engages in during a day. Here is the frequency distribution of the data. 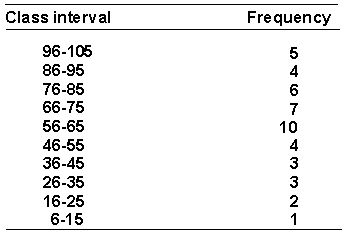 The real limits of the interval 56-65 are _________.
A) 56.5-65.5
B) 55.5-65.5
C) 55-67
D) 56-65
The real limits of the interval 56-65 are _________.A) 56.5-65.5
B) 55.5-65.5
C) 55-67
D) 56-65
سؤال
سؤال
A researcher has collected some data on the amount of time in seconds (to the nearest 0.1 second) that it took trained rats to run through a maze. The data is shown in the frequency distribution of grouped scores that follows.  The percentile rank of a score of 6.5 is _________.
A) 61.81%
B) 59.72%
C) 9.37%
D) 9.03%
The percentile rank of a score of 6.5 is _________.A) 61.81%
B) 59.72%
C) 9.37%
D) 9.03%
سؤال
A psychologist is interested in the social interactions of preschool children. She measures the number of verbal interactions that each child at a preschool engages in during a day. The resulting data are shown in the following frequency distribution.  The relative frequency for the interval 76-85 is _________.
A) 0.13
B) 0.09
C) 0.16
D) 0.11
The relative frequency for the interval 76-85 is _________.A) 0.13
B) 0.09
C) 0.16
D) 0.11
سؤال
Assume your task is to group the raw scores given below into a frequency distribution of approximately 12 intervals of equal width. 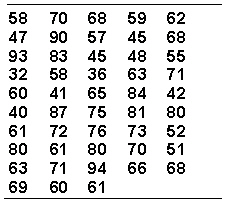 The interval containing the most scores is _________.
A) 60-64
B) 62-66
C) 62-67
D) 60-65
The interval containing the most scores is _________.A) 60-64
B) 62-66
C) 62-67
D) 60-65
سؤال
A researcher has collected some data on the amount of time in seconds (to the nearest 0.1 second) that it took trained rats to run through a maze. The data is shown below arranged in a frequency distribution of grouped scores.  The 75th percentile point is _________.
A) 6.42
B) 6.87
C) 6.82
D) 6.47
The 75th percentile point is _________.A) 6.42
B) 6.87
C) 6.82
D) 6.47
سؤال
A researcher has collected some data on the amount of time in seconds (to the nearest 0.1 second) that it took trained rats to run through a maze. The data is shown below arranged in a frequency distribution of grouped scores. 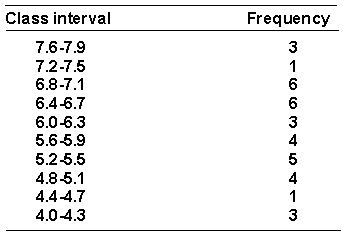 The real limits of the interval 6.4-6.7 are _________.
A) 6.3-6.8
B) 6.4-6.7
C) 6.35-6.75
D) 6.45-6.75
The real limits of the interval 6.4-6.7 are _________.A) 6.3-6.8
B) 6.4-6.7
C) 6.35-6.75
D) 6.45-6.75
سؤال
Assume your task is to group the raw scores given below into a frequency distribution of approximately 12 intervals of equal width.  The value of i is _________.
A) 5.5
B) 4
C) 6
D) 5
The value of i is _________.A) 5.5
B) 4
C) 6
D) 5
سؤال
A psychologist is interested in the social interactions of preschool children. She measures the number of verbal interactions that each child at a preschool engages in during a day. The resulting data are shown in the following frequency distribution.  The percentile rank of a score of 40 is _________.
A) 16.33%
B) 16.00%
C) 9.67%
D) 16.67%
The percentile rank of a score of 40 is _________.A) 16.33%
B) 16.00%
C) 9.67%
D) 16.67%
سؤال
A researcher has collected some data on the amount of time in seconds (to the nearest 0.1 second) that it took trained rats to run through a maze. The data is shown in the frequency distribution of grouped scores that follows. 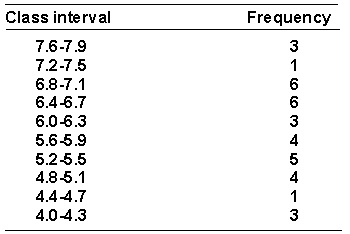 The relative frequency for the interval 5.2-6.6 is _________.
A) 0.03
B) 0.14
C) 0.11
D) 13
The relative frequency for the interval 5.2-6.6 is _________.A) 0.03
B) 0.14
C) 0.11
D) 13
سؤال
سؤال
Assume your task is to group the raw scores given below into a frequency distribution of approximately 12 intervals of equal width.  The lowest class interval is _________.
A) 30-35
B) 32-36
C) 32-37
D) 30-34
The lowest class interval is _________.A) 30-35
B) 32-36
C) 32-37
D) 30-34
سؤال
سؤال
Assume your task is to group the raw scores given below into a frequency distribution of approximately 12 intervals of equal width.  The highest frequency for any interval is _________.
A) 6
B) 8
C) 10
D) 7
The highest frequency for any interval is _________.A) 6
B) 8
C) 10
D) 7
سؤال
A psychologist is interested in the social interactions of preschool children. She measures the number of verbal interactions that each child at a preschool engages in during a day. Here is the frequency distribution of the data.  The cumulative % for the interval 46-55 is _________.
A) 8.89%
B) 20.00%
C) 0.64%
D) 28.89%
The cumulative % for the interval 46-55 is _________.A) 8.89%
B) 20.00%
C) 0.64%
D) 28.89%
سؤال
A researcher has collected some data on the amount of time in seconds (to the nearest 0.1 second) that it took trained rats to run through a maze. The data is shown below arranged in a frequency distribution of grouped scores.  The cumulative frequency for the interval 6.0-6.3 is _________.
A) 20
B) 0.57
C) 17
D) 57
The cumulative frequency for the interval 6.0-6.3 is _________.A) 20
B) 0.57
C) 17
D) 57
سؤال
Given the distribution of grouped scores shown in the following table.  What percentage of cases fall within the class interval containing the most cases?
A) 18.71
B) 26.62
C) 67.63
D) 41.01
What percentage of cases fall within the class interval containing the most cases?A) 18.71
B) 26.62
C) 67.63
D) 41.01
سؤال
سؤال
سؤال
سؤال
Given the distribution of grouped scores shown in the following table.  How many occurrences are there for the interval 60-69?
A) 115
B) 37
C) 15
D) 21
How many occurrences are there for the interval 60-69?A) 115
B) 37
C) 15
D) 21
سؤال
سؤال
سؤال
سؤال
سؤال
سؤال
سؤال
Given the distribution of grouped scores shown in the following table.  How many occurrences fall below the upper real limit of the interval 70-79?
A) 115
B) 137
C) 130
D) 15
How many occurrences fall below the upper real limit of the interval 70-79?A) 115
B) 137
C) 130
D) 15
سؤال
سؤال
Given the distribution of grouped scores shown in the following table. 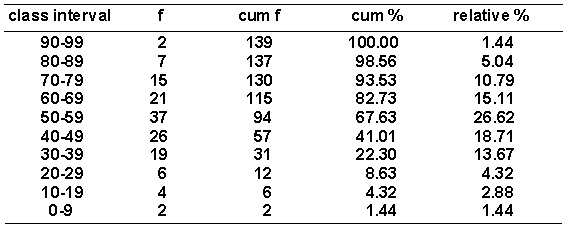 What is the cumulative percentage below the lower real limit of the interval 90-99?
A) 137
B) 5.04
C) 100.00
D) 98.56
What is the cumulative percentage below the lower real limit of the interval 90-99?A) 137
B) 5.04
C) 100.00
D) 98.56
سؤال
Given the distribution of grouped scores shown in the following table.  N equals _______.
A) 139
B) 145
C) 137
D) 135
N equals _______.A) 139
B) 145
C) 137
D) 135
سؤال
سؤال
سؤال
سؤال
سؤال
سؤال
سؤال
سؤال
Consider the following score diagram. 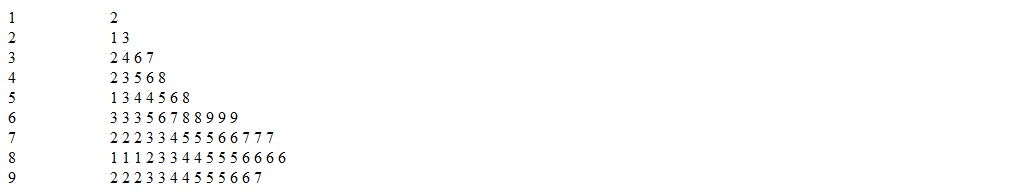 This score diagram is called a _________.
A) histogram
B) frequency polygon
C) box plot
D) stem and leaf diagram
This score diagram is called a _________.A) histogram
B) frequency polygon
C) box plot
D) stem and leaf diagram
سؤال
سؤال
سؤال
سؤال
Consider the following stem-and-leaf diagram. 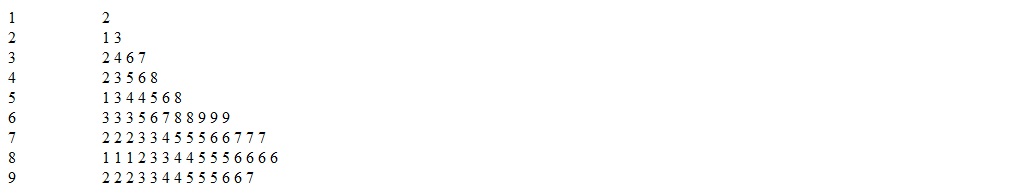 This score distribution is _______.
A) positively skewed
B) negatively skewed
C) symmetrical
D) neither skewed or symmetrical
This score distribution is _______.A) positively skewed
B) negatively skewed
C) symmetrical
D) neither skewed or symmetrical
سؤال
سؤال
سؤال
سؤال
سؤال
سؤال
Given the distribution of grouped scores shown in the following table.  What is the value of i ?
A) 10
B) 9
C) 9.5
D) 10.5
What is the value of i ?A) 10
B) 9
C) 9.5
D) 10.5
سؤال
سؤال
سؤال
سؤال
سؤال
Given the distribution of grouped scores shown in the following table.  The 50th percentile point equals _________.
A) 53.38
B) 52.54
C) 52.88
D) 54.31
The 50th percentile point equals _________.A) 53.38
B) 52.54
C) 52.88
D) 54.31
سؤال
Consider the following stem-and-leaf diagram. 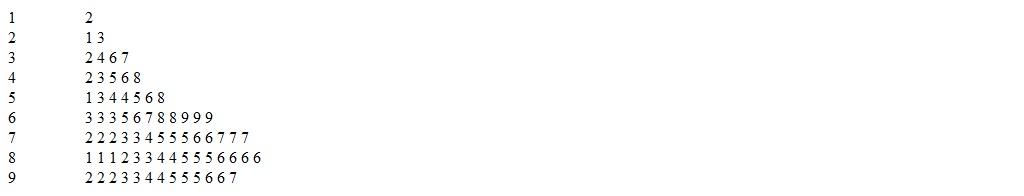 If the numbers in the left column are deciles, the median of the distribution falls in the range of _______.
A) 80 - 90
B) 60 - 69
C) 70 - 79
D) can't answer; need more information
If the numbers in the left column are deciles, the median of the distribution falls in the range of _______.A) 80 - 90
B) 60 - 69
C) 70 - 79
D) can't answer; need more information
سؤال
Given the distribution of grouped scores shown in the following table.  The percentile rank of a score of 41 equals _________.
A) 25.42%
B) 25.11%
C) 16.47%
D) 29.42%
The percentile rank of a score of 41 equals _________.A) 25.42%
B) 25.11%
C) 16.47%
D) 29.42%
سؤال
سؤال
سؤال
سؤال
سؤال
سؤال
For the frequency distribution shown in the following table, N = 4. 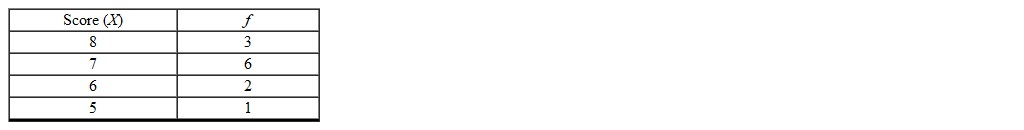
سؤال
سؤال
سؤال
سؤال
سؤال
سؤال
سؤال
سؤال
سؤال
سؤال
سؤال
سؤال
For the frequency distribution shown in the following table, = 25. 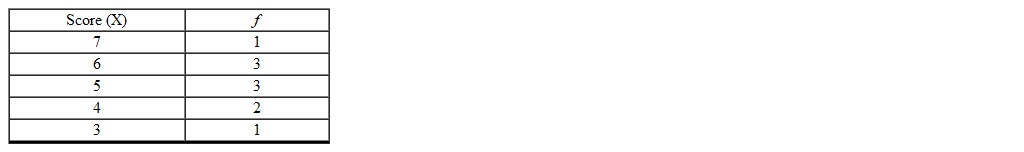
سؤال
سؤال

فتح الحزمة
قم بالتسجيل لفتح البطاقات في هذه المجموعة!
Unlock Deck
Unlock Deck
1/116
العب
ملء الشاشة (f)
Deck 3: Frequency Distributions
1
A psychologist is interested in the social interactions of preschool children. She measures the number of verbal interactions that each child at a preschool engages in during a day. Here is the frequency distribution of the data. The 50th percentile point is _________.
A) 65.50
B) 62.15
C) 65.00
D) 74.00
The 50th percentile point is _________.A) 65.50
B) 62.15
C) 65.00
D) 74.00
65.00
2
A researcher has collected some data on the amount of time in seconds (to the nearest 0.1 second) that it took trained rats to run through a maze. The data is shown below arranged in a frequency distribution of grouped scores. The cumulative percentage for the interval 5.2-5.5 is _________.
A) 13.89%
B) 47.22%
C) 22.22%
D) 36.11%
The cumulative percentage for the interval 5.2-5.5 is _________.A) 13.89%
B) 47.22%
C) 22.22%
D) 36.11%
36.11%
3
A psychologist is interested in the social interactions of preschool children. She measures the number of verbal interactions that each child at a preschool engages in during a day. Here is the frequency distribution of the data. The cumulative frequency for the interval 46-55 is _________.
A) 4
B) 9
C) 0.29
D) 13
The cumulative frequency for the interval 46-55 is _________.A) 4
B) 9
C) 0.29
D) 13
13
4
The distribution of scores of high school seniors on a sixth grade math test would probably be _________.
A) positively skewed
B) negatively skewed
C) normal
D) symmetrical but not normal
A) positively skewed
B) negatively skewed
C) normal
D) symmetrical but not normal
فتح الحزمة
افتح القفل للوصول البطاقات البالغ عددها 116 في هذه المجموعة.
فتح الحزمة
k this deck
5
A psychologist is interested in the social interactions of preschool children. She measures the number of verbal interactions that each child at a preschool engages in during a day. Here is the frequency distribution of the data. The real limits of the interval 56-65 are _________.
A) 56.5-65.5
B) 55.5-65.5
C) 55-67
D) 56-65
The real limits of the interval 56-65 are _________.A) 56.5-65.5
B) 55.5-65.5
C) 55-67
D) 56-65
فتح الحزمة
افتح القفل للوصول البطاقات البالغ عددها 116 في هذه المجموعة.
فتح الحزمة
k this deck
6
If a curve is symmetrical, _________.
A) most of the scores fall at the lower values of the X axis
B) most of the scores fall at the higher values of the X axis
C) if folded in half, the two sides of the curve coincide
D) most of the scores fall at the higher values of the Y axis
A) most of the scores fall at the lower values of the X axis
B) most of the scores fall at the higher values of the X axis
C) if folded in half, the two sides of the curve coincide
D) most of the scores fall at the higher values of the Y axis
فتح الحزمة
افتح القفل للوصول البطاقات البالغ عددها 116 في هذه المجموعة.
فتح الحزمة
k this deck
7
A researcher has collected some data on the amount of time in seconds (to the nearest 0.1 second) that it took trained rats to run through a maze. The data is shown in the frequency distribution of grouped scores that follows. The percentile rank of a score of 6.5 is _________.
A) 61.81%
B) 59.72%
C) 9.37%
D) 9.03%
The percentile rank of a score of 6.5 is _________.A) 61.81%
B) 59.72%
C) 9.37%
D) 9.03%
فتح الحزمة
افتح القفل للوصول البطاقات البالغ عددها 116 في هذه المجموعة.
فتح الحزمة
k this deck
8
A psychologist is interested in the social interactions of preschool children. She measures the number of verbal interactions that each child at a preschool engages in during a day. The resulting data are shown in the following frequency distribution. The relative frequency for the interval 76-85 is _________.
A) 0.13
B) 0.09
C) 0.16
D) 0.11
The relative frequency for the interval 76-85 is _________.A) 0.13
B) 0.09
C) 0.16
D) 0.11
فتح الحزمة
افتح القفل للوصول البطاقات البالغ عددها 116 في هذه المجموعة.
فتح الحزمة
k this deck
9
Assume your task is to group the raw scores given below into a frequency distribution of approximately 12 intervals of equal width. The interval containing the most scores is _________.
A) 60-64
B) 62-66
C) 62-67
D) 60-65
The interval containing the most scores is _________.A) 60-64
B) 62-66
C) 62-67
D) 60-65
فتح الحزمة
افتح القفل للوصول البطاقات البالغ عددها 116 في هذه المجموعة.
فتح الحزمة
k this deck
10
A researcher has collected some data on the amount of time in seconds (to the nearest 0.1 second) that it took trained rats to run through a maze. The data is shown below arranged in a frequency distribution of grouped scores. The 75th percentile point is _________.
A) 6.42
B) 6.87
C) 6.82
D) 6.47
The 75th percentile point is _________.A) 6.42
B) 6.87
C) 6.82
D) 6.47
فتح الحزمة
افتح القفل للوصول البطاقات البالغ عددها 116 في هذه المجموعة.
فتح الحزمة
k this deck
11
A researcher has collected some data on the amount of time in seconds (to the nearest 0.1 second) that it took trained rats to run through a maze. The data is shown below arranged in a frequency distribution of grouped scores. The real limits of the interval 6.4-6.7 are _________.
A) 6.3-6.8
B) 6.4-6.7
C) 6.35-6.75
D) 6.45-6.75
The real limits of the interval 6.4-6.7 are _________.A) 6.3-6.8
B) 6.4-6.7
C) 6.35-6.75
D) 6.45-6.75
فتح الحزمة
افتح القفل للوصول البطاقات البالغ عددها 116 في هذه المجموعة.
فتح الحزمة
k this deck
12
Assume your task is to group the raw scores given below into a frequency distribution of approximately 12 intervals of equal width. The value of i is _________.
A) 5.5
B) 4
C) 6
D) 5
The value of i is _________.A) 5.5
B) 4
C) 6
D) 5
فتح الحزمة
افتح القفل للوصول البطاقات البالغ عددها 116 في هذه المجموعة.
فتح الحزمة
k this deck
13
A psychologist is interested in the social interactions of preschool children. She measures the number of verbal interactions that each child at a preschool engages in during a day. The resulting data are shown in the following frequency distribution. The percentile rank of a score of 40 is _________.
A) 16.33%
B) 16.00%
C) 9.67%
D) 16.67%
The percentile rank of a score of 40 is _________.A) 16.33%
B) 16.00%
C) 9.67%
D) 16.67%
فتح الحزمة
افتح القفل للوصول البطاقات البالغ عددها 116 في هذه المجموعة.
فتح الحزمة
k this deck
14
A researcher has collected some data on the amount of time in seconds (to the nearest 0.1 second) that it took trained rats to run through a maze. The data is shown in the frequency distribution of grouped scores that follows. The relative frequency for the interval 5.2-6.6 is _________.
A) 0.03
B) 0.14
C) 0.11
D) 13
The relative frequency for the interval 5.2-6.6 is _________.A) 0.03
B) 0.14
C) 0.11
D) 13
فتح الحزمة
افتح القفل للوصول البطاقات البالغ عددها 116 في هذه المجموعة.
فتح الحزمة
k this deck
15
If a large psychology class took a test on theoretical biophysics, the distribution of scores would probably be _________.
A) positively skewed
B) symmetrical
C) negatively skewed
D) ogival
A) positively skewed
B) symmetrical
C) negatively skewed
D) ogival
فتح الحزمة
افتح القفل للوصول البطاقات البالغ عددها 116 في هذه المجموعة.
فتح الحزمة
k this deck
16
Assume your task is to group the raw scores given below into a frequency distribution of approximately 12 intervals of equal width. The lowest class interval is _________.
A) 30-35
B) 32-36
C) 32-37
D) 30-34
The lowest class interval is _________.A) 30-35
B) 32-36
C) 32-37
D) 30-34
فتح الحزمة
افتح القفل للوصول البطاقات البالغ عددها 116 في هذه المجموعة.
فتح الحزمة
k this deck
17
An accountant is preparing a graph showing the number of sports cars of various makers purchased this year. The number will be plotted on the ordinate and the various manufacturers on the abscissa. The proper type of graph for this data is a(n) _________.
A) frequency polygon
B) histogram
C) bar graph
D) ogive
A) frequency polygon
B) histogram
C) bar graph
D) ogive
فتح الحزمة
افتح القفل للوصول البطاقات البالغ عددها 116 في هذه المجموعة.
فتح الحزمة
k this deck
18
Assume your task is to group the raw scores given below into a frequency distribution of approximately 12 intervals of equal width. The highest frequency for any interval is _________.
A) 6
B) 8
C) 10
D) 7
The highest frequency for any interval is _________.A) 6
B) 8
C) 10
D) 7
فتح الحزمة
افتح القفل للوصول البطاقات البالغ عددها 116 في هذه المجموعة.
فتح الحزمة
k this deck
19
A psychologist is interested in the social interactions of preschool children. She measures the number of verbal interactions that each child at a preschool engages in during a day. Here is the frequency distribution of the data. The cumulative % for the interval 46-55 is _________.
A) 8.89%
B) 20.00%
C) 0.64%
D) 28.89%
The cumulative % for the interval 46-55 is _________.A) 8.89%
B) 20.00%
C) 0.64%
D) 28.89%
فتح الحزمة
افتح القفل للوصول البطاقات البالغ عددها 116 في هذه المجموعة.
فتح الحزمة
k this deck
20
A researcher has collected some data on the amount of time in seconds (to the nearest 0.1 second) that it took trained rats to run through a maze. The data is shown below arranged in a frequency distribution of grouped scores. The cumulative frequency for the interval 6.0-6.3 is _________.
A) 20
B) 0.57
C) 17
D) 57
The cumulative frequency for the interval 6.0-6.3 is _________.A) 20
B) 0.57
C) 17
D) 57
فتح الحزمة
افتح القفل للوصول البطاقات البالغ عددها 116 في هذه المجموعة.
فتح الحزمة
k this deck
21
Given the distribution of grouped scores shown in the following table. What percentage of cases fall within the class interval containing the most cases?
A) 18.71
B) 26.62
C) 67.63
D) 41.01
What percentage of cases fall within the class interval containing the most cases?A) 18.71
B) 26.62
C) 67.63
D) 41.01
فتح الحزمة
افتح القفل للوصول البطاقات البالغ عددها 116 في هذه المجموعة.
فتح الحزمة
k this deck
22
In graphing frequency distributions, _________ is usually plotted on the abscissa.
A) frequency
B) class width
C) the score value
D) interval width
A) frequency
B) class width
C) the score value
D) interval width
فتح الحزمة
افتح القفل للوصول البطاقات البالغ عددها 116 في هذه المجموعة.
فتح الحزمة
k this deck
23
What indicates the proportion of the total number of scores that occurred in each interval?
A) relative frequency distribution
B) cumulative frequency distribution
C) cumulative percentage distribution
D) none of these
A) relative frequency distribution
B) cumulative frequency distribution
C) cumulative percentage distribution
D) none of these
فتح الحزمة
افتح القفل للوصول البطاقات البالغ عددها 116 في هذه المجموعة.
فتح الحزمة
k this deck
24
What indicates the number of scores that fell below the upper real limit of each interval?
A) relative frequency distribution
B) cumulative frequency distribution
C) cumulative percentage distribution
D) none of these
A) relative frequency distribution
B) cumulative frequency distribution
C) cumulative percentage distribution
D) none of these
فتح الحزمة
افتح القفل للوصول البطاقات البالغ عددها 116 في هذه المجموعة.
فتح الحزمة
k this deck
25
Given the distribution of grouped scores shown in the following table. How many occurrences are there for the interval 60-69?
A) 115
B) 37
C) 15
D) 21
How many occurrences are there for the interval 60-69?A) 115
B) 37
C) 15
D) 21
فتح الحزمة
افتح القفل للوصول البطاقات البالغ عددها 116 في هذه المجموعة.
فتح الحزمة
k this deck
26
The purpose of a frequency distribution is to _________.
A) present scores and their frequency of occurrence
B) present data in a more meaningful way than just presenting the raw scores
C) provide more information than a graph
D) all of the above
E) a and b
A) present scores and their frequency of occurrence
B) present data in a more meaningful way than just presenting the raw scores
C) provide more information than a graph
D) all of the above
E) a and b
فتح الحزمة
افتح القفل للوصول البطاقات البالغ عددها 116 في هذه المجموعة.
فتح الحزمة
k this deck
27
If i = 7, the scores are integer, and the minimum value of the distribution of scores is 8, what would the lowest class interval be?
A) 0-7
B) 7-14
C) 8-16
D) 8-15
E) 7-13
A) 0-7
B) 7-14
C) 8-16
D) 8-15
E) 7-13
فتح الحزمة
افتح القفل للوصول البطاقات البالغ عددها 116 في هذه المجموعة.
فتح الحزمة
k this deck
28
The range of a set of scores with a maximum value of 92 and a minimum value of 26 is _________.
A) 65
B) 66
C) 67
D) 92
A) 65
B) 66
C) 67
D) 92
فتح الحزمة
افتح القفل للوصول البطاقات البالغ عددها 116 في هذه المجموعة.
فتح الحزمة
k this deck
29
The true limits of 7.0 are _________.
A) 6.5-7.5
B) 6.0-8.0
C) 7.0-7.1
D) 6.95-7.05
A) 6.5-7.5
B) 6.0-8.0
C) 7.0-7.1
D) 6.95-7.05
فتح الحزمة
افتح القفل للوصول البطاقات البالغ عددها 116 في هذه المجموعة.
فتح الحزمة
k this deck
30
Which of the following is (are) not a symmetrical distribution?
A) a bell-shaped curve
B) a J-shaped curve
C) a rectangular curve
D) an inverted U-shaped curve
E) a bell-shaped, J-shaped, and an inverted U-shaped curve
A) a bell-shaped curve
B) a J-shaped curve
C) a rectangular curve
D) an inverted U-shaped curve
E) a bell-shaped, J-shaped, and an inverted U-shaped curve
فتح الحزمة
افتح القفل للوصول البطاقات البالغ عددها 116 في هذه المجموعة.
فتح الحزمة
k this deck
31
Interval or ratio data may be plotted as a _________.
A) bar graph
B) histogram
C) frequency polygon
D) b and c
A) bar graph
B) histogram
C) frequency polygon
D) b and c
فتح الحزمة
افتح القفل للوصول البطاقات البالغ عددها 116 في هذه المجموعة.
فتح الحزمة
k this deck
32
Given the distribution of grouped scores shown in the following table. How many occurrences fall below the upper real limit of the interval 70-79?
A) 115
B) 137
C) 130
D) 15
How many occurrences fall below the upper real limit of the interval 70-79?A) 115
B) 137
C) 130
D) 15
فتح الحزمة
افتح القفل للوصول البطاقات البالغ عددها 116 في هذه المجموعة.
فتح الحزمة
k this deck
33
If the range of a distribution were 89 and the data were reported as whole numbers, what would the width of the class interval be if one chose to group the distribution into approximately 14 class intervals?
A) 14
B) 89
C) 5
D) 6
E) 7
A) 14
B) 89
C) 5
D) 6
E) 7
فتح الحزمة
افتح القفل للوصول البطاقات البالغ عددها 116 في هذه المجموعة.
فتح الحزمة
k this deck
34
Given the distribution of grouped scores shown in the following table. What is the cumulative percentage below the lower real limit of the interval 90-99?
A) 137
B) 5.04
C) 100.00
D) 98.56
What is the cumulative percentage below the lower real limit of the interval 90-99?A) 137
B) 5.04
C) 100.00
D) 98.56
فتح الحزمة
افتح القفل للوصول البطاقات البالغ عددها 116 في هذه المجموعة.
فتح الحزمة
k this deck
35
Given the distribution of grouped scores shown in the following table. N equals _______.
A) 139
B) 145
C) 137
D) 135
N equals _______.A) 139
B) 145
C) 137
D) 135
فتح الحزمة
افتح القفل للوصول البطاقات البالغ عددها 116 في هذه المجموعة.
فتح الحزمة
k this deck
36
Your new Mercedes weighs 1850 kilograms when measured to the nearest kilogram. The real limits of its weight are _________.
A) 1800-1900
B) 1840-1860
C) 1849-1851
D) 1849.5-1850.5
A) 1800-1900
B) 1840-1860
C) 1849-1851
D) 1849.5-1850.5
فتح الحزمة
افتح القفل للوصول البطاقات البالغ عددها 116 في هذه المجموعة.
فتح الحزمة
k this deck
37
When constructing bar graphs, the bars do not touch each other because _______.
A) it looks nicer
B) it emphasizes the lack of quantitative relationship between the categories
C) it is traditional
D) none of these
A) it looks nicer
B) it emphasizes the lack of quantitative relationship between the categories
C) it is traditional
D) none of these
فتح الحزمة
افتح القفل للوصول البطاقات البالغ عددها 116 في هذه المجموعة.
فتح الحزمة
k this deck
38
A distribution which has a predominance of scores at the lower values of the distribution and which tails off at the higher end is _______.
A) positively skewed
B) negatively skewed
C) normally distributed
D) symmetrical
A) positively skewed
B) negatively skewed
C) normally distributed
D) symmetrical
فتح الحزمة
افتح القفل للوصول البطاقات البالغ عددها 116 في هذه المجموعة.
فتح الحزمة
k this deck
39
In a frequency polygon the points are plotted over _______ at a height corresponding to the frequency of the interval.
A) the midpoint of each interval
B) the lower real limit
C) the upper real limit
D) none of these
A) the midpoint of each interval
B) the lower real limit
C) the upper real limit
D) none of these
فتح الحزمة
افتح القفل للوصول البطاقات البالغ عددها 116 في هذه المجموعة.
فتح الحزمة
k this deck
40
When individual scores are combined into groups, _________.
A) information is lost
B) data is added
C) a meaningful visual display can result depending on the interval width
D) information is lost and data is added
A) information is lost
B) data is added
C) a meaningful visual display can result depending on the interval width
D) information is lost and data is added
فتح الحزمة
افتح القفل للوصول البطاقات البالغ عددها 116 في هذه المجموعة.
فتح الحزمة
k this deck
41
All frequency distributions should be of grouped scores.
فتح الحزمة
افتح القفل للوصول البطاقات البالغ عددها 116 في هذه المجموعة.
فتح الحزمة
k this deck
42
In grouping scores, the wider the intervals, the more information that is lost.
فتح الحزمة
افتح القفل للوصول البطاقات البالغ عددها 116 في هذه المجموعة.
فتح الحزمة
k this deck
43
Consider the following score diagram. This score diagram is called a _________.
A) histogram
B) frequency polygon
C) box plot
D) stem and leaf diagram
This score diagram is called a _________.A) histogram
B) frequency polygon
C) box plot
D) stem and leaf diagram
فتح الحزمة
افتح القفل للوصول البطاقات البالغ عددها 116 في هذه المجموعة.
فتح الحزمة
k this deck
44
In constructing a frequency distribution of grouped scores, i should be rounded to one more decimal place than in the raw scores.
فتح الحزمة
افتح القفل للوصول البطاقات البالغ عددها 116 في هذه المجموعة.
فتح الحزمة
k this deck
45
If a curve is negatively skewed, most of the scores occur at the higher values and the curve tails off toward the lower end of the horizontal axis.
فتح الحزمة
افتح القفل للوصول البطاقات البالغ عددها 116 في هذه المجموعة.
فتح الحزمة
k this deck
46
A bell shaped curve is an example of a skewed distribution.
فتح الحزمة
افتح القفل للوصول البطاقات البالغ عددها 116 في هذه المجموعة.
فتح الحزمة
k this deck
47
Consider the following stem-and-leaf diagram. This score distribution is _______.
A) positively skewed
B) negatively skewed
C) symmetrical
D) neither skewed or symmetrical
This score distribution is _______.A) positively skewed
B) negatively skewed
C) symmetrical
D) neither skewed or symmetrical
فتح الحزمة
افتح القفل للوصول البطاقات البالغ عددها 116 في هذه المجموعة.
فتح الحزمة
k this deck
48
The percentile point for a distribution of scores must have a value equal to one of the scores.
فتح الحزمة
افتح القفل للوصول البطاقات البالغ عددها 116 في هذه المجموعة.
فتح الحزمة
k this deck
49
A percentile point is defined as _________.
A) the percentage of scores that fall below a specified scale value
B) the value on the measurement scale below which a specified percentage of the scores fall
C) P50
D) P20
A) the percentage of scores that fall below a specified scale value
B) the value on the measurement scale below which a specified percentage of the scores fall
C) P50
D) P20
فتح الحزمة
افتح القفل للوصول البطاقات البالغ عددها 116 في هذه المجموعة.
فتح الحزمة
k this deck
50
In constructing a frequency distribution of grouped scores, the intervals must be continuous and mutually exclusive.
فتح الحزمة
افتح القفل للوصول البطاقات البالغ عددها 116 في هذه المجموعة.
فتح الحزمة
k this deck
51
If the frequency of any score is zero, it should not be listed in a frequency distribution.
فتح الحزمة
افتح القفل للوصول البطاقات البالغ عددها 116 في هذه المجموعة.
فتح الحزمة
k this deck
52
The percentile rank of a score is defined as _________.
A) the percentage of scores that fall below the score in question
B) the percentage of scores that fall below a specified scale value
C) the number of scores that fall below the score in question
D) a and b
A) the percentage of scores that fall below the score in question
B) the percentage of scores that fall below a specified scale value
C) the number of scores that fall below the score in question
D) a and b
فتح الحزمة
افتح القفل للوصول البطاقات البالغ عددها 116 في هذه المجموعة.
فتح الحزمة
k this deck
53
Given the distribution of grouped scores shown in the following table. What is the value of i ?
A) 10
B) 9
C) 9.5
D) 10.5
What is the value of i ?A) 10
B) 9
C) 9.5
D) 10.5
فتح الحزمة
افتح القفل للوصول البطاقات البالغ عددها 116 في هذه المجموعة.
فتح الحزمة
k this deck
54
In a frequency distribution of grouped scores, all intervals should be of exactly the same width.
فتح الحزمة
افتح القفل للوصول البطاقات البالغ عددها 116 في هذه المجموعة.
فتح الحزمة
k this deck
55
A curve is negatively skewed when _________.
A) most of the scores occur at the lower end of the horizontal axis and the curve tails off toward the higher end
B) it is folded in half and the two sides do not coincide
C) most of the scores occur at the higher end of the horizontal axis and the curve tails off toward the lower end.
D) b and c
A) most of the scores occur at the lower end of the horizontal axis and the curve tails off toward the higher end
B) it is folded in half and the two sides do not coincide
C) most of the scores occur at the higher end of the horizontal axis and the curve tails off toward the lower end.
D) b and c
فتح الحزمة
افتح القفل للوصول البطاقات البالغ عددها 116 في هذه المجموعة.
فتح الحزمة
k this deck
56
A histogram is like a bar graph except with a histogram the bars don't touch each other.
فتح الحزمة
افتح القفل للوصول البطاقات البالغ عددها 116 في هذه المجموعة.
فتح الحزمة
k this deck
57
A frequency polygon results in a curve that looks as though the scores were continuously distributed.
فتح الحزمة
افتح القفل للوصول البطاقات البالغ عددها 116 في هذه المجموعة.
فتح الحزمة
k this deck
58
Given the distribution of grouped scores shown in the following table. The 50th percentile point equals _________.
A) 53.38
B) 52.54
C) 52.88
D) 54.31
The 50th percentile point equals _________.A) 53.38
B) 52.54
C) 52.88
D) 54.31
فتح الحزمة
افتح القفل للوصول البطاقات البالغ عددها 116 في هذه المجموعة.
فتح الحزمة
k this deck
59
Consider the following stem-and-leaf diagram. If the numbers in the left column are deciles, the median of the distribution falls in the range of _______.
A) 80 - 90
B) 60 - 69
C) 70 - 79
D) can't answer; need more information
If the numbers in the left column are deciles, the median of the distribution falls in the range of _______.A) 80 - 90
B) 60 - 69
C) 70 - 79
D) can't answer; need more information
فتح الحزمة
افتح القفل للوصول البطاقات البالغ عددها 116 في هذه المجموعة.
فتح الحزمة
k this deck
60
Given the distribution of grouped scores shown in the following table. The percentile rank of a score of 41 equals _________.
A) 25.42%
B) 25.11%
C) 16.47%
D) 29.42%
The percentile rank of a score of 41 equals _________.A) 25.42%
B) 25.11%
C) 16.47%
D) 29.42%
فتح الحزمة
افتح القفل للوصول البطاقات البالغ عددها 116 في هذه المجموعة.
فتح الحزمة
k this deck
61
When constructing the frequency distribution it is customary to show the real limits of the class intervals in the table.
فتح الحزمة
افتح القفل للوصول البطاقات البالغ عددها 116 في هذه المجموعة.
فتح الحزمة
k this deck
62
A "U" shaped distribution is an example of a symmetrical distribution.
فتح الحزمة
افتح القفل للوصول البطاقات البالغ عددها 116 في هذه المجموعة.
فتح الحزمة
k this deck
63
A frequency distribution of grouped scores is used for distributions that have relatively few scores to stretch them out.
فتح الحزمة
افتح القفل للوصول البطاقات البالغ عددها 116 في هذه المجموعة.
فتح الحزمة
k this deck
64
A frequency distribution presents the score values and their frequency of occurrence.
فتح الحزمة
افتح القفل للوصول البطاقات البالغ عددها 116 في هذه المجموعة.
فتح الحزمة
k this deck
65
A relative frequency distribution indicates the number of scores that fall below the upper real limit of each interval.
فتح الحزمة
افتح القفل للوصول البطاقات البالغ عددها 116 في هذه المجموعة.
فتح الحزمة
k this deck
66
For the frequency distribution shown in the following table, N = 4.
فتح الحزمة
افتح القفل للوصول البطاقات البالغ عددها 116 في هذه المجموعة.
فتح الحزمة
k this deck
67
When constructing frequency distributions there must be 12 class intervals.
فتح الحزمة
افتح القفل للوصول البطاقات البالغ عددها 116 في هذه المجموعة.
فتح الحزمة
k this deck
68
One reason for constructing frequency distributions is to be able to visualize the shape of the distribution.
فتح الحزمة
افتح القفل للوصول البطاقات البالغ عددها 116 في هذه المجموعة.
فتح الحزمة
k this deck
69
In a cumulative percentage curve, percentage is shown on the abscissa.
فتح الحزمة
افتح القفل للوصول البطاقات البالغ عددها 116 في هذه المجموعة.
فتح الحزمة
k this deck
70
To determine the width of the class interval, i, divide the range by the number of class intervals.
فتح الحزمة
افتح القفل للوصول البطاقات البالغ عددها 116 في هذه المجموعة.
فتح الحزمة
k this deck
71
Bar graphs are generally used for nominal or ordinal data and histograms are generally used for interval or ratio data.
فتح الحزمة
افتح القفل للوصول البطاقات البالغ عددها 116 في هذه المجموعة.
فتح الحزمة
k this deck
72
A stem and leaf diagram contains more information than a histogram.
فتح الحزمة
افتح القفل للوصول البطاقات البالغ عددها 116 في هذه المجموعة.
فتح الحزمة
k this deck
73
When constructing a distribution of grouped scores, the only requirement regarding the lower limit of the lowest interval is that the interval includes the lowest score in the distribution.
فتح الحزمة
افتح القفل للوصول البطاقات البالغ عددها 116 في هذه المجموعة.
فتح الحزمة
k this deck
74
In a frequency distribution the more intervals the better, regardless of whether some intervals have zero frequency.
فتح الحزمة
افتح القفل للوصول البطاقات البالغ عددها 116 في هذه المجموعة.
فتح الحزمة
k this deck
75
A cumulative frequency distribution indicates the number of scores which fell below the upper real limit of each interval.
فتح الحزمة
افتح القفل للوصول البطاقات البالغ عددها 116 في هذه المجموعة.
فتح الحزمة
k this deck
76
A relative frequency distribution indicates the total number of scores which occurred in each interval.
فتح الحزمة
افتح القفل للوصول البطاقات البالغ عددها 116 في هذه المجموعة.
فتح الحزمة
k this deck
77
The vertical axis, i.e., the Y axis of a graph, is called the abscissa.
فتح الحزمة
افتح القفل للوصول البطاقات البالغ عددها 116 في هذه المجموعة.
فتح الحزمة
k this deck
78
For the frequency distribution shown in the following table, = 25.
فتح الحزمة
افتح القفل للوصول البطاقات البالغ عددها 116 في هذه المجموعة.
فتح الحزمة
k this deck
79
Given a distribution of grouped scores, if an interval is shown as 2-8, the interval is 6 units wide
فتح الحزمة
افتح القفل للوصول البطاقات البالغ عددها 116 في هذه المجموعة.
فتح الحزمة
k this deck
80
The percentile rank of a score is equal to the percentage of scores in the distribution that fall below the score in question.
فتح الحزمة
افتح القفل للوصول البطاقات البالغ عددها 116 في هذه المجموعة.
فتح الحزمة
k this deck
فتح الحزمة
افتح القفل للوصول البطاقات البالغ عددها 116 في هذه المجموعة.


