Deck 8: Analyzing Inequalities in Education
ملء الشاشة (f)
سؤال
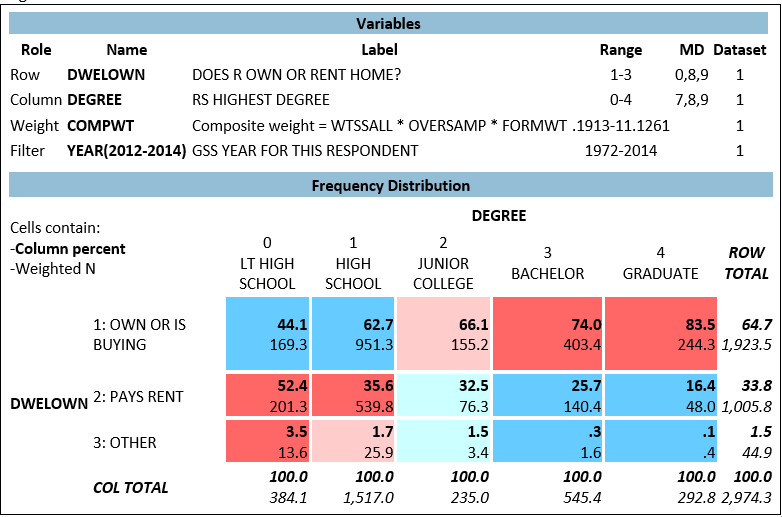 A team of researchers is interested to know whether educational attainment affects the likelihood of owning or renting a home. They create a cross-tab with DWELOWN (Do you/Does your family) own your (home/apartment), pay rent, or what?") and DEGREE (respondents' highest educational degree), using a filter of "YEAR (2010-2014)." Figure 8.1 shows the resulting analysis.
-The variable DWELOWN is best described as:
A) a dummy variable.
B) a categorical variable.
C) an ordinal variable.
D) an interval-ration level variable.
سؤال
A team of researchers is interested to know whether educational attainment affects the likelihood of owning or renting a home. They create a cross-tab with DWELOWN (Do you/Does your family) own your (home/apartment), pay rent, or what?") and DEGREE (respondents' highest educational degree), using a filter of "YEAR (2010-2014)." Figure 8.1 shows the resulting analysis.-The variable DEGREE is best described as:
A) a dummy variable.
B) a categorical variable.
C) an ordinal variable.
D) an interval-ration level variable.
سؤال
A team of researchers is interested to know whether educational attainment affects the likelihood of owning or renting a home. They create a cross-tab with DWELOWN (Do you/Does your family) own your (home/apartment), pay rent, or what?") and DEGREE (respondents' highest educational degree), using a filter of "YEAR (2010-2014)." Figure 8.1 shows the resulting analysis.-In general, as respondents' educational attainment increases, the percentage of those who say they "pay rent" for their current home:
A) decreases
B) increases
C) stays about the same
سؤال
A team of researchers is interested to know whether educational attainment affects the likelihood of owning or renting a home. They create a cross-tab with DWELOWN (Do you/Does your family) own your (home/apartment), pay rent, or what?") and DEGREE (respondents' highest educational degree), using a filter of "YEAR (2010-2014)." Figure 8.1 shows the resulting analysis.-For respondents with less than a high school education, the modal category for the variable DWELOWN is:
A) owns or is buying
B) pays rent
C) other
D) cannot be determined by the information presented in Figure 8.1
سؤال
A team of researchers is interested to know whether educational attainment affects the likelihood of owning or renting a home. They create a cross-tab with DWELOWN (Do you/Does your family) own your (home/apartment), pay rent, or what?") and DEGREE (respondents' highest educational degree), using a filter of "YEAR (2010-2014)." Figure 8.1 shows the resulting analysis.-What percentage of respondents with a graduate degree owned their home or were in the process of buying it?
A) 44%
B) 62.7%
C) 74.6%
D) 83%
سؤال
A team of researchers is interested to know whether educational attainment affects the likelihood of owning or renting a home. They create a cross-tab with DWELOWN (Do you/Does your family) own your (home/apartment), pay rent, or what?") and DEGREE (respondents' highest educational degree), using a filter of "YEAR (2010-2014)." Figure 8.1 shows the resulting analysis.-Which of the following statements best interprets the value of 16.4 in Figure 8.1?
A) Approximately 16 people with a graduate degree reported that they were currently renting.
B) 16.4 % of those who were currently renting their homes reported holding a graduate degree.
C) 16.4 % of those with a graduate degree reported that they were currently paying rent.
D) Of all respondents represented in the Figure, 16.4 were people who held a graduate degree and were currently renting their homes.
سؤال
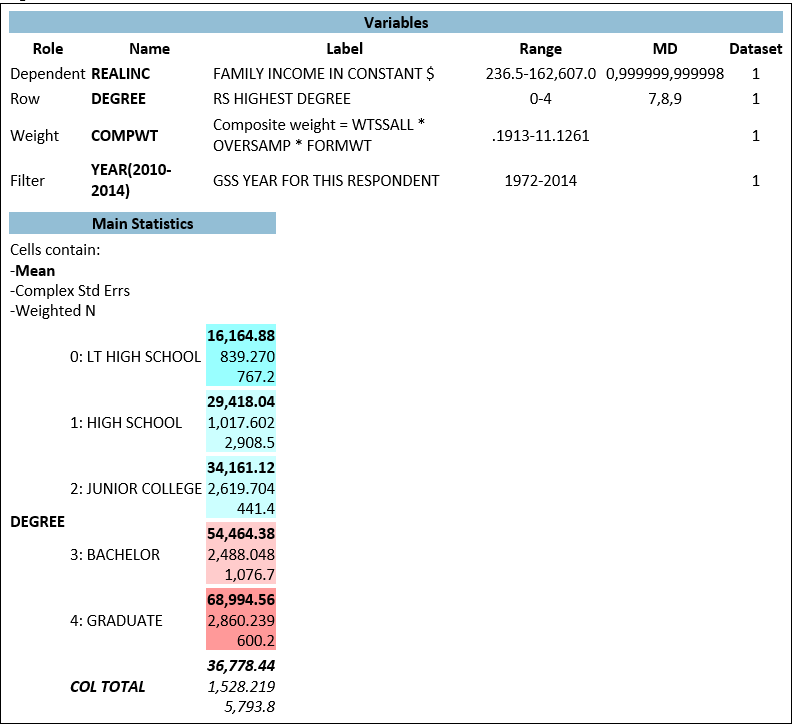 A team of researchers is interested to know whether respondents' education is related to their personal income. They conduct a comparison of means with the variable REALINC (Respondent's personal annual income, measured in dollars) as the dependent variable and DEGREE as the "Row" variable, and use a filter of YEAR (2010-2014). The resulting analysis is shown in Figure 8.2
-The value of 16,164.88 in Figure 8.2 indicates that:
A) Approximately 16,165 respondents reported holding less than a high school degree in survey years 2012 - 2014.
B) Approximately 16% of respondents reported holding less than a high school degree in survey years 2012 - 2014.
C) Among respondents with less than a high school degree, the modal category for personal income was $16,165 per year
D) On average, respondents with less than a high school degree reported personal incomes of approximately $16,165 per year, in survey years 2012 - 2014.
سؤال
A team of researchers is interested to know whether respondents' education is related to their personal income. They conduct a comparison of means with the variable REALINC (Respondent's personal annual income, measured in dollars) as the dependent variable and DEGREE as the "Row" variable, and use a filter of YEAR (2010-2014). The resulting analysis is shown in Figure 8.2-In survey years 2012 - 2014, respondents who reported that their highest degree was a bachelor's degree, had an average score of approximately _______ on the variable REALINC.
A) 54,464
B) 2,488
C) 1,077
D) cannot be determined from Table 8.1
سؤال
A team of researchers is interested to know whether respondents' education is related to their personal income. They conduct a comparison of means with the variable REALINC (Respondent's personal annual income, measured in dollars) as the dependent variable and DEGREE as the "Row" variable, and use a filter of YEAR (2010-2014). The resulting analysis is shown in Figure 8.2-Which of the following best describes the relationship between REALINC and DEGREE, based on Figure 8.2?
A) There is a negative relationship between REALINC and DEGREE.
B) There is a positive relationship between REALINC and DEGREE.
C) There is no clear relationship between REALINC and DEGREE.
سؤال
A team of researchers is interested to know whether respondents' education is related to their personal income. They conduct a comparison of means with the variable REALINC (Respondent's personal annual income, measured in dollars) as the dependent variable and DEGREE as the "Row" variable, and use a filter of YEAR (2010-2014). The resulting analysis is shown in Figure 8.2-Which of the following statements is true, based on Figure 8.2?
A) Most respondents represented in the Figure held a Bachelor's degree or higher
B) On average, respondents with a bachelor's degree earn more than $20,000 more per year compared to those whose highest degree is a high school degree.
C) Approximately 29% of respondents reported holding a high school degree (but no higher degree) in survey years 2012 - 2014.
D) As respondents' educational attainment increases, respondents' personal income tends to decrease.

فتح الحزمة
قم بالتسجيل لفتح البطاقات في هذه المجموعة!
Unlock Deck
Unlock Deck
1/10
العب
ملء الشاشة (f)
Deck 8: Analyzing Inequalities in Education
1
A team of researchers is interested to know whether educational attainment affects the likelihood of owning or renting a home. They create a cross-tab with DWELOWN (Do you/Does your family) own your (home/apartment), pay rent, or what?") and DEGREE (respondents' highest educational degree), using a filter of "YEAR (2010-2014)." Figure 8.1 shows the resulting analysis.-The variable DWELOWN is best described as:
A) a dummy variable.
B) a categorical variable.
C) an ordinal variable.
D) an interval-ration level variable.
B
2
A team of researchers is interested to know whether educational attainment affects the likelihood of owning or renting a home. They create a cross-tab with DWELOWN (Do you/Does your family) own your (home/apartment), pay rent, or what?") and DEGREE (respondents' highest educational degree), using a filter of "YEAR (2010-2014)." Figure 8.1 shows the resulting analysis.-The variable DEGREE is best described as:
A) a dummy variable.
B) a categorical variable.
C) an ordinal variable.
D) an interval-ration level variable.
C
3
A team of researchers is interested to know whether educational attainment affects the likelihood of owning or renting a home. They create a cross-tab with DWELOWN (Do you/Does your family) own your (home/apartment), pay rent, or what?") and DEGREE (respondents' highest educational degree), using a filter of "YEAR (2010-2014)." Figure 8.1 shows the resulting analysis.-In general, as respondents' educational attainment increases, the percentage of those who say they "pay rent" for their current home:
A) decreases
B) increases
C) stays about the same
A
4
A team of researchers is interested to know whether educational attainment affects the likelihood of owning or renting a home. They create a cross-tab with DWELOWN (Do you/Does your family) own your (home/apartment), pay rent, or what?") and DEGREE (respondents' highest educational degree), using a filter of "YEAR (2010-2014)." Figure 8.1 shows the resulting analysis.-For respondents with less than a high school education, the modal category for the variable DWELOWN is:
A) owns or is buying
B) pays rent
C) other
D) cannot be determined by the information presented in Figure 8.1
فتح الحزمة
افتح القفل للوصول البطاقات البالغ عددها 10 في هذه المجموعة.
فتح الحزمة
k this deck
5
A team of researchers is interested to know whether educational attainment affects the likelihood of owning or renting a home. They create a cross-tab with DWELOWN (Do you/Does your family) own your (home/apartment), pay rent, or what?") and DEGREE (respondents' highest educational degree), using a filter of "YEAR (2010-2014)." Figure 8.1 shows the resulting analysis.-What percentage of respondents with a graduate degree owned their home or were in the process of buying it?
A) 44%
B) 62.7%
C) 74.6%
D) 83%
فتح الحزمة
افتح القفل للوصول البطاقات البالغ عددها 10 في هذه المجموعة.
فتح الحزمة
k this deck
6
A team of researchers is interested to know whether educational attainment affects the likelihood of owning or renting a home. They create a cross-tab with DWELOWN (Do you/Does your family) own your (home/apartment), pay rent, or what?") and DEGREE (respondents' highest educational degree), using a filter of "YEAR (2010-2014)." Figure 8.1 shows the resulting analysis.-Which of the following statements best interprets the value of 16.4 in Figure 8.1?
A) Approximately 16 people with a graduate degree reported that they were currently renting.
B) 16.4 % of those who were currently renting their homes reported holding a graduate degree.
C) 16.4 % of those with a graduate degree reported that they were currently paying rent.
D) Of all respondents represented in the Figure, 16.4 were people who held a graduate degree and were currently renting their homes.
فتح الحزمة
افتح القفل للوصول البطاقات البالغ عددها 10 في هذه المجموعة.
فتح الحزمة
k this deck
7
A team of researchers is interested to know whether respondents' education is related to their personal income. They conduct a comparison of means with the variable REALINC (Respondent's personal annual income, measured in dollars) as the dependent variable and DEGREE as the "Row" variable, and use a filter of YEAR (2010-2014). The resulting analysis is shown in Figure 8.2-The value of 16,164.88 in Figure 8.2 indicates that:
A) Approximately 16,165 respondents reported holding less than a high school degree in survey years 2012 - 2014.
B) Approximately 16% of respondents reported holding less than a high school degree in survey years 2012 - 2014.
C) Among respondents with less than a high school degree, the modal category for personal income was $16,165 per year
D) On average, respondents with less than a high school degree reported personal incomes of approximately $16,165 per year, in survey years 2012 - 2014.
فتح الحزمة
افتح القفل للوصول البطاقات البالغ عددها 10 في هذه المجموعة.
فتح الحزمة
k this deck
8
A team of researchers is interested to know whether respondents' education is related to their personal income. They conduct a comparison of means with the variable REALINC (Respondent's personal annual income, measured in dollars) as the dependent variable and DEGREE as the "Row" variable, and use a filter of YEAR (2010-2014). The resulting analysis is shown in Figure 8.2-In survey years 2012 - 2014, respondents who reported that their highest degree was a bachelor's degree, had an average score of approximately _______ on the variable REALINC.
A) 54,464
B) 2,488
C) 1,077
D) cannot be determined from Table 8.1
فتح الحزمة
افتح القفل للوصول البطاقات البالغ عددها 10 في هذه المجموعة.
فتح الحزمة
k this deck
9
A team of researchers is interested to know whether respondents' education is related to their personal income. They conduct a comparison of means with the variable REALINC (Respondent's personal annual income, measured in dollars) as the dependent variable and DEGREE as the "Row" variable, and use a filter of YEAR (2010-2014). The resulting analysis is shown in Figure 8.2-Which of the following best describes the relationship between REALINC and DEGREE, based on Figure 8.2?
A) There is a negative relationship between REALINC and DEGREE.
B) There is a positive relationship between REALINC and DEGREE.
C) There is no clear relationship between REALINC and DEGREE.
فتح الحزمة
افتح القفل للوصول البطاقات البالغ عددها 10 في هذه المجموعة.
فتح الحزمة
k this deck
10
A team of researchers is interested to know whether respondents' education is related to their personal income. They conduct a comparison of means with the variable REALINC (Respondent's personal annual income, measured in dollars) as the dependent variable and DEGREE as the "Row" variable, and use a filter of YEAR (2010-2014). The resulting analysis is shown in Figure 8.2-Which of the following statements is true, based on Figure 8.2?
A) Most respondents represented in the Figure held a Bachelor's degree or higher
B) On average, respondents with a bachelor's degree earn more than $20,000 more per year compared to those whose highest degree is a high school degree.
C) Approximately 29% of respondents reported holding a high school degree (but no higher degree) in survey years 2012 - 2014.
D) As respondents' educational attainment increases, respondents' personal income tends to decrease.
فتح الحزمة
افتح القفل للوصول البطاقات البالغ عددها 10 في هذه المجموعة.
فتح الحزمة
k this deck
فتح الحزمة
افتح القفل للوصول البطاقات البالغ عددها 10 في هذه المجموعة.


