Deck 4: Analyzing Race and Ethnicity With the GSS
ملء الشاشة (f)
سؤال
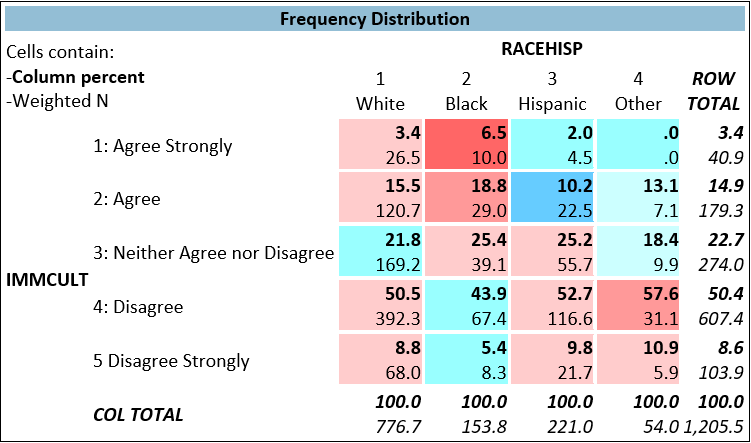
A researcher is interested to know whether people of different racial-ethnic groups tend to hold different ideas about American cultural diversity. She creates Figure 4.1, where RACEHISP is a variable that indicates respondents' self-identification as non-Hispanic white, Black or African American, non-Black Hispanic, or another racial/ethnic minority group. IMMCULT is a variable corresponding to the question "How much do you agree of disagree with the following statements? 'American culture is generally undermined by immigrants.'
Figure 4.1
-The researcher is most likely using which variable as the dependent variable in this analysis?
A) YEAR
B) RACEHISP
C) IMMCULT
D) DEGREE
Figure 4.1
-The researcher is most likely using which variable as the dependent variable in this analysis?
A) YEAR
B) RACEHISP
C) IMMCULT
D) DEGREE
سؤال
A researcher is interested to know whether people of different racial-ethnic groups tend to hold different ideas about American cultural diversity. She creates Figure 4.1, where RACEHISP is a variable that indicates respondents' self-identification as non-Hispanic white, Black or African American, non-Black Hispanic, or another racial/ethnic minority group. IMMCULT is a variable corresponding to the question "How much do you agree of disagree with the following statements? 'American culture is generally undermined by immigrants.'
Figure 4.1
-Of the racial/ethnic groups analyzed in this figure, which group has the highest number of respondents?
A) non-Hispanic whites
B) Blacks
C) non-Black Hispanics
D) other racial/ethnic groups
Figure 4.1
-Of the racial/ethnic groups analyzed in this figure, which group has the highest number of respondents?
A) non-Hispanic whites
B) Blacks
C) non-Black Hispanics
D) other racial/ethnic groups
سؤال
A researcher is interested to know whether people of different racial-ethnic groups tend to hold different ideas about American cultural diversity. She creates Figure 4.1, where RACEHISP is a variable that indicates respondents' self-identification as non-Hispanic white, Black or African American, non-Black Hispanic, or another racial/ethnic minority group. IMMCULT is a variable corresponding to the question "How much do you agree of disagree with the following statements? 'American culture is generally undermined by immigrants.'
Figure 4.1
-Taking all respondents together, what is the modal category of the variable IMMCULT?
A) Agree Strongly
B) Agree
C) Disagree
D) Disagree Strongly
Figure 4.1
-Taking all respondents together, what is the modal category of the variable IMMCULT?
A) Agree Strongly
B) Agree
C) Disagree
D) Disagree Strongly
سؤال
A researcher is interested to know whether people of different racial-ethnic groups tend to hold different ideas about American cultural diversity. She creates Figure 4.1, where RACEHISP is a variable that indicates respondents' self-identification as non-Hispanic white, Black or African American, non-Black Hispanic, or another racial/ethnic minority group. IMMCULT is a variable corresponding to the question "How much do you agree of disagree with the following statements? 'American culture is generally undermined by immigrants.'
Figure 4.1
-Looking at the first cross-tab in Figure 4.1, the 3.4 in the upper left corner tells us that:
A) Of those who strongly agreed with the idea that "American culture is generally undermined by immigrants" 3.4 identified as non-Hispanic whites.
B) 3.4% of non-Hispanic white respondents strongly agreed with the idea that "American culture is generally undermined by immigrants."
C) Approximately 3 white respondents strongly agreed with the idea that "American culture is generally undermined by immigrants."
D) Of all of the respondents surveyed, 3.4 % were non-Hispanic whites who strongly agree with the idea that "American culture is generally undermined by immigrants"
سؤال
A researcher is interested to know whether people of different racial-ethnic groups tend to hold different ideas about American cultural diversity. She creates Figure 4.1, where RACEHISP is a variable that indicates respondents' self-identification as non-Hispanic white, Black or African American, non-Black Hispanic, or another racial/ethnic minority group. IMMCULT is a variable corresponding to the question "How much do you agree of disagree with the following statements? 'American culture is generally undermined by immigrants.'
Figure 4.1
-Which of the following statements is NOT true, according to Figure 4.1?
A) Within every racial-ethnic group considered in Figure 4.1, fewer than 10% of respondents strongly agreed with the idea that "American culture is generally undermined by immigrants.
B) Overall, most respondents disagreed or strongly disagreed with the idea that "American culture is generally undermined by immigrants."
C) Within every racial-ethnic group considered in Figure 4.1, the modal category of the variable IMMCULT is the same.
D) Non-Hispanic white respondents were the most likely racial-ethnic group to strongly agree with the idea that "American culture is generally undermined by immigrants."
سؤال
Figure 4.2 examines the relationship between respondents' racial-ethnic group and their confidence in education, controlling for respondents' gender. RACEHISP is a nominal-level variable that indicates respondents' self-identification as non-Hispanic white, Black or African American, non-Black Hispanic, or another racial/ethnic minority group. CONEDUC is the variable corresponding to the question, "I am going to name some institutions in this country. As far as the people running these institutions are concerned, would you say you have a great deal of confidence, only some confidence, or hardly any confidence at all in them? … Education."
The top portion of the figure shows the variables used to construct the analysis and indicates that SEX was used as a control variable and YEAR was used as a filter.
Figure 4.2
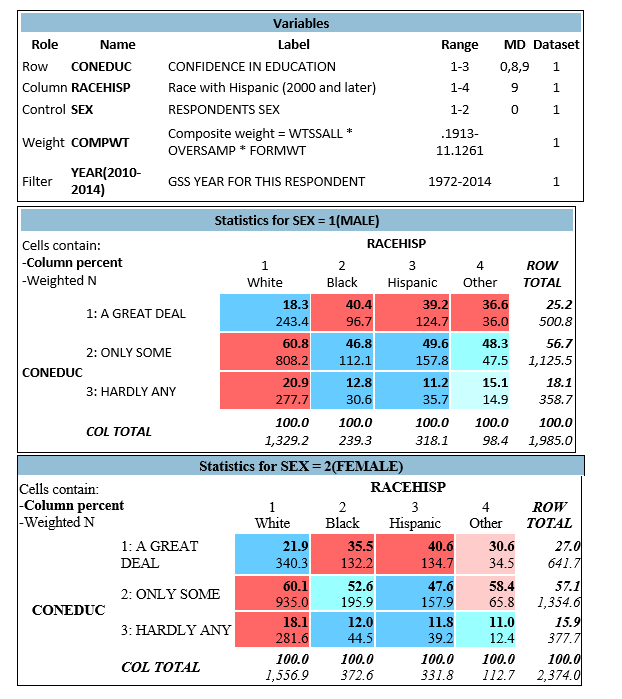
-Among men respondents, which group was the most likely to report having a great deal of confidence in educational institutions?
A) White men
B) Black men
C) Non-Black Hispanic men
D) Other men
The top portion of the figure shows the variables used to construct the analysis and indicates that SEX was used as a control variable and YEAR was used as a filter.
Figure 4.2
-Among men respondents, which group was the most likely to report having a great deal of confidence in educational institutions?
A) White men
B) Black men
C) Non-Black Hispanic men
D) Other men
سؤال
Figure 4.2 examines the relationship between respondents' racial-ethnic group and their confidence in education, controlling for respondents' gender. RACEHISP is a nominal-level variable that indicates respondents' self-identification as non-Hispanic white, Black or African American, non-Black Hispanic, or another racial/ethnic minority group. CONEDUC is the variable corresponding to the question, "I am going to name some institutions in this country. As far as the people running these institutions are concerned, would you say you have a great deal of confidence, only some confidence, or hardly any confidence at all in them? … Education."
The top portion of the figure shows the variables used to construct the analysis and indicates that SEX was used as a control variable and YEAR was used as a filter.
Figure 4.2
-Among women respondents, which group was the most likely to report having a great deal of confidence in educational institutions?
A) White women
B) Black women
C) Non-Black Hispanic women
D) Other women
سؤال
Figure 4.2 examines the relationship between respondents' racial-ethnic group and their confidence in education, controlling for respondents' gender. RACEHISP is a nominal-level variable that indicates respondents' self-identification as non-Hispanic white, Black or African American, non-Black Hispanic, or another racial/ethnic minority group. CONEDUC is the variable corresponding to the question, "I am going to name some institutions in this country. As far as the people running these institutions are concerned, would you say you have a great deal of confidence, only some confidence, or hardly any confidence at all in them? … Education."
The top portion of the figure shows the variables used to construct the analysis and indicates that SEX was used as a control variable and YEAR was used as a filter.
Figure 4.2
-Approximately how many non-Hispanic, white women respondents reported that they had a great deal of confidence in educational institutions?
A) 243
B) 501
C) 340
D) 642
سؤال
Figure 4.2 examines the relationship between respondents' racial-ethnic group and their confidence in education, controlling for respondents' gender. RACEHISP is a nominal-level variable that indicates respondents' self-identification as non-Hispanic white, Black or African American, non-Black Hispanic, or another racial/ethnic minority group. CONEDUC is the variable corresponding to the question, "I am going to name some institutions in this country. As far as the people running these institutions are concerned, would you say you have a great deal of confidence, only some confidence, or hardly any confidence at all in them? … Education."
The top portion of the figure shows the variables used to construct the analysis and indicates that SEX was used as a control variable and YEAR was used as a filter.
Figure 4.2
-Which of the following statements is correct, according to Figure 4.2?
A) The percentage of men who have "a great deal" of confidence in education as a social institution is higher than the percentage of women who have "a great deal" of confidence in education as a social institution
B) Across all racial-ethnic and gender groups the mean response is 3.
C) The majority of respondents have a great deal of confidence in education as a social institution.
D) Across all racial-ethnic and gender groups, the modal category is having "only some" confidence in education as a social institution
سؤال
Figure 4.2 examines the relationship between respondents' racial-ethnic group and their confidence in education, controlling for respondents' gender. RACEHISP is a nominal-level variable that indicates respondents' self-identification as non-Hispanic white, Black or African American, non-Black Hispanic, or another racial/ethnic minority group. CONEDUC is the variable corresponding to the question, "I am going to name some institutions in this country. As far as the people running these institutions are concerned, would you say you have a great deal of confidence, only some confidence, or hardly any confidence at all in them? … Education."
The top portion of the figure shows the variables used to construct the analysis and indicates that SEX was used as a control variable and YEAR was used as a filter.
Figure 4.2
-The results presented in Figure 4.2 include data from:
A) 1972 - 2014
B) 2000 - 2014
C) 2010-2014
D) All years in which both RACEHISP and CONEDUC are included in the survey.

فتح الحزمة
قم بالتسجيل لفتح البطاقات في هذه المجموعة!
Unlock Deck
Unlock Deck
1/10
العب
ملء الشاشة (f)
Deck 4: Analyzing Race and Ethnicity With the GSS
1
A researcher is interested to know whether people of different racial-ethnic groups tend to hold different ideas about American cultural diversity. She creates Figure 4.1, where RACEHISP is a variable that indicates respondents' self-identification as non-Hispanic white, Black or African American, non-Black Hispanic, or another racial/ethnic minority group. IMMCULT is a variable corresponding to the question "How much do you agree of disagree with the following statements? 'American culture is generally undermined by immigrants.'
Figure 4.1
-The researcher is most likely using which variable as the dependent variable in this analysis?
A) YEAR
B) RACEHISP
C) IMMCULT
D) DEGREE
Figure 4.1
-The researcher is most likely using which variable as the dependent variable in this analysis?
A) YEAR
B) RACEHISP
C) IMMCULT
D) DEGREE
C
2
A researcher is interested to know whether people of different racial-ethnic groups tend to hold different ideas about American cultural diversity. She creates Figure 4.1, where RACEHISP is a variable that indicates respondents' self-identification as non-Hispanic white, Black or African American, non-Black Hispanic, or another racial/ethnic minority group. IMMCULT is a variable corresponding to the question "How much do you agree of disagree with the following statements? 'American culture is generally undermined by immigrants.'
Figure 4.1
-Of the racial/ethnic groups analyzed in this figure, which group has the highest number of respondents?
A) non-Hispanic whites
B) Blacks
C) non-Black Hispanics
D) other racial/ethnic groups
Figure 4.1
-Of the racial/ethnic groups analyzed in this figure, which group has the highest number of respondents?
A) non-Hispanic whites
B) Blacks
C) non-Black Hispanics
D) other racial/ethnic groups
A
3
A researcher is interested to know whether people of different racial-ethnic groups tend to hold different ideas about American cultural diversity. She creates Figure 4.1, where RACEHISP is a variable that indicates respondents' self-identification as non-Hispanic white, Black or African American, non-Black Hispanic, or another racial/ethnic minority group. IMMCULT is a variable corresponding to the question "How much do you agree of disagree with the following statements? 'American culture is generally undermined by immigrants.'
Figure 4.1
-Taking all respondents together, what is the modal category of the variable IMMCULT?
A) Agree Strongly
B) Agree
C) Disagree
D) Disagree Strongly
Figure 4.1
-Taking all respondents together, what is the modal category of the variable IMMCULT?
A) Agree Strongly
B) Agree
C) Disagree
D) Disagree Strongly
C
4
A researcher is interested to know whether people of different racial-ethnic groups tend to hold different ideas about American cultural diversity. She creates Figure 4.1, where RACEHISP is a variable that indicates respondents' self-identification as non-Hispanic white, Black or African American, non-Black Hispanic, or another racial/ethnic minority group. IMMCULT is a variable corresponding to the question "How much do you agree of disagree with the following statements? 'American culture is generally undermined by immigrants.'
Figure 4.1
-Looking at the first cross-tab in Figure 4.1, the 3.4 in the upper left corner tells us that:
A) Of those who strongly agreed with the idea that "American culture is generally undermined by immigrants" 3.4 identified as non-Hispanic whites.
B) 3.4% of non-Hispanic white respondents strongly agreed with the idea that "American culture is generally undermined by immigrants."
C) Approximately 3 white respondents strongly agreed with the idea that "American culture is generally undermined by immigrants."
D) Of all of the respondents surveyed, 3.4 % were non-Hispanic whites who strongly agree with the idea that "American culture is generally undermined by immigrants"
فتح الحزمة
افتح القفل للوصول البطاقات البالغ عددها 10 في هذه المجموعة.
فتح الحزمة
k this deck
5
A researcher is interested to know whether people of different racial-ethnic groups tend to hold different ideas about American cultural diversity. She creates Figure 4.1, where RACEHISP is a variable that indicates respondents' self-identification as non-Hispanic white, Black or African American, non-Black Hispanic, or another racial/ethnic minority group. IMMCULT is a variable corresponding to the question "How much do you agree of disagree with the following statements? 'American culture is generally undermined by immigrants.'
Figure 4.1
-Which of the following statements is NOT true, according to Figure 4.1?
A) Within every racial-ethnic group considered in Figure 4.1, fewer than 10% of respondents strongly agreed with the idea that "American culture is generally undermined by immigrants.
B) Overall, most respondents disagreed or strongly disagreed with the idea that "American culture is generally undermined by immigrants."
C) Within every racial-ethnic group considered in Figure 4.1, the modal category of the variable IMMCULT is the same.
D) Non-Hispanic white respondents were the most likely racial-ethnic group to strongly agree with the idea that "American culture is generally undermined by immigrants."
فتح الحزمة
افتح القفل للوصول البطاقات البالغ عددها 10 في هذه المجموعة.
فتح الحزمة
k this deck
6
Figure 4.2 examines the relationship between respondents' racial-ethnic group and their confidence in education, controlling for respondents' gender. RACEHISP is a nominal-level variable that indicates respondents' self-identification as non-Hispanic white, Black or African American, non-Black Hispanic, or another racial/ethnic minority group. CONEDUC is the variable corresponding to the question, "I am going to name some institutions in this country. As far as the people running these institutions are concerned, would you say you have a great deal of confidence, only some confidence, or hardly any confidence at all in them? … Education."
The top portion of the figure shows the variables used to construct the analysis and indicates that SEX was used as a control variable and YEAR was used as a filter.
Figure 4.2
-Among men respondents, which group was the most likely to report having a great deal of confidence in educational institutions?
A) White men
B) Black men
C) Non-Black Hispanic men
D) Other men
فتح الحزمة
افتح القفل للوصول البطاقات البالغ عددها 10 في هذه المجموعة.
فتح الحزمة
k this deck
7
Figure 4.2 examines the relationship between respondents' racial-ethnic group and their confidence in education, controlling for respondents' gender. RACEHISP is a nominal-level variable that indicates respondents' self-identification as non-Hispanic white, Black or African American, non-Black Hispanic, or another racial/ethnic minority group. CONEDUC is the variable corresponding to the question, "I am going to name some institutions in this country. As far as the people running these institutions are concerned, would you say you have a great deal of confidence, only some confidence, or hardly any confidence at all in them? … Education."
The top portion of the figure shows the variables used to construct the analysis and indicates that SEX was used as a control variable and YEAR was used as a filter.
Figure 4.2
-Among women respondents, which group was the most likely to report having a great deal of confidence in educational institutions?
A) White women
B) Black women
C) Non-Black Hispanic women
D) Other women
فتح الحزمة
افتح القفل للوصول البطاقات البالغ عددها 10 في هذه المجموعة.
فتح الحزمة
k this deck
8
Figure 4.2 examines the relationship between respondents' racial-ethnic group and their confidence in education, controlling for respondents' gender. RACEHISP is a nominal-level variable that indicates respondents' self-identification as non-Hispanic white, Black or African American, non-Black Hispanic, or another racial/ethnic minority group. CONEDUC is the variable corresponding to the question, "I am going to name some institutions in this country. As far as the people running these institutions are concerned, would you say you have a great deal of confidence, only some confidence, or hardly any confidence at all in them? … Education."
The top portion of the figure shows the variables used to construct the analysis and indicates that SEX was used as a control variable and YEAR was used as a filter.
Figure 4.2
-Approximately how many non-Hispanic, white women respondents reported that they had a great deal of confidence in educational institutions?
A) 243
B) 501
C) 340
D) 642
فتح الحزمة
افتح القفل للوصول البطاقات البالغ عددها 10 في هذه المجموعة.
فتح الحزمة
k this deck
9
Figure 4.2 examines the relationship between respondents' racial-ethnic group and their confidence in education, controlling for respondents' gender. RACEHISP is a nominal-level variable that indicates respondents' self-identification as non-Hispanic white, Black or African American, non-Black Hispanic, or another racial/ethnic minority group. CONEDUC is the variable corresponding to the question, "I am going to name some institutions in this country. As far as the people running these institutions are concerned, would you say you have a great deal of confidence, only some confidence, or hardly any confidence at all in them? … Education."
The top portion of the figure shows the variables used to construct the analysis and indicates that SEX was used as a control variable and YEAR was used as a filter.
Figure 4.2
-Which of the following statements is correct, according to Figure 4.2?
A) The percentage of men who have "a great deal" of confidence in education as a social institution is higher than the percentage of women who have "a great deal" of confidence in education as a social institution
B) Across all racial-ethnic and gender groups the mean response is 3.
C) The majority of respondents have a great deal of confidence in education as a social institution.
D) Across all racial-ethnic and gender groups, the modal category is having "only some" confidence in education as a social institution
فتح الحزمة
افتح القفل للوصول البطاقات البالغ عددها 10 في هذه المجموعة.
فتح الحزمة
k this deck
10
Figure 4.2 examines the relationship between respondents' racial-ethnic group and their confidence in education, controlling for respondents' gender. RACEHISP is a nominal-level variable that indicates respondents' self-identification as non-Hispanic white, Black or African American, non-Black Hispanic, or another racial/ethnic minority group. CONEDUC is the variable corresponding to the question, "I am going to name some institutions in this country. As far as the people running these institutions are concerned, would you say you have a great deal of confidence, only some confidence, or hardly any confidence at all in them? … Education."
The top portion of the figure shows the variables used to construct the analysis and indicates that SEX was used as a control variable and YEAR was used as a filter.
Figure 4.2
-The results presented in Figure 4.2 include data from:
A) 1972 - 2014
B) 2000 - 2014
C) 2010-2014
D) All years in which both RACEHISP and CONEDUC are included in the survey.
فتح الحزمة
افتح القفل للوصول البطاقات البالغ عددها 10 في هذه المجموعة.
فتح الحزمة
k this deck
فتح الحزمة
افتح القفل للوصول البطاقات البالغ عددها 10 في هذه المجموعة.


