Deck 9: Contingency Analysis: Associations Between
ملء الشاشة (f)
سؤال
سؤال
سؤال
سؤال
سؤال
سؤال
سؤال
سؤال
سؤال
سؤال
سؤال
سؤال
سؤال
سؤال
سؤال
سؤال
سؤال
سؤال
سؤال
سؤال
سؤال
سؤال
سؤال
سؤال
سؤال
سؤال
سؤال
سؤال
سؤال
سؤال
سؤال
سؤال
سؤال
سؤال
سؤال
سؤال
سؤال
سؤال
سؤال
Sea star wasting disease kills sea stars (i.e., starfish) and has no known cause. It is currently a major problem on the West Coast and many sea stars are infected and dying. Consider a study in which a researcher is interested in whether susceptibility varies between the species. He travels to a site known to show wasting and counts the numbers of healthy and wasting individuals from three different species. His data is shown in the histogram below.
-To determine whether there appears to be a statistically significant relationship between the treatment and changes in cholesterol level they would conduct a χ2 analysis. When performing this analysis, which of the following best describes the conclusion they could make from the data?
A) These data do not provide sufficient evidence that treatment type is associated with changes in cholesterol level.
B) There is a statistically significant relationship between treatment and changes in cholesterol level, the drug lowers cholesterol more than the other treatments.
C) There is a statistically significant relationship between treatment and changes in cholesterol level, the placebo lowers cholesterol more than the other treatments.
D) There is a statistically significant relationship between treatment and changes in cholesterol level, the control group showed lower cholesterol compared to the other treatments.
سؤال
Sea star wasting disease kills sea stars (i.e., starfish) and has no known cause. It is currently a major problem on the West Coast and many sea stars are infected and dying. Consider a study in which a researcher is interested in whether susceptibility varies between the species. He travels to a site known to show wasting and counts the numbers of healthy and wasting individuals from three different species. His data is shown in the histogram below.
-Assuming a null hypothesis of no relationship between species and prevalence of wasting disease, which of the following values is closest to the expected count of Solaster with wasting disease?
A) 10.69
B) 13.65
C) 15.13
D) 17.22
-Assuming a null hypothesis of no relationship between species and prevalence of wasting disease, which of the following values is closest to the expected count of Solaster with wasting disease?
A) 10.69
B) 13.65
C) 15.13
D) 17.22
سؤال
Sea star wasting disease kills sea stars (i.e., starfish) and has no known cause. It is currently a major problem on the West Coast and many sea stars are infected and dying. Consider a study in which a researcher is interested in whether susceptibility varies between the species. He travels to a site known to show wasting and counts the numbers of healthy and wasting individuals from three different species. His data is shown in the histogram below.
-To determine whether there appears to be a statistically significant relationship between species and prevalence of wasting disease he would conduct a χ2 analysis. When performing this analysis, which of the values below is closest to the number of degrees of freedom he would use?
A) 1
B) 2
C) 3
D) 4
سؤال
Sea star wasting disease kills sea stars (i.e., starfish) and has no known cause. It is currently a major problem on the West Coast and many sea stars are infected and dying. Consider a study in which a researcher is interested in whether susceptibility varies between the species. He travels to a site known to show wasting and counts the numbers of healthy and wasting individuals from three different species. His data is shown in the histogram below.
-To determine whether there appears to be a statistically significant relationship between species and prevalence of wasting disease he would conduct a χ2 analysis. When performing this analysis, which of the values below is closest to the contribution to the χ2 statistic from the "Healthy : Pycnopodia" category?
A) 0.47
B) 0.82
C) 1.59
D) 2.14
سؤال
Sea star wasting disease kills sea stars (i.e., starfish) and has no known cause. It is currently a major problem on the West Coast and many sea stars are infected and dying. Consider a study in which a researcher is interested in whether susceptibility varies between the species. He travels to a site known to show wasting and counts the numbers of healthy and wasting individuals from three different species. His data is shown in the histogram below.
-To determine whether there appears to be a statistically significant relationship between species and prevalence of wasting disease he would conduct a χ2 analysis. When performing this analysis, which of the values below is closest to the χ2 statistic he would obtain?
A) 3.3
B) 5.7
C) 9.5
D) 11.2
-To determine whether there appears to be a statistically significant relationship between species and prevalence of wasting disease he would conduct a χ2 analysis. When performing this analysis, which of the values below is closest to the χ2 statistic he would obtain?
A) 3.3
B) 5.7
C) 9.5
D) 11.2
سؤال
Sea star wasting disease kills sea stars (i.e., starfish) and has no known cause. It is currently a major problem on the West Coast and many sea stars are infected and dying. Consider a study in which a researcher is interested in whether susceptibility varies between the species. He travels to a site known to show wasting and counts the numbers of healthy and wasting individuals from three different species. His data is shown in the histogram below.
-To determine whether there appears to be a statistically significant relationship between species and prevalence of wasting disease he would conduct a χ2 analysis. After performing this analysis, which of the ranges below best describes the P value he would obtain?
A) P > 0.05
B) 0.05 > P > 0.025
C) 0.025 > P > 0.01
D) P < 0.01
سؤال
A microbial ecologist is interested in whether the microbial community of a pond changes when it rains. She knows that rainfall will increase the number of bacteria, but she is interested in the pattern of diversity. She collects a water sample from a pond two days before a rainfall and two days after and plates her samples on agar (a method to measure bacteria) and counts the number of colonies she observes for each of three bacteria: E. Coli, Salmonella, and Giardia. In the pre-rain sample she observes 21, 57, and 32 colonies respectively. In the post-rain sample she observes 59, 83, and 88 colonies respectively.

-Which of the mosaic tables shown correctly depicts this data?
A) Graph A
B) Graph B
C) Graph C
D) Graph D
-Which of the mosaic tables shown correctly depicts this data?
A) Graph A
B) Graph B
C) Graph C
D) Graph D
سؤال
A microbial ecologist is interested in whether the microbial community of a pond changes when it rains. She knows that rainfall will increase the number of bacteria, but she is interested in the pattern of diversity. She collects a water sample from a pond two days before a rainfall and two days after and plates her samples on agar (a method to measure bacteria) and counts the number of colonies she observes for each of three bacteria: E. Coli, Salmonella, and Giardia. In the pre-rain sample she observes 21, 57, and 32 colonies respectively. In the post-rain sample she observes 59, 83, and 88 colonies respectively.
-Assuming a null hypothesis of no relationship between rainfall and bacterial diversity, which of the following values is closest to the expected count of
A) 39
B) 44
C) 49
D) 54
-Assuming a null hypothesis of no relationship between rainfall and bacterial diversity, which of the following values is closest to the expected count of
A) 39
B) 44
C) 49
D) 54
سؤال
A microbial ecologist is interested in whether the microbial community of a pond changes when it rains. She knows that rainfall will increase the number of bacteria, but she is interested in the pattern of diversity. She collects a water sample from a pond two days before a rainfall and two days after and plates her samples on agar (a method to measure bacteria) and counts the number of colonies she observes for each of three bacteria: E. Coli, Salmonella, and Giardia. In the pre-rain sample she observes 21, 57, and 32 colonies respectively. In the post-rain sample she observes 59, 83, and 88 colonies respectively.
-To determine whether there appears to be a statistically significant relationship between rainfall and bacterial diversity she would conduct a χ2 analysis. When performing this analysis, which of the values below is closest to the contribution to the χ2 statistic from the "pre-rainfall : Salmonella" category?
A) 1.01
B) 2.02
C) 3.03
D) 4.04
سؤال
A microbial ecologist is interested in whether the microbial community of a pond changes when it rains. She knows that rainfall will increase the number of bacteria, but she is interested in the pattern of diversity. She collects a water sample from a pond two days before a rainfall and two days after and plates her samples on agar (a method to measure bacteria) and counts the number of colonies she observes for each of three bacteria: E. Coli, Salmonella, and Giardia. In the pre-rain sample she observes 21, 57, and 32 colonies respectively. In the post-rain sample she observes 59, 83, and 88 colonies respectively.
-To determine whether there appears to be a statistically significant relationship between rainfall and bacterial diversity she would conduct a χ2 analysis. When performing this analysis, which of the values below is closest to the number of degrees of freedom she would use?
A) 1
B) 2
C) 3
D) 4
-To determine whether there appears to be a statistically significant relationship between rainfall and bacterial diversity she would conduct a χ2 analysis. When performing this analysis, which of the values below is closest to the number of degrees of freedom she would use?
A) 1
B) 2
C) 3
D) 4
سؤال
A microbial ecologist is interested in whether the microbial community of a pond changes when it rains. She knows that rainfall will increase the number of bacteria, but she is interested in the pattern of diversity. She collects a water sample from a pond two days before a rainfall and two days after and plates her samples on agar (a method to measure bacteria) and counts the number of colonies she observes for each of three bacteria: E. Coli, Salmonella, and Giardia. In the pre-rain sample she observes 21, 57, and 32 colonies respectively. In the post-rain sample she observes 59, 83, and 88 colonies respectively.
-To determine whether there appears to be a statistically significant relationship between rainfall and bacterial diversity she would conduct a χ2 analysis. When performing this analysis, which of the values below is closest to the χ2 statistic she would obtain?
A) 2.6
B) 6.2
C) 6.7
D) 7.6
-To determine whether there appears to be a statistically significant relationship between rainfall and bacterial diversity she would conduct a χ2 analysis. When performing this analysis, which of the values below is closest to the χ2 statistic she would obtain?
A) 2.6
B) 6.2
C) 6.7
D) 7.6
سؤال
A microbial ecologist is interested in whether the microbial community of a pond changes when it rains. She knows that rainfall will increase the number of bacteria, but she is interested in the pattern of diversity. She collects a water sample from a pond two days before a rainfall and two days after and plates her samples on agar (a method to measure bacteria) and counts the number of colonies she observes for each of three bacteria: E. Coli, Salmonella, and Giardia. In the pre-rain sample she observes 21, 57, and 32 colonies respectively. In the post-rain sample she observes 59, 83, and 88 colonies respectively.
-To determine whether there appears to be a statistically significant relationship between rainfall and bacterial diversity she would conduct a χ2 analysis. After performing this analysis, which of the ranges below best describes the P value she would obtain?
A) P > 0.05
B) 0.05 > P > 0.025
C) 0.025 > P > 0.01
D) P < 0.01
سؤال
سؤال
سؤال
سؤال
سؤال
سؤال

فتح الحزمة
قم بالتسجيل لفتح البطاقات في هذه المجموعة!
Unlock Deck
Unlock Deck
1/56
العب
ملء الشاشة (f)
Deck 9: Contingency Analysis: Associations Between
1
Consider a study in which people were recruited and followed for 40 years to determine their health problems. The researchers were interested in lung cancer so at the end of the study they counted the number of participants who had died from lung cancer, or currently had it, and those that did not. They also counted how many were non-smokers their whole life or had been smokers at some point in their lives. The number of non-smokers with lung cancer was 36 and the number of non-smokers with no sign of lung cancer was 815. The number of smokers with lung cancer was 26 and the number of smokers with no sign of lung cancer was 161.
What proportion of all participants had been, or currently were, smokers?
A) 6%
B) 18%
C) 24%
D) 30%
What proportion of all participants had been, or currently were, smokers?
A) 6%
B) 18%
C) 24%
D) 30%
B
2
Consider a study in which people were recruited and followed for 40 years to determine their health problems. The researchers were interested in lung cancer so at the end of the study they counted the number of participants who had died from lung cancer, or currently had it, and those that did not. They also counted how many were non-smokers their whole life or had been smokers at some point in their lives. The number of non-smokers with lung cancer was 36 and the number of non-smokers with no sign of lung cancer was 815. The number of smokers with lung cancer was 26 and the number of smokers with no sign of lung cancer was 161.
What is the relative risk of lung cancer for participants who were smokers?
A) 3.29
B) 3.66
C) 4.02
D) 4.55
What is the relative risk of lung cancer for participants who were smokers?
A) 3.29
B) 3.66
C) 4.02
D) 4.55
A
3
Consider a study in which people were recruited and followed for 40 years to determine their health problems. The researchers were interested in lung cancer so at the end of the study they counted the number of participants who had died from lung cancer, or currently had it, and those that did not. They also counted how many were non-smokers their whole life or had been smokers at some point in their lives. The number of non-smokers with lung cancer was 36 and the number of non-smokers with no sign of lung cancer was 815. The number of smokers with lung cancer was 26 and the number of smokers with no sign of lung cancer was 161.
What is the odds ratio of lung cancer for participants who were smokers?
A) 3.29
B) 3.66
C) 4.02
D) 4.55
What is the odds ratio of lung cancer for participants who were smokers?
A) 3.29
B) 3.66
C) 4.02
D) 4.55
B
4
Consider a study in which people were recruited and followed for 40 years to determine their health problems. The researchers were interested in lung cancer so at the end of the study they counted the number of participants who had died from lung cancer, or currently had it, and those that did not. They also counted how many were non-smokers their whole life or had been smokers at some point in their lives. The number of non-smokers with lung cancer was 36 and the number of non-smokers with no sign of lung cancer was 815. The number of smokers with lung cancer was 26 and the number of smokers with no sign of lung cancer was 161.
Assuming a null hypothesis of no relationship between smoking and risk of lung cancer, which of the following values is closest to the expected number of smokers who did not get lung cancer?
A) 131
B) 146
C) 161
D) 176
Assuming a null hypothesis of no relationship between smoking and risk of lung cancer, which of the following values is closest to the expected number of smokers who did not get lung cancer?
A) 131
B) 146
C) 161
D) 176
فتح الحزمة
افتح القفل للوصول البطاقات البالغ عددها 56 في هذه المجموعة.
فتح الحزمة
k this deck
5
Consider a study in which people were recruited and followed for 40 years to determine their health problems. The researchers were interested in lung cancer so at the end of the study they counted the number of participants who had died from lung cancer, or currently had it, and those that did not. They also counted how many were non-smokers their whole life or had been smokers at some point in their lives. The number of non-smokers with lung cancer was 36 and the number of non-smokers with no sign of lung cancer was 815. The number of smokers with lung cancer was 26 and the number of smokers with no sign of lung cancer was 161.
To determine whether there appears to be a significant relationship between smoking and risk of lung cancer we would conduct a χ2 analysis. When performing this analysis, which of the values below is closest to the contribution to the χ2 statistic from the "never smoked : had lung cancer"?
A) 0.97
B) 2.54
C) 4.33
D) 11.17
فتح الحزمة
افتح القفل للوصول البطاقات البالغ عددها 56 في هذه المجموعة.
فتح الحزمة
k this deck
6
Consider a study in which people were recruited and followed for 40 years to determine their health problems. The researchers were interested in lung cancer so at the end of the study they counted the number of participants who had died from lung cancer, or currently had it, and those that did not. They also counted how many were non-smokers their whole life or had been smokers at some point in their lives. The number of non-smokers with lung cancer was 36 and the number of non-smokers with no sign of lung cancer was 815. The number of smokers with lung cancer was 26 and the number of smokers with no sign of lung cancer was 161.
To determine whether there appears to be a statistically significant relationship between smoking and risk of lung cancer we would conduct a χ2 analysis. When performing this analysis, which of the values below is closest to the χ2 statistic we would obtain?
A) 21.54
B) 23.35
C) 25.54
D) 27.35
To determine whether there appears to be a statistically significant relationship between smoking and risk of lung cancer we would conduct a χ2 analysis. When performing this analysis, which of the values below is closest to the χ2 statistic we would obtain?
A) 21.54
B) 23.35
C) 25.54
D) 27.35
فتح الحزمة
افتح القفل للوصول البطاقات البالغ عددها 56 في هذه المجموعة.
فتح الحزمة
k this deck
7
Consider a study in which people were recruited and followed for 40 years to determine their health problems. The researchers were interested in lung cancer so at the end of the study they counted the number of participants who had died from lung cancer, or currently had it, and those that did not. They also counted how many were non-smokers their whole life or had been smokers at some point in their lives. The number of non-smokers with lung cancer was 36 and the number of non-smokers with no sign of lung cancer was 815. The number of smokers with lung cancer was 26 and the number of smokers with no sign of lung cancer was 161.
To determine whether there appears to be a statistically significant relationship between smoking and risk of lung cancer we would conduct a χ2 analysis. Based on the results of this analysis, which of the following is the most appropriate conclusion?
A) Smoking appears to significantly elevate the risk of lung cancer (P > 0.05)
B) Smoking appears to significantly elevate the risk of lung cancer (P < 0.05)
C) Smoking appears to significantly reduce the risk of lung cancer (P < 0.01)
D) These data do not provide sufficient evidence that smoking changes the risk of lung cancer (P < 0.05)
فتح الحزمة
افتح القفل للوصول البطاقات البالغ عددها 56 في هذه المجموعة.
فتح الحزمة
k this deck
8
There are many claims that eating organic food leads to better health outcomes. To study this, a dietician collects data from her patients: she categorizes their blood pressure values into elevated and healthy and she administers a questionnaire from which she is able to classify their diet into high in organic food and low in organic food. The number of patients with high organic food consumption who had elevated and healthy blood pressures were 33 and 74 respectively. The number of patients with low organic food consumption who had elevated and healthy blood pressures were 267 and 395 respectively.
What proportion of all participants had elevated blood pressure?
A) 19%
B) 29%
C) 39%
D) 49%
What proportion of all participants had elevated blood pressure?
A) 19%
B) 29%
C) 39%
D) 49%
فتح الحزمة
افتح القفل للوصول البطاقات البالغ عددها 56 في هذه المجموعة.
فتح الحزمة
k this deck
9
There are many claims that eating organic food leads to better health outcomes. To study this, a dietician collects data from her patients: she categorizes their blood pressure values into elevated and healthy and she administers a questionnaire from which she is able to classify their diet into high in organic food and low in organic food. The number of patients with high organic food consumption who had elevated and healthy blood pressures were 33 and 74 respectively. The number of patients with low organic food consumption who had elevated and healthy blood pressures were 267 and 395 respectively.
What is the relative risk of elevated blood pressure for participants with diets high in organic food?
A) 0.66
B) 0.76
C) 0.91
D) 1.52
What is the relative risk of elevated blood pressure for participants with diets high in organic food?
A) 0.66
B) 0.76
C) 0.91
D) 1.52
فتح الحزمة
افتح القفل للوصول البطاقات البالغ عددها 56 في هذه المجموعة.
فتح الحزمة
k this deck
10
There are many claims that eating organic food leads to better health outcomes. To study this, a dietician collects data from her patients: she categorizes their blood pressure values into elevated and healthy and she administers a questionnaire from which she is able to classify their diet into high in organic food and low in organic food. The number of patients with high organic food consumption who had elevated and healthy blood pressures were 33 and 74 respectively. The number of patients with low organic food consumption who had elevated and healthy blood pressures were 267 and 395 respectively.
What is the odds ratio for elevated blood pressure for participants with diets high in organic food?
A) 0.66
B) 0.76
C) 0.91
D) 1.52
What is the odds ratio for elevated blood pressure for participants with diets high in organic food?
A) 0.66
B) 0.76
C) 0.91
D) 1.52
فتح الحزمة
افتح القفل للوصول البطاقات البالغ عددها 56 في هذه المجموعة.
فتح الحزمة
k this deck
11
There are many claims that eating organic food leads to better health outcomes. To study this, a dietician collects data from her patients: she categorizes their blood pressure values into elevated and healthy and she administers a questionnaire from which she is able to classify their diet into high in organic food and low in organic food. The number of patients with high organic food consumption who had elevated and healthy blood pressures were 33 and 74 respectively. The number of patients with low organic food consumption who had elevated and healthy blood pressures were 267 and 395 respectively.
Assuming a null hypothesis of no relationship between type of diet and blood pressure, which of the following values is closest to the expected number of patients who ate a diet low in organic food who would have elevated blood pressure?
A) 258
B) 294
C) 348
D) 404
Assuming a null hypothesis of no relationship between type of diet and blood pressure, which of the following values is closest to the expected number of patients who ate a diet low in organic food who would have elevated blood pressure?
A) 258
B) 294
C) 348
D) 404
فتح الحزمة
افتح القفل للوصول البطاقات البالغ عددها 56 في هذه المجموعة.
فتح الحزمة
k this deck
12
There are many claims that eating organic food leads to better health outcomes. To study this, a dietician collects data from her patients: she categorizes their blood pressure values into elevated and healthy and she administers a questionnaire from which she is able to classify their diet into high in organic food and low in organic food. The number of patients with high organic food consumption who had elevated and healthy blood pressures were 33 and 74 respectively. The number of patients with low organic food consumption who had elevated and healthy blood pressures were 267 and 395 respectively.
To determine whether there appears to be a statistically significant relationship between type of diet and blood pressure she would conduct a χ2 analysis. When performing this analysis, which of the values below is closest to the contribution to the χ2 statistic from the "high organic diet : elevated blood pressure" group?
A) 1.3
B) 1.8
C) 2.3
D) 2.8
فتح الحزمة
افتح القفل للوصول البطاقات البالغ عددها 56 في هذه المجموعة.
فتح الحزمة
k this deck
13
There are many claims that eating organic food leads to better health outcomes. To study this, a dietician collects data from her patients: she categorizes their blood pressure values into elevated and healthy and she administers a questionnaire from which she is able to classify their diet into high in organic food and low in organic food. The number of patients with high organic food consumption who had elevated and healthy blood pressures were 33 and 74 respectively. The number of patients with low organic food consumption who had elevated and healthy blood pressures were 267 and 395 respectively.
To determine whether there appears to be a statistically significant relationship between type of diet and blood pressure she would conduct a χ2 analysis. When performing this analysis, which of the values below is closest to the χ2 statistic she would obtain?
A) 2.51
B) 3.49
C) 5.23
D) 8.11
To determine whether there appears to be a statistically significant relationship between type of diet and blood pressure she would conduct a χ2 analysis. When performing this analysis, which of the values below is closest to the χ2 statistic she would obtain?
A) 2.51
B) 3.49
C) 5.23
D) 8.11
فتح الحزمة
افتح القفل للوصول البطاقات البالغ عددها 56 في هذه المجموعة.
فتح الحزمة
k this deck
14
There are many claims that eating organic food leads to better health outcomes. To study this, a dietician collects data from her patients: she categorizes their blood pressure values into elevated and healthy and she administers a questionnaire from which she is able to classify their diet into high in organic food and low in organic food. The number of patients with high organic food consumption who had elevated and healthy blood pressures were 33 and 74 respectively. The number of patients with low organic food consumption who had elevated and healthy blood pressures were 267 and 395 respectively.
To determine whether there appears to be a statistically significant relationship between type of diet and blood pressure she would conduct a χ2 analysis. Based on the results of her analysis, which of the following is the most appropriate conclusion?
A) Eating higher amounts of organic food appears to significantly reduce the risk of high blood pressure (P > 0.05).
B) Eating higher amounts of organic food appears to significantly reduce the risk of high blood pressure (P < 0.05).
C) Eating higher amounts of organic food appears to significantly elevate the risk of high blood pressure (P < 0.05).
D) These data do not provide sufficient evidence that eating higher amounts of organic food changes the risk of high blood pressure (P > 0.05).
فتح الحزمة
افتح القفل للوصول البطاقات البالغ عددها 56 في هذه المجموعة.
فتح الحزمة
k this deck
15
Consider the following values for numbers of major traffic accidents involving male and female drivers. The accidents are divided into ones involving a fatality and ones that did not. What is the relative risk for male drivers with regard to fatal accidents?
-What proportion of all accidents involve one or more fatalities?
A) 10%
B) 13%
C) 19%
D) 43%
-What proportion of all accidents involve one or more fatalities?
A) 10%
B) 13%
C) 19%
D) 43%
فتح الحزمة
افتح القفل للوصول البطاقات البالغ عددها 56 في هذه المجموعة.
فتح الحزمة
k this deck
16
Consider the following values for numbers of major traffic accidents involving male and female drivers. The accidents are divided into ones involving a fatality and ones that did not. What is the relative risk for male drivers with regard to fatal accidents?
-What is the relative risk of fatal accidents for males versus females?
A) 1.94
B) 2.41
C) 0.41
D) 0.36
-What is the relative risk of fatal accidents for males versus females?
A) 1.94
B) 2.41
C) 0.41
D) 0.36
فتح الحزمة
افتح القفل للوصول البطاقات البالغ عددها 56 في هذه المجموعة.
فتح الحزمة
k this deck
17
Consider the following values for numbers of major traffic accidents involving male and female drivers. The accidents are divided into ones involving a fatality and ones that did not. What is the relative risk for male drivers with regard to fatal accidents?
-What is the odds ratio of fatal accidents for males versus females?
A) 10.38
B) 2.77
C) 0.10
D) 0.36
-What is the odds ratio of fatal accidents for males versus females?
A) 10.38
B) 2.77
C) 0.10
D) 0.36
فتح الحزمة
افتح القفل للوصول البطاقات البالغ عددها 56 في هذه المجموعة.
فتح الحزمة
k this deck
18
Consider the following values for numbers of major traffic accidents involving male and female drivers. The accidents are divided into ones involving a fatality and ones that did not. What is the relative risk for male drivers with regard to fatal accidents?
-Assuming a null hypothesis of no relationship between sex of the driver and fatality of their accidents, which of the following values is closest to the expected number of fatal accidents involving male drivers?
A) 73.5
B) 13.6
C) 343.5
D) 63.82
-Assuming a null hypothesis of no relationship between sex of the driver and fatality of their accidents, which of the following values is closest to the expected number of fatal accidents involving male drivers?
A) 73.5
B) 13.6
C) 343.5
D) 63.82
فتح الحزمة
افتح القفل للوصول البطاقات البالغ عددها 56 في هذه المجموعة.
فتح الحزمة
k this deck
19
Consider the following values for numbers of major traffic accidents involving male and female drivers. The accidents are divided into ones involving a fatality and ones that did not. What is the relative risk for male drivers with regard to fatal accidents?
-To determine whether there appears to be a statistically significant relationship between sex of the driver and fatality of their accidents we would conduct a ?2 analysis. When performing this analysis, which of the values below is closest to the contribution to the ?2 statistic from the "non-fatal : female" category?
A) 1.52
B) 7.42
C) 13.66
D) 63.82
فتح الحزمة
افتح القفل للوصول البطاقات البالغ عددها 56 في هذه المجموعة.
فتح الحزمة
k this deck
20
Consider the following values for numbers of major traffic accidents involving male and female drivers. The accidents are divided into ones involving a fatality and ones that did not. What is the relative risk for male drivers with regard to fatal accidents?
-To determine whether there appears to be a statistically significant relationship between sex of the driver and fatality of their accidents we would conduct a ?2 analysis. When performing this analysis, which of the values below is closest to the ?2 statistic we would obtain?
A) 86.5
B) 569.1
C) 60.0
D) 21.94
فتح الحزمة
افتح القفل للوصول البطاقات البالغ عددها 56 في هذه المجموعة.
فتح الحزمة
k this deck
21
To determine whether there appears to be a statistically significant relationship between sex of the driver and fatality of their accidents we would conduct a χ2 analysis. Based on the results of this analysis, which of the following is the most appropriate conclusion?
A) Males appear to be at a significantly higher relative risk of fatal accidents (P > 0.05)
B) Males appear to be at a significantly higher relative risk of fatal accidents (P < 0.05)
C) Males appear to be at a significantly lower relative risk of fatal accidents (P < 0.05)
D) These data do not provide sufficient evidence that sex of driver changes the relative risk of fatal accidents (P < 0.05)
فتح الحزمة
افتح القفل للوصول البطاقات البالغ عددها 56 في هذه المجموعة.
فتح الحزمة
k this deck
22
Humans aren't the only animals that get cancer, other organisms get tumors as well and their risk may be influenced by environmental factors. An ecologist decides to study whether pollution in lakes causes cancer so he collects 100 fish from each of two lakes, one known to be polluted and the other known to be pristine. He then dissects them and determines if they have tumors in their tissues or not. His data is shown below.
?
-What proportion of all fish have tumors?
A) 15%
B) 20%
C) 26%
D) 41%
?
-What proportion of all fish have tumors?
A) 15%
B) 20%
C) 26%
D) 41%
فتح الحزمة
افتح القفل للوصول البطاقات البالغ عددها 56 في هذه المجموعة.
فتح الحزمة
k this deck
23
Humans aren't the only animals that get cancer, other organisms get tumors as well and their risk may be influenced by environmental factors. An ecologist decides to study whether pollution in lakes causes cancer so he collects 100 fish from each of two lakes, one known to be polluted and the other known to be pristine. He then dissects them and determines if they have tumors in their tissues or not. His data is shown below.
?
-What is the relative risk of tumors for fish in the polluted lake compared to the pristine lake?
A) 1.11
B) 1.73
C) 1.99
D) 2.85
?
-What is the relative risk of tumors for fish in the polluted lake compared to the pristine lake?
A) 1.11
B) 1.73
C) 1.99
D) 2.85
فتح الحزمة
افتح القفل للوصول البطاقات البالغ عددها 56 في هذه المجموعة.
فتح الحزمة
k this deck
24
Humans aren't the only animals that get cancer, other organisms get tumors as well and their risk may be influenced by environmental factors. An ecologist decides to study whether pollution in lakes causes cancer so he collects 100 fish from each of two lakes, one known to be polluted and the other known to be pristine. He then dissects them and determines if they have tumors in their tissues or not. His data is shown below.
?
-What is the odds ratio for tumors for fish in the polluted lake compared to the pristine lake?
A) 1.11
B) 1.73
C) 1.99
D) 2.85
?
-What is the odds ratio for tumors for fish in the polluted lake compared to the pristine lake?
A) 1.11
B) 1.73
C) 1.99
D) 2.85
فتح الحزمة
افتح القفل للوصول البطاقات البالغ عددها 56 في هذه المجموعة.
فتح الحزمة
k this deck
25
Humans aren't the only animals that get cancer, other organisms get tumors as well and their risk may be influenced by environmental factors. An ecologist decides to study whether pollution in lakes causes cancer so he collects 100 fish from each of two lakes, one known to be polluted and the other known to be pristine. He then dissects them and determines if they have tumors in their tissues or not. His data is shown below.
?
-Assuming a null hypothesis of no relationship between exposure to pollution and risk of developing tumors, which of the following values is closest to the expected number of fish with tumors in the polluted lake?
A) 15.5
B) 20.5
C) 25.5
D) 30.5
?
-Assuming a null hypothesis of no relationship between exposure to pollution and risk of developing tumors, which of the following values is closest to the expected number of fish with tumors in the polluted lake?
A) 15.5
B) 20.5
C) 25.5
D) 30.5
فتح الحزمة
افتح القفل للوصول البطاقات البالغ عددها 56 في هذه المجموعة.
فتح الحزمة
k this deck
26
Humans aren't the only animals that get cancer, other organisms get tumors as well and their risk may be influenced by environmental factors. An ecologist decides to study whether pollution in lakes causes cancer so he collects 100 fish from each of two lakes, one known to be polluted and the other known to be pristine. He then dissects them and determines if they have tumors in their tissues or not. His data is shown below.
?
-To determine whether there appears to be a statistically significant relationship between exposure to pollution and risk of developing tumors he decides to conduct a ?2 analysis. When performing this analysis, which of the values below is closest to the contribution to the ?2 statistic from the "No tumors : pristine" category?
A) 0.38
B) 1.48
C) 2.58
D) 3.68
فتح الحزمة
افتح القفل للوصول البطاقات البالغ عددها 56 في هذه المجموعة.
فتح الحزمة
k this deck
27
Humans aren't the only animals that get cancer, other organisms get tumors as well and their risk may be influenced by environmental factors. An ecologist decides to study whether pollution in lakes causes cancer so he collects 100 fish from each of two lakes, one known to be polluted and the other known to be pristine. He then dissects them and determines if they have tumors in their tissues or not. His data is shown below.
?
-To determine whether there appears to be a statistically significant relationship between exposure to pollution and risk of developing tumors he decides to conduct a ?2 analysis. When performing this analysis, which of the values below is closest to the ?2 statistic he would obtain?
A) 3.7
B) 5.7
C) 7.7
D) 9.7
فتح الحزمة
افتح القفل للوصول البطاقات البالغ عددها 56 في هذه المجموعة.
فتح الحزمة
k this deck
28
To determine whether there appears to be a statistically significant relationship between exposure to pollution and risk of developing tumors he decides to conduct a χ2 analysis. Based on the results of this analysis, which of the following is the most appropriate conclusion?
A) Fish appear to be at a significantly higher risk of tumors in the polluted lake compared to the pristine lake (P < 0.05).
B) Fish appear to be at a significantly higher risk of tumors in the polluted lake compared to the pristine lake (P > 0.05).
C) Fish appear to be at a significantly lower risk of tumors in the polluted lake compared to the pristine lake (P < 0.05).
D) These data do not provide sufficient evidence that the risk of tumors differs in polluted or pristine lakes (P < 0.05).
فتح الحزمة
افتح القفل للوصول البطاقات البالغ عددها 56 في هذه المجموعة.
فتح الحزمة
k this deck
29
Consider an experiment in which adult laboratory mice were fed one of three diets: high fat, low fat, and a control diet. The mice were weighed, received these diets for 2 weeks, and then were weighed again. The table below shows the results of the experiment.
?
?
-What proportion of mice in the experiment gained weight?
A) 0.40
B) 0.60
C) 0.80
D) 0.90
?
?
-What proportion of mice in the experiment gained weight?
A) 0.40
B) 0.60
C) 0.80
D) 0.90
فتح الحزمة
افتح القفل للوصول البطاقات البالغ عددها 56 في هذه المجموعة.
فتح الحزمة
k this deck
30
Consider an experiment in which adult laboratory mice were fed one of three diets: high fat, low fat, and a control diet. The mice were weighed, received these diets for 2 weeks, and then were weighed again. The table below shows the results of the experiment.
?
?
-Assuming a null hypothesis of no relationship between diet and weight gain, which of the following values is closest to the expected count of individuals in the control group that gained weight?
A) 20
B) 40
C) 60
D) 70
?
?
-Assuming a null hypothesis of no relationship between diet and weight gain, which of the following values is closest to the expected count of individuals in the control group that gained weight?
A) 20
B) 40
C) 60
D) 70
فتح الحزمة
افتح القفل للوصول البطاقات البالغ عددها 56 في هذه المجموعة.
فتح الحزمة
k this deck
31
Consider an experiment in which adult laboratory mice were fed one of three diets: high fat, low fat, and a control diet. The mice were weighed, received these diets for 2 weeks, and then were weighed again. The table below shows the results of the experiment.
?
?
-To determine whether there appears to be a statistically significant relationship between diet and weight gain or loss we would conduct a ?2 analysis. When performing this analysis, which of the values below is closest to the contribution to the ?2 statistic from the "low fat : lost weight" category?
A) 6
B) 9
C) 14
D) 21
?
?
-To determine whether there appears to be a statistically significant relationship between diet and weight gain or loss we would conduct a ?2 analysis. When performing this analysis, which of the values below is closest to the contribution to the ?2 statistic from the "low fat : lost weight" category?
A) 6
B) 9
C) 14
D) 21
فتح الحزمة
افتح القفل للوصول البطاقات البالغ عددها 56 في هذه المجموعة.
فتح الحزمة
k this deck
32
Consider an experiment in which adult laboratory mice were fed one of three diets: high fat, low fat, and a control diet. The mice were weighed, received these diets for 2 weeks, and then were weighed again. The table below shows the results of the experiment.
?
?
-To determine whether there appears to be a statistically significant relationship between diet and weight gain or loss we would conduct a ?2 analysis. When performing this analysis, which of the values below is closest to the number of degrees of freedom we would use?
A) 2
B) 3
C) 4
D) 5
?
?
-To determine whether there appears to be a statistically significant relationship between diet and weight gain or loss we would conduct a ?2 analysis. When performing this analysis, which of the values below is closest to the number of degrees of freedom we would use?
A) 2
B) 3
C) 4
D) 5
فتح الحزمة
افتح القفل للوصول البطاقات البالغ عددها 56 في هذه المجموعة.
فتح الحزمة
k this deck
33
Consider an experiment in which adult laboratory mice were fed one of three diets: high fat, low fat, and a control diet. The mice were weighed, received these diets for 2 weeks, and then were weighed again. The table below shows the results of the experiment.
?
?
-To determine whether there appears to be a statistically significant relationship between diet and weight gain or loss we would conduct a ?2 analysis. When performing this analysis, which of the values below is closest to the ?2 statistic we would obtain?
A) 4
B) 14
C) 34
D) 54
?
?
-To determine whether there appears to be a statistically significant relationship between diet and weight gain or loss we would conduct a ?2 analysis. When performing this analysis, which of the values below is closest to the ?2 statistic we would obtain?
A) 4
B) 14
C) 34
D) 54
فتح الحزمة
افتح القفل للوصول البطاقات البالغ عددها 56 في هذه المجموعة.
فتح الحزمة
k this deck
34
Consider an experiment in which a pharmaceutical company is testing a new drug that they hope will lower cholesterol levels. They administer three treatments: A dose of the drug, a dose of a placebo, and a control group that receives neither drug nor placebo. after 24 hours they then measured the cholesterol levels and compared the values to baseline levels measured prior to treatment. The table below shows the results of the experiment.
??
-What proportion of individuals in the experiment showed cholesterol levels that increased or stayed the same?
A) 0.38
B) 0.46
C) 0.54
D) 0.62
??
-What proportion of individuals in the experiment showed cholesterol levels that increased or stayed the same?
A) 0.38
B) 0.46
C) 0.54
D) 0.62
فتح الحزمة
افتح القفل للوصول البطاقات البالغ عددها 56 في هذه المجموعة.
فتح الحزمة
k this deck
35
Consider an experiment in which a pharmaceutical company is testing a new drug that they hope will lower cholesterol levels. They administer three treatments: A dose of the drug, a dose of a placebo, and a control group that receives neither drug nor placebo. after 24 hours they then measured the cholesterol levels and compared the values to baseline levels measured prior to treatment. The table below shows the results of the experiment.
??
-Assuming a null hypothesis of no relationship between diet and weight gain, which of the following values is closest to the expected count of individuals in the placebo group that showed lower cholesterol levels?
A) 46
B) 49
C) 51
D) 54
??
-Assuming a null hypothesis of no relationship between diet and weight gain, which of the following values is closest to the expected count of individuals in the placebo group that showed lower cholesterol levels?
A) 46
B) 49
C) 51
D) 54
فتح الحزمة
افتح القفل للوصول البطاقات البالغ عددها 56 في هذه المجموعة.
فتح الحزمة
k this deck
36
Consider an experiment in which a pharmaceutical company is testing a new drug that they hope will lower cholesterol levels. They administer three treatments: A dose of the drug, a dose of a placebo, and a control group that receives neither drug nor placebo. after 24 hours they then measured the cholesterol levels and compared the values to baseline levels measured prior to treatment. The table below shows the results of the experiment.
??
-To determine whether there appears to be a statistically significant relationship between diet and weight gain or loss they would conduct a ?2 analysis. When performing this analysis, which of the values below is closest to the contribution to the ?2 statistic from the "drug : cholesterol lower" category?
A) 1.72
B) 1.91
C) 2.05
D) 2.21
فتح الحزمة
افتح القفل للوصول البطاقات البالغ عددها 56 في هذه المجموعة.
فتح الحزمة
k this deck
37
Consider an experiment in which a pharmaceutical company is testing a new drug that they hope will lower cholesterol levels. They administer three treatments: A dose of the drug, a dose of a placebo, and a control group that receives neither drug nor placebo. after 24 hours they then measured the cholesterol levels and compared the values to baseline levels measured prior to treatment. The table below shows the results of the experiment.
??
-To determine whether there appears to be a statistically significant relationship between the treatment and changes in cholesterol level they would conduct a ?2 analysis. When performing this analysis, which of the values below is closest to the ?2 value they would compare the calculated value to in order to determine significance at the 5% level?
A) 3.841
B) 5.991
C) 7.815
D) 9.488
فتح الحزمة
افتح القفل للوصول البطاقات البالغ عددها 56 في هذه المجموعة.
فتح الحزمة
k this deck
38
Consider an experiment in which a pharmaceutical company is testing a new drug that they hope will lower cholesterol levels. They administer three treatments: A dose of the drug, a dose of a placebo, and a control group that receives neither drug nor placebo. after 24 hours they then measured the cholesterol levels and compared the values to baseline levels measured prior to treatment. The table below shows the results of the experiment.
??
-To determine whether there appears to be a statistically significant relationship between the treatment and changes in cholesterol level they would conduct a ?2 analysis. When performing this analysis, which of the values below is closest to the ?2 statistic they would obtain?
A) 3.77
B) 4.32
C) 5.83
D) 6.94
فتح الحزمة
افتح القفل للوصول البطاقات البالغ عددها 56 في هذه المجموعة.
فتح الحزمة
k this deck
39
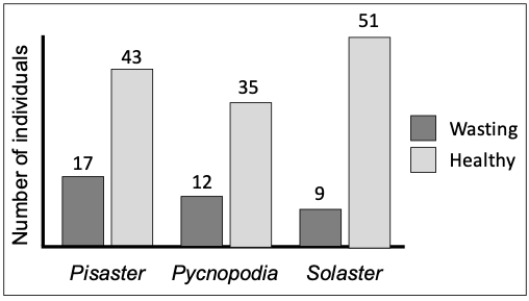
Sea star wasting disease kills sea stars (i.e., starfish) and has no known cause. It is currently a major problem on the West Coast and many sea stars are infected and dying. Consider a study in which a researcher is interested in whether susceptibility varies between the species. He travels to a site known to show wasting and counts the numbers of healthy and wasting individuals from three different species. His data is shown in the histogram below.
-To determine whether there appears to be a statistically significant relationship between the treatment and changes in cholesterol level they would conduct a χ2 analysis. When performing this analysis, which of the following best describes the conclusion they could make from the data?
A) These data do not provide sufficient evidence that treatment type is associated with changes in cholesterol level.
B) There is a statistically significant relationship between treatment and changes in cholesterol level, the drug lowers cholesterol more than the other treatments.
C) There is a statistically significant relationship between treatment and changes in cholesterol level, the placebo lowers cholesterol more than the other treatments.
D) There is a statistically significant relationship between treatment and changes in cholesterol level, the control group showed lower cholesterol compared to the other treatments.
فتح الحزمة
افتح القفل للوصول البطاقات البالغ عددها 56 في هذه المجموعة.
فتح الحزمة
k this deck
40
Sea star wasting disease kills sea stars (i.e., starfish) and has no known cause. It is currently a major problem on the West Coast and many sea stars are infected and dying. Consider a study in which a researcher is interested in whether susceptibility varies between the species. He travels to a site known to show wasting and counts the numbers of healthy and wasting individuals from three different species. His data is shown in the histogram below.
-Assuming a null hypothesis of no relationship between species and prevalence of wasting disease, which of the following values is closest to the expected count of Solaster with wasting disease?
A) 10.69
B) 13.65
C) 15.13
D) 17.22
-Assuming a null hypothesis of no relationship between species and prevalence of wasting disease, which of the following values is closest to the expected count of Solaster with wasting disease?
A) 10.69
B) 13.65
C) 15.13
D) 17.22
فتح الحزمة
افتح القفل للوصول البطاقات البالغ عددها 56 في هذه المجموعة.
فتح الحزمة
k this deck
41
Sea star wasting disease kills sea stars (i.e., starfish) and has no known cause. It is currently a major problem on the West Coast and many sea stars are infected and dying. Consider a study in which a researcher is interested in whether susceptibility varies between the species. He travels to a site known to show wasting and counts the numbers of healthy and wasting individuals from three different species. His data is shown in the histogram below.
-To determine whether there appears to be a statistically significant relationship between species and prevalence of wasting disease he would conduct a χ2 analysis. When performing this analysis, which of the values below is closest to the number of degrees of freedom he would use?
A) 1
B) 2
C) 3
D) 4
فتح الحزمة
افتح القفل للوصول البطاقات البالغ عددها 56 في هذه المجموعة.
فتح الحزمة
k this deck
42
Sea star wasting disease kills sea stars (i.e., starfish) and has no known cause. It is currently a major problem on the West Coast and many sea stars are infected and dying. Consider a study in which a researcher is interested in whether susceptibility varies between the species. He travels to a site known to show wasting and counts the numbers of healthy and wasting individuals from three different species. His data is shown in the histogram below.
-To determine whether there appears to be a statistically significant relationship between species and prevalence of wasting disease he would conduct a χ2 analysis. When performing this analysis, which of the values below is closest to the contribution to the χ2 statistic from the "Healthy : Pycnopodia" category?
A) 0.47
B) 0.82
C) 1.59
D) 2.14
فتح الحزمة
افتح القفل للوصول البطاقات البالغ عددها 56 في هذه المجموعة.
فتح الحزمة
k this deck
43
Sea star wasting disease kills sea stars (i.e., starfish) and has no known cause. It is currently a major problem on the West Coast and many sea stars are infected and dying. Consider a study in which a researcher is interested in whether susceptibility varies between the species. He travels to a site known to show wasting and counts the numbers of healthy and wasting individuals from three different species. His data is shown in the histogram below.
-To determine whether there appears to be a statistically significant relationship between species and prevalence of wasting disease he would conduct a χ2 analysis. When performing this analysis, which of the values below is closest to the χ2 statistic he would obtain?
A) 3.3
B) 5.7
C) 9.5
D) 11.2
-To determine whether there appears to be a statistically significant relationship between species and prevalence of wasting disease he would conduct a χ2 analysis. When performing this analysis, which of the values below is closest to the χ2 statistic he would obtain?
A) 3.3
B) 5.7
C) 9.5
D) 11.2
فتح الحزمة
افتح القفل للوصول البطاقات البالغ عددها 56 في هذه المجموعة.
فتح الحزمة
k this deck
44
Sea star wasting disease kills sea stars (i.e., starfish) and has no known cause. It is currently a major problem on the West Coast and many sea stars are infected and dying. Consider a study in which a researcher is interested in whether susceptibility varies between the species. He travels to a site known to show wasting and counts the numbers of healthy and wasting individuals from three different species. His data is shown in the histogram below.
-To determine whether there appears to be a statistically significant relationship between species and prevalence of wasting disease he would conduct a χ2 analysis. After performing this analysis, which of the ranges below best describes the P value he would obtain?
A) P > 0.05
B) 0.05 > P > 0.025
C) 0.025 > P > 0.01
D) P < 0.01
فتح الحزمة
افتح القفل للوصول البطاقات البالغ عددها 56 في هذه المجموعة.
فتح الحزمة
k this deck
45
A microbial ecologist is interested in whether the microbial community of a pond changes when it rains. She knows that rainfall will increase the number of bacteria, but she is interested in the pattern of diversity. She collects a water sample from a pond two days before a rainfall and two days after and plates her samples on agar (a method to measure bacteria) and counts the number of colonies she observes for each of three bacteria: E. Coli, Salmonella, and Giardia. In the pre-rain sample she observes 21, 57, and 32 colonies respectively. In the post-rain sample she observes 59, 83, and 88 colonies respectively.
-Which of the mosaic tables shown correctly depicts this data?
A) Graph A
B) Graph B
C) Graph C
D) Graph D
-Which of the mosaic tables shown correctly depicts this data?
A) Graph A
B) Graph B
C) Graph C
D) Graph D
فتح الحزمة
افتح القفل للوصول البطاقات البالغ عددها 56 في هذه المجموعة.
فتح الحزمة
k this deck
46
A microbial ecologist is interested in whether the microbial community of a pond changes when it rains. She knows that rainfall will increase the number of bacteria, but she is interested in the pattern of diversity. She collects a water sample from a pond two days before a rainfall and two days after and plates her samples on agar (a method to measure bacteria) and counts the number of colonies she observes for each of three bacteria: E. Coli, Salmonella, and Giardia. In the pre-rain sample she observes 21, 57, and 32 colonies respectively. In the post-rain sample she observes 59, 83, and 88 colonies respectively.
-Assuming a null hypothesis of no relationship between rainfall and bacterial diversity, which of the following values is closest to the expected count of
A) 39
B) 44
C) 49
D) 54
-Assuming a null hypothesis of no relationship between rainfall and bacterial diversity, which of the following values is closest to the expected count of
A) 39
B) 44
C) 49
D) 54
فتح الحزمة
افتح القفل للوصول البطاقات البالغ عددها 56 في هذه المجموعة.
فتح الحزمة
k this deck
47
A microbial ecologist is interested in whether the microbial community of a pond changes when it rains. She knows that rainfall will increase the number of bacteria, but she is interested in the pattern of diversity. She collects a water sample from a pond two days before a rainfall and two days after and plates her samples on agar (a method to measure bacteria) and counts the number of colonies she observes for each of three bacteria: E. Coli, Salmonella, and Giardia. In the pre-rain sample she observes 21, 57, and 32 colonies respectively. In the post-rain sample she observes 59, 83, and 88 colonies respectively.
-To determine whether there appears to be a statistically significant relationship between rainfall and bacterial diversity she would conduct a χ2 analysis. When performing this analysis, which of the values below is closest to the contribution to the χ2 statistic from the "pre-rainfall : Salmonella" category?
A) 1.01
B) 2.02
C) 3.03
D) 4.04
فتح الحزمة
افتح القفل للوصول البطاقات البالغ عددها 56 في هذه المجموعة.
فتح الحزمة
k this deck
48
A microbial ecologist is interested in whether the microbial community of a pond changes when it rains. She knows that rainfall will increase the number of bacteria, but she is interested in the pattern of diversity. She collects a water sample from a pond two days before a rainfall and two days after and plates her samples on agar (a method to measure bacteria) and counts the number of colonies she observes for each of three bacteria: E. Coli, Salmonella, and Giardia. In the pre-rain sample she observes 21, 57, and 32 colonies respectively. In the post-rain sample she observes 59, 83, and 88 colonies respectively.
-To determine whether there appears to be a statistically significant relationship between rainfall and bacterial diversity she would conduct a χ2 analysis. When performing this analysis, which of the values below is closest to the number of degrees of freedom she would use?
A) 1
B) 2
C) 3
D) 4
-To determine whether there appears to be a statistically significant relationship between rainfall and bacterial diversity she would conduct a χ2 analysis. When performing this analysis, which of the values below is closest to the number of degrees of freedom she would use?
A) 1
B) 2
C) 3
D) 4
فتح الحزمة
افتح القفل للوصول البطاقات البالغ عددها 56 في هذه المجموعة.
فتح الحزمة
k this deck
49
A microbial ecologist is interested in whether the microbial community of a pond changes when it rains. She knows that rainfall will increase the number of bacteria, but she is interested in the pattern of diversity. She collects a water sample from a pond two days before a rainfall and two days after and plates her samples on agar (a method to measure bacteria) and counts the number of colonies she observes for each of three bacteria: E. Coli, Salmonella, and Giardia. In the pre-rain sample she observes 21, 57, and 32 colonies respectively. In the post-rain sample she observes 59, 83, and 88 colonies respectively.
-To determine whether there appears to be a statistically significant relationship between rainfall and bacterial diversity she would conduct a χ2 analysis. When performing this analysis, which of the values below is closest to the χ2 statistic she would obtain?
A) 2.6
B) 6.2
C) 6.7
D) 7.6
-To determine whether there appears to be a statistically significant relationship between rainfall and bacterial diversity she would conduct a χ2 analysis. When performing this analysis, which of the values below is closest to the χ2 statistic she would obtain?
A) 2.6
B) 6.2
C) 6.7
D) 7.6
فتح الحزمة
افتح القفل للوصول البطاقات البالغ عددها 56 في هذه المجموعة.
فتح الحزمة
k this deck
50
A microbial ecologist is interested in whether the microbial community of a pond changes when it rains. She knows that rainfall will increase the number of bacteria, but she is interested in the pattern of diversity. She collects a water sample from a pond two days before a rainfall and two days after and plates her samples on agar (a method to measure bacteria) and counts the number of colonies she observes for each of three bacteria: E. Coli, Salmonella, and Giardia. In the pre-rain sample she observes 21, 57, and 32 colonies respectively. In the post-rain sample she observes 59, 83, and 88 colonies respectively.
-To determine whether there appears to be a statistically significant relationship between rainfall and bacterial diversity she would conduct a χ2 analysis. After performing this analysis, which of the ranges below best describes the P value she would obtain?
A) P > 0.05
B) 0.05 > P > 0.025
C) 0.025 > P > 0.01
D) P < 0.01
فتح الحزمة
افتح القفل للوصول البطاقات البالغ عددها 56 في هذه المجموعة.
فتح الحزمة
k this deck
51
To determine whether there appears to be a statistically significant relationship between rainfall and bacterial diversity she would conduct a χ2 analysis. After performing this analysis, which of the following best describes the conclusion she could make from the data?
A) There appears to be no statistically significant relationship between rainfall and bacterial diversity.
B) There is a statistically significant relationship between rainfall and bacterial diversity, the
C) There is a statistically significant relationship between rainfall and bacterial diversity, the Salmonella is less common (relative to the other bacteria) after rainfall than before.
D) There is a statistically significant relationship between rainfall and bacterial diversity, the Giardia is less common (relative to the other bacteria) after rainfall than before.
فتح الحزمة
افتح القفل للوصول البطاقات البالغ عددها 56 في هذه المجموعة.
فتح الحزمة
k this deck
52
The relative risk and odds ratio measure similar, but distinct, things. Each has an advantage over the other so both are often calculated. For each of these two statistics, what is the advantage it has compared to the alternative?
فتح الحزمة
افتح القفل للوصول البطاقات البالغ عددها 56 في هذه المجموعة.
فتح الحزمة
k this deck
53
There are two situations having to do with expected frequencies that create problems for χ2 analyses. Describe these two situations and two solutions that resolve these issues.
فتح الحزمة
افتح القفل للوصول البطاقات البالغ عددها 56 في هذه المجموعة.
فتح الحزمة
k this deck
54
What is the main benefit of the Fisher's Exact test compared to a traditional χ2 analysis?
فتح الحزمة
افتح القفل للوصول البطاقات البالغ عددها 56 في هذه المجموعة.
فتح الحزمة
k this deck
55
Consider an observational study in which a sample of individuals with a certain condition are compared to a second reference group that do not have the condition. Proportions of individuals with risk factor in each group can then be compared.
(a) This type of study is called a(n) _______ - _______ study.
(b) With this type of data we can do a(n) _______ - _______ analysis, but not a(n) _______ - _______ .
(a) This type of study is called a(n) _______ - _______ study.
(b) With this type of data we can do a(n) _______ - _______ analysis, but not a(n) _______ - _______ .
فتح الحزمة
افتح القفل للوصول البطاقات البالغ عددها 56 في هذه المجموعة.
فتح الحزمة
k this deck
56
Under what circumstances are the relative risk and odds ratio most similar?
فتح الحزمة
افتح القفل للوصول البطاقات البالغ عددها 56 في هذه المجموعة.
فتح الحزمة
k this deck
فتح الحزمة
افتح القفل للوصول البطاقات البالغ عددها 56 في هذه المجموعة.


