Deck 15: Comparing Means of More Than Two Groups
ملء الشاشة (f)
سؤال
سؤال
سؤال
سؤال
سؤال
سؤال
سؤال
سؤال
سؤال
سؤال
سؤال
سؤال
سؤال
سؤال
سؤال
سؤال
سؤال
سؤال
سؤال
سؤال
سؤال
سؤال
سؤال
سؤال
سؤال
سؤال
سؤال
Consider the figure showing the results of a Tukey-Kramer procedure on the means of individuals collected from four different environments. If the bars represent 95% confidence intervals, what letter or combination of letters would the blank have?
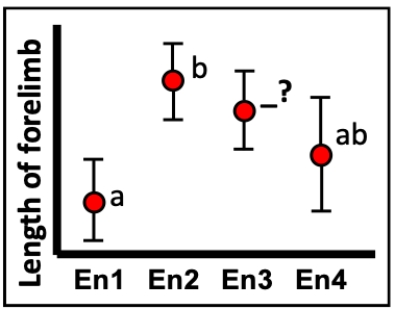
A) a
B) ab
C) b
D) c
A) a
B) ab
C) b
D) c
سؤال
Consider the figure showing the results of a Tukey-Kramer procedure on the means of individuals collected from four different environments. If the bars represent 95% confidence intervals, what letter or combination of letters would the blank have?
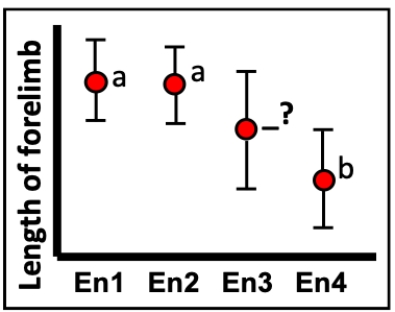
A) a
B) ab
C) b
D) c
A) a
B) ab
C) b
D) c
سؤال
سؤال
سؤال
سؤال
سؤال
سؤال
سؤال
سؤال
سؤال
سؤال
سؤال
سؤال
سؤال
سؤال
سؤال
سؤال
سؤال
سؤال
سؤال
سؤال
Consider a study involving six populations from which we draw samples of 12 values each in which the group mean square is 426 and the error mean square is 1416.
 (a) Complete the ANOVA table.
(b) Does it appear that any of the population the samples are drawn from have means that differ from one another?
(a) Complete the ANOVA table.(b) Does it appear that any of the population the samples are drawn from have means that differ from one another?
سؤال
Consider a study involving seven populations from which we draw samples of 13 values each in which the group mean square is 315 and the error mean square is 2020.
 (a) Complete the ANOVA table.
(b) Does it appear that any of the population the samples are drawn from have means that differ from one another?
(a) Complete the ANOVA table.(b) Does it appear that any of the population the samples are drawn from have means that differ from one another?
سؤال
سؤال
سؤال
سؤال
Using the data set shown, calculate all the values you need to complete the ANOVA table.

سؤال
Using the data set shown, calculate all the values you need to complete an ANOVA table.


فتح الحزمة
قم بالتسجيل لفتح البطاقات في هذه المجموعة!
Unlock Deck
Unlock Deck
1/54
العب
ملء الشاشة (f)
Deck 15: Comparing Means of More Than Two Groups
1
Which of the following best describes the alternative hypothesis is an ANOVA analysis?
A) All the population means are different from at least one other.
B) All the population means are different from one another.
C) At least one population's mean is different from all the others.
D) At least one population's mean is different from at least one other.
A) All the population means are different from at least one other.
B) All the population means are different from one another.
C) At least one population's mean is different from all the others.
D) At least one population's mean is different from at least one other.
D
2
Which of the following best describes when we would reject the null hypothesis when doing an ANOVA analysis?
A) If the variation of group means is less than expected based on the variation between values within each group.
B) If the variation of group means is more than expected based on the variation between values within each group.
C) If the variation of values within each group is less than expected based on the variation between values of the group means.
D) If the variation of values within each group is more than expected based on the variation between values of the group means.
B
3
The error mean square is best described by which of the following?
A) It measures how many values there are.
B) It measures the variation between all values in all of the groups.
C) It measures the variation between the means of the groups.
D) It measures the variation between values within each of the groups.
A) It measures how many values there are.
B) It measures the variation between all values in all of the groups.
C) It measures the variation between the means of the groups.
D) It measures the variation between values within each of the groups.
D
4
Which of the following is what we expect if the samples we use in an ANOVA come from populations with the same means?
A) The error mean square will be identical to the group mean square.
B) The error mean square will be larger than the group mean square.
C) The error mean square will be smaller than the group mean square
D) The error mean square will be very close to than the group mean square.
A) The error mean square will be identical to the group mean square.
B) The error mean square will be larger than the group mean square.
C) The error mean square will be smaller than the group mean square
D) The error mean square will be very close to than the group mean square.
فتح الحزمة
افتح القفل للوصول البطاقات البالغ عددها 54 في هذه المجموعة.
فتح الحزمة
k this deck
5
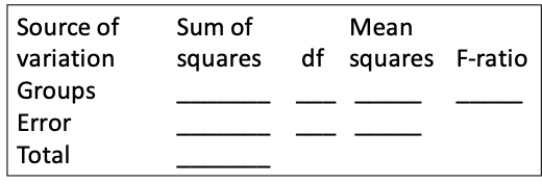
Consider the partially completed ANOVA table shown.
?
?
-How many values are in each group of the data set this is based on?
A) 5
B) 12
C) 14
D) 15
?
?
-How many values are in each group of the data set this is based on?
A) 5
B) 12
C) 14
D) 15
فتح الحزمة
افتح القفل للوصول البطاقات البالغ عددها 54 في هذه المجموعة.
فتح الحزمة
k this deck
6
Consider the partially completed ANOVA table shown.
?
?
-What is the F-ratio for this ANOVA table?
A) 9.28
B) 10.28
C) 16.33
D) 17.33
?
?
-What is the F-ratio for this ANOVA table?
A) 9.28
B) 10.28
C) 16.33
D) 17.33
فتح الحزمة
افتح القفل للوصول البطاقات البالغ عددها 54 في هذه المجموعة.
فتح الحزمة
k this deck
7
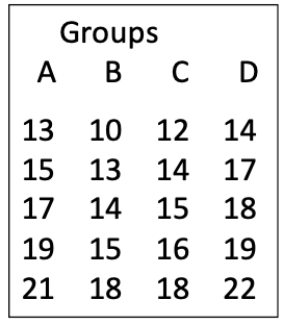
Consider the data table shown with values for five individuals measured in each of four groups (A, B, C, and D). We will conduct an ANOVA analysis of this.
?
?
-What are the means of the groups and overall mean?
A) 8, 11, 12, 15, and 12
B) 9, 11, 12, 15, and 12
C) 10, 11, 12, 15, and 11
D) 10, 11, 12, 15, and 12
?
?
-What are the means of the groups and overall mean?
A) 8, 11, 12, 15, and 12
B) 9, 11, 12, 15, and 12
C) 10, 11, 12, 15, and 11
D) 10, 11, 12, 15, and 12
فتح الحزمة
افتح القفل للوصول البطاقات البالغ عددها 54 في هذه المجموعة.
فتح الحزمة
k this deck
8
Consider the data table shown with values for five individuals measured in each of four groups (A, B, C, and D). We will conduct an ANOVA analysis of this.
?
?
-What is the SSgroups?
A) 45
B) 60
C) 70
D) 85
?
?
-What is the SSgroups?
A) 45
B) 60
C) 70
D) 85
فتح الحزمة
افتح القفل للوصول البطاقات البالغ عددها 54 في هذه المجموعة.
فتح الحزمة
k this deck
9
Consider the data table shown with values for five individuals measured in each of four groups (A, B, C, and D). We will conduct an ANOVA analysis of this.
?
?
-What is the group mean square?
A) 17.50
B) 19.33
C) 21.50
D) 23.33
?
?
-What is the group mean square?
A) 17.50
B) 19.33
C) 21.50
D) 23.33
فتح الحزمة
افتح القفل للوصول البطاقات البالغ عددها 54 في هذه المجموعة.
فتح الحزمة
k this deck
10
Consider the data table shown with values for five individuals measured in each of four groups (A, B, C, and D). We will conduct an ANOVA analysis of this.
?
?
-What is the SSerror?
A) 108
B) 128
C) 148
D) 168
?
?
-What is the SSerror?
A) 108
B) 128
C) 148
D) 168
فتح الحزمة
افتح القفل للوصول البطاقات البالغ عددها 54 في هذه المجموعة.
فتح الحزمة
k this deck
11
Consider the data table shown with values for five individuals measured in each of four groups (A, B, C, and D). We will conduct an ANOVA analysis of this.
?
?
-What is the error mean square?
A) 8
B) 9
C) 10
D) 11
?
?
-What is the error mean square?
A) 8
B) 9
C) 10
D) 11
فتح الحزمة
افتح القفل للوصول البطاقات البالغ عددها 54 في هذه المجموعة.
فتح الحزمة
k this deck
12
Consider the data table shown with values for five individuals measured in each of four groups (A, B, C, and D). We will conduct an ANOVA analysis of this.
?
?
-What is the value of the F-ratio we will use in the analysis?
A) 1.83
B) 2.92
C) 6.34
D) 8.75
?
?
-What is the value of the F-ratio we will use in the analysis?
A) 1.83
B) 2.92
C) 6.34
D) 8.75
فتح الحزمة
افتح القفل للوصول البطاقات البالغ عددها 54 في هذه المجموعة.
فتح الحزمة
k this deck
13
Consider the data table shown with values for five individuals measured in each of four groups (A, B, C, and D). We will conduct an ANOVA analysis of this.
?
?
-What is the value of the R2 value we obtain from the analysis?
A) 0.222
B) 0.333
C) 0.444
D) 0.555
?
?
-What is the value of the R2 value we obtain from the analysis?
A) 0.222
B) 0.333
C) 0.444
D) 0.555
فتح الحزمة
افتح القفل للوصول البطاقات البالغ عددها 54 في هذه المجموعة.
فتح الحزمة
k this deck
14
Consider the data table shown with values for five individuals measured in each of four groups (A, B, C, and D). We will conduct an ANOVA analysis of this.
?
?
-To test the significance of the F-ratio value, what degrees of freedom would we use?
A) df = 3 in the numerator, df = 12 in the denominator
B) df = 3 in the numerator, df = 16 in the denominator
C) df = 4 in the numerator, df = 12 in the denominator
D) df = 4 in the numerator, df = 16 in the denominator
?
?
-To test the significance of the F-ratio value, what degrees of freedom would we use?
A) df = 3 in the numerator, df = 12 in the denominator
B) df = 3 in the numerator, df = 16 in the denominator
C) df = 4 in the numerator, df = 12 in the denominator
D) df = 4 in the numerator, df = 16 in the denominator
فتح الحزمة
افتح القفل للوصول البطاقات البالغ عددها 54 في هذه المجموعة.
فتح الحزمة
k this deck
15
Use your calculated F-ratio, the degrees of freedom, and your table of critical F values to make a conclusion for this test?
A) P < 0.05, none of the means seem to differ.
B) P < 0.05, at least one of the means seems to differ.
C) P > 0.05, none of the means seem to differ.
D) P > 0.05, at least one of the means seems to differ.
A) P < 0.05, none of the means seem to differ.
B) P < 0.05, at least one of the means seems to differ.
C) P > 0.05, none of the means seem to differ.
D) P > 0.05, at least one of the means seems to differ.
فتح الحزمة
افتح القفل للوصول البطاقات البالغ عددها 54 في هذه المجموعة.
فتح الحزمة
k this deck
16
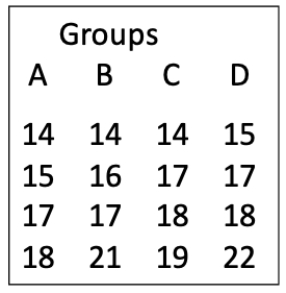
Consider the data table shown with values for six individuals measured in each of four groups (A, B, C, and D). We will conduct an ANOVA analysis of this.
?
-What are the means of the groups and overall mean?
A) 12, 13, 13, 19, and 15
B) 13, 13, 14, 19, and 15
C) 13, 14, 14, 19, and 15
D) 14, 14, 15, 19, and 15
?
-What are the means of the groups and overall mean?
A) 12, 13, 13, 19, and 15
B) 13, 13, 14, 19, and 15
C) 13, 14, 14, 19, and 15
D) 14, 14, 15, 19, and 15
فتح الحزمة
افتح القفل للوصول البطاقات البالغ عددها 54 في هذه المجموعة.
فتح الحزمة
k this deck
17
Consider the data table shown with values for six individuals measured in each of four groups (A, B, C, and D). We will conduct an ANOVA analysis of this.
?
-What is the SSgroups?
A) 72
B) 80
C) 88
D) 96
?
-What is the SSgroups?
A) 72
B) 80
C) 88
D) 96
فتح الحزمة
افتح القفل للوصول البطاقات البالغ عددها 54 في هذه المجموعة.
فتح الحزمة
k this deck
18
Consider the data table shown with values for six individuals measured in each of four groups (A, B, C, and D). We will conduct an ANOVA analysis of this.
?
-What is the group mean square?
A) 19.33
B) 24.50
C) 29.33
D) 34.50
?
-What is the group mean square?
A) 19.33
B) 24.50
C) 29.33
D) 34.50
فتح الحزمة
افتح القفل للوصول البطاقات البالغ عددها 54 في هذه المجموعة.
فتح الحزمة
k this deck
19
Consider the data table shown with values for six individuals measured in each of four groups (A, B, C, and D). We will conduct an ANOVA analysis of this.
?
-What is the SSerror?
A) 64.00
B) 72.00
C) 80.00
D) 88.00
?
-What is the SSerror?
A) 64.00
B) 72.00
C) 80.00
D) 88.00
فتح الحزمة
افتح القفل للوصول البطاقات البالغ عددها 54 في هذه المجموعة.
فتح الحزمة
k this deck
20
Consider the data table shown with values for six individuals measured in each of four groups (A, B, C, and D). We will conduct an ANOVA analysis of this.
?
-What is the error mean square?
A) 4.66
B) 5.00
C) 5.33
D) 5.66
?
-What is the error mean square?
A) 4.66
B) 5.00
C) 5.33
D) 5.66
فتح الحزمة
افتح القفل للوصول البطاقات البالغ عددها 54 في هذه المجموعة.
فتح الحزمة
k this deck
21
Consider the data table shown with values for six individuals measured in each of four groups (A, B, C, and D). We will conduct an ANOVA analysis of this.
?
-What is the value of the F-ratio we will use in the analysis?
A) 5.00
B) 5.25
C) 5.50
D) 5.75
?
-What is the value of the F-ratio we will use in the analysis?
A) 5.00
B) 5.25
C) 5.50
D) 5.75
فتح الحزمة
افتح القفل للوصول البطاقات البالغ عددها 54 في هذه المجموعة.
فتح الحزمة
k this deck
22
Consider the data table shown with values for six individuals measured in each of four groups (A, B, C, and D). We will conduct an ANOVA analysis of this.
?
-To test the significance of the F-ratio value, what degrees of freedom would we use?
A) df = 2 in the numerator, df = 12 in the denominator.
B) df = 2 in the numerator, df = 15 in the denominator.
C) df = 3 in the numerator, df = 12 in the denominator.
D) df = 3 in the numerator, df = 15 in the denominator.
فتح الحزمة
افتح القفل للوصول البطاقات البالغ عددها 54 في هذه المجموعة.
فتح الحزمة
k this deck
23
Consider the data table shown with values for six individuals measured in each of four groups (A, B, C, and D). We will conduct an ANOVA analysis of this.
?
-Use your calculated F-ratio, the degrees of freedom, and your table of critical F values to make a conclusion for this test?
A) P < 0.05, none of the means seem to differ.
B) P < 0.05, at least one of the means seems to differ.
C) P > 0.05, none of the means seem to differ.
D) P > 0.05, at least one of the means seems to differ.
فتح الحزمة
افتح القفل للوصول البطاقات البالغ عددها 54 في هذه المجموعة.
فتح الحزمة
k this deck
24
Which of the following is not an assumption of the ANOVA?
A) The populations exhibit normal distributions.
B) The populations have equal variances.
C) The values are randomly chosen from the populations.
D) The values are randomly chosen from the samples.
A) The populations exhibit normal distributions.
B) The populations have equal variances.
C) The values are randomly chosen from the populations.
D) The values are randomly chosen from the samples.
فتح الحزمة
افتح القفل للوصول البطاقات البالغ عددها 54 في هذه المجموعة.
فتح الحزمة
k this deck
25
Usually for an ANOVA the variances in all the groups should be the same, but when can this assumption be relaxed?
A) The samples are large, the same size, and the variances differ by less than tenfold.
B) The samples are large, the same size, and the variances differ by less than threefold.
C) The samples are small, the same size, and the variances differ by less than tenfold.
D) The samples are small, the same size, and the variances differ by less than threefold.
فتح الحزمة
افتح القفل للوصول البطاقات البالغ عددها 54 في هذه المجموعة.
فتح الحزمة
k this deck
26
Planned comparisons after an ANOVA using the t-test procedure tend to have higher precisions than regular two-sample t-tests. Why is that?
A) The chosen pair of groups will always have the largest difference from among all the groups in the ANOVA.
B) The degrees of freedom value used to define the confidence intervals is always larger.
C) The MSerror is always less than the pooled variance.
D) The standard error is always less using all the groups rather than just two.
فتح الحزمة
افتح القفل للوصول البطاقات البالغ عددها 54 في هذه المجموعة.
فتح الحزمة
k this deck
27
Consider the figure showing the results of a Tukey-Kramer procedure on the means of individuals collected from four different environments. If the bars represent 95% confidence intervals, what letter or combination of letters would the blank have?
A) a
B) ab
C) b
D) c
A) a
B) ab
C) b
D) c
فتح الحزمة
افتح القفل للوصول البطاقات البالغ عددها 54 في هذه المجموعة.
فتح الحزمة
k this deck
28
Consider the figure showing the results of a Tukey-Kramer procedure on the means of individuals collected from four different environments. If the bars represent 95% confidence intervals, what letter or combination of letters would the blank have?
A) a
B) ab
C) b
D) c
A) a
B) ab
C) b
D) c
فتح الحزمة
افتح القفل للوصول البطاقات البالغ عددها 54 في هذه المجموعة.
فتح الحزمة
k this deck
29
If groups are predefined and of interest themselves, the explanatory variable is called a(n) ____ effect, but if the groups are randomly sampled from a population of possible groups, the explanatory variable is called a(n) ____ effect.
A) fixed; random
B) focal; independent
C) independent; focal
D) random; fixed
A) fixed; random
B) focal; independent
C) independent; focal
D) random; fixed
فتح الحزمة
افتح القفل للوصول البطاقات البالغ عددها 54 في هذه المجموعة.
فتح الحزمة
k this deck
30
When studying randomly chosen groups, we don't tend to do which of the following?
A) Create an ANOVA table.
B) Compare the within-group variance to the between-group variance.
C) Estimate variance components.
D) Test a null hypothesis.
A) Create an ANOVA table.
B) Compare the within-group variance to the between-group variance.
C) Estimate variance components.
D) Test a null hypothesis.
فتح الحزمة
افتح القفل للوصول البطاقات البالغ عددها 54 في هذه المجموعة.
فتح الحزمة
k this deck
31
Based on the ANOVA table shown, what is the value for this data?
?
?
A) 4.55
B) 4.77
C) 4.99
D) 5.22
?
?
A) 4.55
B) 4.77
C) 4.99
D) 5.22
فتح الحزمة
افتح القفل للوصول البطاقات البالغ عددها 54 في هذه المجموعة.
فتح الحزمة
k this deck
32
Based on the ANOVA table shown, what is the repeatability for this data?
?
?
A) 0.190
B) 0.322
C) 0.345
D) 0.408
?
?
A) 0.190
B) 0.322
C) 0.345
D) 0.408
فتح الحزمة
افتح القفل للوصول البطاقات البالغ عددها 54 في هذه المجموعة.
فتح الحزمة
k this deck
33
In an ANOVA analysis, the R2 measures the total variation in the data.
فتح الحزمة
افتح القفل للوصول البطاقات البالغ عددها 54 في هذه المجموعة.
فتح الحزمة
k this deck
34
In an ANOVA analysis, the R2 is likely to be larger when the P-value is smaller and vice-versa.
فتح الحزمة
افتح القفل للوصول البطاقات البالغ عددها 54 في هذه المجموعة.
فتح الحزمة
k this deck
35
The ANOVA technique requires more than two groups.
فتح الحزمة
افتح القفل للوصول البطاقات البالغ عددها 54 في هذه المجموعة.
فتح الحزمة
k this deck
36
The ANOVA techniques is robust to violations of its assumptions when sample sizes are large.
فتح الحزمة
افتح القفل للوصول البطاقات البالغ عددها 54 في هذه المجموعة.
فتح الحزمة
k this deck
37
If the normality assumption of the single-factor ANOVA is violated, then the Kruskal-Wallis test is a good alternative as long as the sample sizes are large and the distributions are similar.
فتح الحزمة
افتح القفل للوصول البطاقات البالغ عددها 54 في هذه المجموعة.
فتح الحزمة
k this deck
38
A planned comparison when doing an ANOVA must be specified before the analysis, never afterwards.
فتح الحزمة
افتح القفل للوصول البطاقات البالغ عددها 54 في هذه المجموعة.
فتح الحزمة
k this deck
39
A planned comparison is really just a t-test, but using a standard error based on the variance from all the groups.
فتح الحزمة
افتح القفل للوصول البطاقات البالغ عددها 54 في هذه المجموعة.
فتح الحزمة
k this deck
40
Planned comparisons are slightly more robust to violations of the assumptions of the ANOVA than the ANOVA they follow.
فتح الحزمة
افتح القفل للوصول البطاقات البالغ عددها 54 في هذه المجموعة.
فتح الحزمة
k this deck
41
When using the Tukey-Kramer method, the probability of making a Type I error is α for each pairwise comparison made.
فتح الحزمة
افتح القفل للوصول البطاقات البالغ عددها 54 في هذه المجموعة.
فتح الحزمة
k this deck
42
When using the Tukey-Kramer method, the P-value is exact when the sample sizes in all groups are the same.
فتح الحزمة
افتح القفل للوصول البطاقات البالغ عددها 54 في هذه المجموعة.
فتح الحزمة
k this deck
43
A study examining the heights of single individuals from each of a series of families based on whether the family was vegetarian or not would be analyzed using a random-effects ANOVA.
فتح الحزمة
افتح القفل للوصول البطاقات البالغ عددها 54 في هذه المجموعة.
فتح الحزمة
k this deck
44
A study examining the heights of multiple individuals in each of a series of families chosen at random from a population would be analyzed using a random-effects ANOVA.
فتح الحزمة
افتح القفل للوصول البطاقات البالغ عددها 54 في هذه المجموعة.
فتح الحزمة
k this deck
45
The repeatability measures the overall similarity of repeat measurements made on the same group.
فتح الحزمة
افتح القفل للوصول البطاقات البالغ عددها 54 في هذه المجموعة.
فتح الحزمة
k this deck
46
An experimental mistake is always equivalent to either a Type I or Type II error.
فتح الحزمة
افتح القفل للوصول البطاقات البالغ عددها 54 في هذه المجموعة.
فتح الحزمة
k this deck
47
Describe the reason we need a technique like the ANOVA. Illustrate the problem with an example using t-tests to study several groups. Make reference to the appropriate type of statistical error and use an example calculation to show the problem the ANOVA addresses.
فتح الحزمة
افتح القفل للوصول البطاقات البالغ عددها 54 في هذه المجموعة.
فتح الحزمة
k this deck
48
Consider a study involving six populations from which we draw samples of 12 values each in which the group mean square is 426 and the error mean square is 1416.
(a) Complete the ANOVA table.
(b) Does it appear that any of the population the samples are drawn from have means that differ from one another?
(a) Complete the ANOVA table.(b) Does it appear that any of the population the samples are drawn from have means that differ from one another?
فتح الحزمة
افتح القفل للوصول البطاقات البالغ عددها 54 في هذه المجموعة.
فتح الحزمة
k this deck
49
Consider a study involving seven populations from which we draw samples of 13 values each in which the group mean square is 315 and the error mean square is 2020.
(a) Complete the ANOVA table.
(b) Does it appear that any of the population the samples are drawn from have means that differ from one another?
(a) Complete the ANOVA table.(b) Does it appear that any of the population the samples are drawn from have means that differ from one another?
فتح الحزمة
افتح القفل للوصول البطاقات البالغ عددها 54 في هذه المجموعة.
فتح الحزمة
k this deck
50
If the data intended for an ANOVA does not meet the assumptions, there are three options. Describe each of these options and what you would do to pursue each of them.
فتح الحزمة
افتح القفل للوصول البطاقات البالغ عددها 54 في هذه المجموعة.
فتح الحزمة
k this deck
51
Describe the difference between ANOVA analyses using planned and unplanned comparisons. Describe how the analysis is done differently.
فتح الحزمة
افتح القفل للوصول البطاقات البالغ عددها 54 في هذه المجموعة.
فتح الحزمة
k this deck
52
Describe the difference between ANOVA analyses examined fixed and random effects. Describe how the interpretation of the same numerical values is done differently.
فتح الحزمة
افتح القفل للوصول البطاقات البالغ عددها 54 في هذه المجموعة.
فتح الحزمة
k this deck
53
Using the data set shown, calculate all the values you need to complete the ANOVA table.
فتح الحزمة
افتح القفل للوصول البطاقات البالغ عددها 54 في هذه المجموعة.
فتح الحزمة
k this deck
54
Using the data set shown, calculate all the values you need to complete an ANOVA table.
فتح الحزمة
افتح القفل للوصول البطاقات البالغ عددها 54 في هذه المجموعة.
فتح الحزمة
k this deck
فتح الحزمة
افتح القفل للوصول البطاقات البالغ عددها 54 في هذه المجموعة.


