Deck 14: Quantitative Data Analysis
ملء الشاشة (f)
سؤال
سؤال
سؤال
سؤال
سؤال
سؤال
سؤال
سؤال
سؤال
سؤال
سؤال
سؤال
سؤال
سؤال
For questions refer to the following table: Drug use by educational level
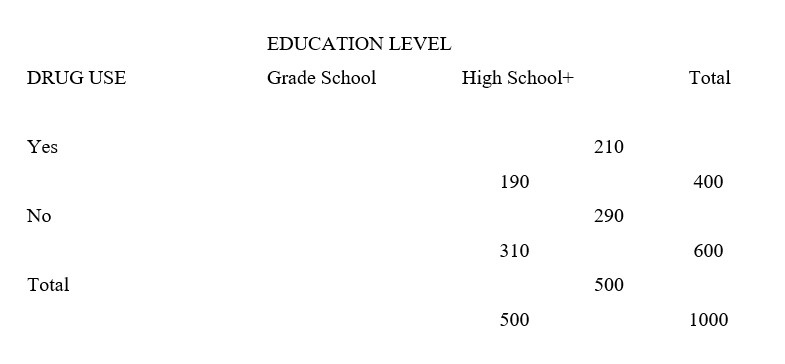
-In this table, how many persons with at least a high school education use drugs?
A) 310
B) 400
C) 190
D) 500
E) 120
-In this table, how many persons with at least a high school education use drugs?
A) 310
B) 400
C) 190
D) 500
E) 120
سؤال
For questions refer to the following table: Drug use by educational level
-In this table, what percentage of persons uses drug users?
A) 40%
B) 42%
C) 50%
D) 60%
E) 38%
-In this table, what percentage of persons uses drug users?
A) 40%
B) 42%
C) 50%
D) 60%
E) 38%
سؤال
سؤال
سؤال
سؤال
سؤال
سؤال
سؤال
سؤال
سؤال
سؤال
سؤال
سؤال
سؤال
سؤال
سؤال
سؤال
سؤال
سؤال
سؤال
سؤال
سؤال
سؤال
سؤال
سؤال
سؤال
سؤال
سؤال
سؤال
سؤال
سؤال
سؤال
سؤال

فتح الحزمة
قم بالتسجيل لفتح البطاقات في هذه المجموعة!
Unlock Deck
Unlock Deck
1/47
العب
ملء الشاشة (f)
Deck 14: Quantitative Data Analysis
1
Statistics used to describe the distribution and relationship among variables are:
A) Descriptive statistics.
B) Variability measures.
C) Measures of central tendency.
D) Inferential statistics.
A) Descriptive statistics.
B) Variability measures.
C) Measures of central tendency.
D) Inferential statistics.
A
2
When using _______ coding, a second person recodes a sample of the forms and then the percentage of agreement on all the items on the forms is computed.
A) Spot
B) Check
C) Procedure
D) Systemic
A) Spot
B) Check
C) Procedure
D) Systemic
B
3
The skewness of a data distribution can be
A) Right or left.
B) Positive or inverse.
C) Nominal or ordinal.
D) Ordinal or interval.
A) Right or left.
B) Positive or inverse.
C) Nominal or ordinal.
D) Ordinal or interval.
A
4
If a single frequency display presents a set of conceptually similar variables having the same response categories, it is called a:
A) Combined frequency display.
B) Frequency polygon.
C) Frequency distribution.
D) Compressed frequency display..
A) Combined frequency display.
B) Frequency polygon.
C) Frequency distribution.
D) Compressed frequency display..
فتح الحزمة
افتح القفل للوصول البطاقات البالغ عددها 47 في هذه المجموعة.
فتح الحزمة
k this deck
5
A unimodal distribution has:
A) No probability average.
B) A normal distribution.
C) A single most frequent value in the distribution.
D) 68 percent of the cases within one standard deviation from the mean.
A) No probability average.
B) A normal distribution.
C) A single most frequent value in the distribution.
D) 68 percent of the cases within one standard deviation from the mean.
فتح الحزمة
افتح القفل للوصول البطاقات البالغ عددها 47 في هذه المجموعة.
فتح الحزمة
k this deck
6
To determine the approiateness of a particular statistic it is imporant to know which one of the following?
A) The frequency of its occurance in the population
B) The level of measurement
C) How the information was collected
D) The sample from whom the data were collected.
A) The frequency of its occurance in the population
B) The level of measurement
C) How the information was collected
D) The sample from whom the data were collected.
فتح الحزمة
افتح القفل للوصول البطاقات البالغ عددها 47 في هذه المجموعة.
فتح الحزمة
k this deck
7
If the order of a variable's categories is arbitracy, which of the following is used to summarize the central tendency of quantitative variables?
A) Mean
B) Mode
C) Median
D) Mean and Mode
A) Mean
B) Mode
C) Median
D) Mean and Mode
فتح الحزمة
افتح القفل للوصول البطاقات البالغ عددها 47 في هذه المجموعة.
فتح الحزمة
k this deck
8
A scatterplot is used to display the relationship between ____ continuous variables.
A) Three
B) Six
C) Five
D) Two
A) Three
B) Six
C) Five
D) Two
فتح الحزمة
افتح القفل للوصول البطاقات البالغ عددها 47 في هذه المجموعة.
فتح الحزمة
k this deck
9
A Type ___ error is influenced by the effect of the intervention or the strength of the relationship between an independent variable and a dependent variable.
A) I
B) II
C) III
D) IV
A) I
B) II
C) III
D) IV
فتح الحزمة
افتح القفل للوصول البطاقات البالغ عددها 47 في هذه المجموعة.
فتح الحزمة
k this deck
10
If r = 0, then:
A) The correlation is perfect.
B) The correlation is negative.
C) The correlation is normal.
D) There is no linear correlation.
A) The correlation is perfect.
B) The correlation is negative.
C) The correlation is normal.
D) There is no linear correlation.
فتح الحزمة
افتح القفل للوصول البطاقات البالغ عددها 47 في هذه المجموعة.
فتح الحزمة
k this deck
11
Which summary statistic should be used to answer the question, "What hobby is most common for college students today"?
A) Range
B) Variance
C) Mean
D) Mode
A) Range
B) Variance
C) Mean
D) Mode
فتح الحزمة
افتح القفل للوصول البطاقات البالغ عددها 47 في هذه المجموعة.
فتح الحزمة
k this deck
12
Scores on seven quizzes: 25, 23, 22, 17, 5, 42, 105. What is the median quiz score?
A) 22
B) 23
C) 5
D) 42
E) 17
A) 22
B) 23
C) 5
D) 42
E) 17
فتح الحزمة
افتح القفل للوصول البطاقات البالغ عددها 47 في هذه المجموعة.
فتح الحزمة
k this deck
13
Quiz scores: 25, 23, 22, 17, 46, 42, 105. What is the mean score?
A) 35.2
B) 40
C) 23
D) 30.5
E) 40.2
A) 35.2
B) 40
C) 23
D) 30.5
E) 40.2
فتح الحزمة
افتح القفل للوصول البطاقات البالغ عددها 47 في هذه المجموعة.
فتح الحزمة
k this deck
14
For questions refer to the following table: Drug use by educational level
-In this table, how many persons with at least a high school education use drugs?
A) 310
B) 400
C) 190
D) 500
E) 120
-In this table, how many persons with at least a high school education use drugs?
A) 310
B) 400
C) 190
D) 500
E) 120
فتح الحزمة
افتح القفل للوصول البطاقات البالغ عددها 47 في هذه المجموعة.
فتح الحزمة
k this deck
15
For questions refer to the following table: Drug use by educational level
-In this table, what percentage of persons uses drug users?
A) 40%
B) 42%
C) 50%
D) 60%
E) 38%
-In this table, what percentage of persons uses drug users?
A) 40%
B) 42%
C) 50%
D) 60%
E) 38%
فتح الحزمة
افتح القفل للوصول البطاقات البالغ عددها 47 في هذه المجموعة.
فتح الحزمة
k this deck
16
The median in a frequency distribution is determined by identifying the value corresponding to a cumulative percentage of 50.
فتح الحزمة
افتح القفل للوصول البطاقات البالغ عددها 47 في هذه المجموعة.
فتح الحزمة
k this deck
17
The mean, median, and mode can all be used to describe any variable.
فتح الحزمة
افتح القفل للوصول البطاقات البالغ عددها 47 في هذه المجموعة.
فتح الحزمة
k this deck
18
The mode is the most frequent value in a distribution.
فتح الحزمة
افتح القفل للوصول البطاقات البالغ عددها 47 في هذه المجموعة.
فتح الحزمة
k this deck
19
The mode is the only appropriate measure of central tendency for nominal variables.
فتح الحزمة
افتح القفل للوصول البطاقات البالغ عددها 47 في هذه المجموعة.
فتح الحزمة
k this deck
20
The interquartile range measures variability while avoiding problems created by outliers.
فتح الحزمة
افتح القفل للوصول البطاقات البالغ عددها 47 في هذه المجموعة.
فتح الحزمة
k this deck
21
Level of measurement is essential to determine the appropriate statistical test.
فتح الحزمة
افتح القفل للوصول البطاقات البالغ عددها 47 في هذه المجموعة.
فتح الحزمة
k this deck
22
In a normal distribution, about 68 percent of all cases will fall between plus or minus one standard deviations from the mean.
فتح الحزمة
افتح القفل للوصول البطاقات البالغ عددها 47 في هذه المجموعة.
فتح الحزمة
k this deck
23
Type I error occurs when there is no evidence of a statistical relationship between two variables based on the sample, but in fact, the two variables are related.
فتح الحزمة
افتح القفل للوصول البطاقات البالغ عددها 47 في هذه المجموعة.
فتح الحزمة
k this deck
24
An alpha level of .10 means that the researcher is willing to accept a 10% chance of concluding that there is a relationship between the variables in the sample when there is no relationship in the population.
فتح الحزمة
افتح القفل للوصول البطاقات البالغ عددها 47 في هذه المجموعة.
فتح الحزمة
k this deck
25
Match the concept with the definition.
-Mean
A) The highest value in a distribution minus the lowest value plus one
B) The most frequent value in a distribution
C) The point that divides the distribution in half
D) The average squared deviation of each case from the mean
E) The arithmetic average of the distribution
-Mean
A) The highest value in a distribution minus the lowest value plus one
B) The most frequent value in a distribution
C) The point that divides the distribution in half
D) The average squared deviation of each case from the mean
E) The arithmetic average of the distribution
فتح الحزمة
افتح القفل للوصول البطاقات البالغ عددها 47 في هذه المجموعة.
فتح الحزمة
k this deck
26
Match the concept with the definition.
-Median
A) The highest value in a distribution minus the lowest value plus one
B) The most frequent value in a distribution
C) The point that divides the distribution in half
D) The average squared deviation of each case from the mean
E) The arithmetic average of the distribution
-Median
A) The highest value in a distribution minus the lowest value plus one
B) The most frequent value in a distribution
C) The point that divides the distribution in half
D) The average squared deviation of each case from the mean
E) The arithmetic average of the distribution
فتح الحزمة
افتح القفل للوصول البطاقات البالغ عددها 47 في هذه المجموعة.
فتح الحزمة
k this deck
27
Match the concept with the definition.
-Mode
A) The highest value in a distribution minus the lowest value plus one
B) The most frequent value in a distribution
C) The point that divides the distribution in half
D) The average squared deviation of each case from the mean
E) The arithmetic average of the distribution
-Mode
A) The highest value in a distribution minus the lowest value plus one
B) The most frequent value in a distribution
C) The point that divides the distribution in half
D) The average squared deviation of each case from the mean
E) The arithmetic average of the distribution
فتح الحزمة
افتح القفل للوصول البطاقات البالغ عددها 47 في هذه المجموعة.
فتح الحزمة
k this deck
28
Match the concept with the definition.
-Range
A) The highest value in a distribution minus the lowest value plus one
B) The most frequent value in a distribution
C) The point that divides the distribution in half
D) The average squared deviation of each case from the mean
E) The arithmetic average of the distribution
-Range
A) The highest value in a distribution minus the lowest value plus one
B) The most frequent value in a distribution
C) The point that divides the distribution in half
D) The average squared deviation of each case from the mean
E) The arithmetic average of the distribution
فتح الحزمة
افتح القفل للوصول البطاقات البالغ عددها 47 في هذه المجموعة.
فتح الحزمة
k this deck
29
Match the concept with the definition.
-Standard deviation
A) The highest value in a distribution minus the lowest value plus one
B) The most frequent value in a distribution
C) The point that divides the distribution in half
D) The average squared deviation of each case from the mean
E) The arithmetic average of the distribution
-Standard deviation
A) The highest value in a distribution minus the lowest value plus one
B) The most frequent value in a distribution
C) The point that divides the distribution in half
D) The average squared deviation of each case from the mean
E) The arithmetic average of the distribution
فتح الحزمة
افتح القفل للوصول البطاقات البالغ عددها 47 في هذه المجموعة.
فتح الحزمة
k this deck
30
Match the concept with the definition.
-Bar chart
A) A distribution of adjacent bars
B) A bell-shaped distribution centered on the mean
C) A continuous line connecting points that represent the number or percentage of cases at each value
D) A distribution containing solid bars separated by spaces
-Bar chart
A) A distribution of adjacent bars
B) A bell-shaped distribution centered on the mean
C) A continuous line connecting points that represent the number or percentage of cases at each value
D) A distribution containing solid bars separated by spaces
فتح الحزمة
افتح القفل للوصول البطاقات البالغ عددها 47 في هذه المجموعة.
فتح الحزمة
k this deck
31
Match the concept with the definition.
-Histogram
A) A distribution of adjacent bars
B) A bell-shaped distribution centered on the mean
C) A continuous line connecting points that represent the number or percentage of cases at each value
D) A distribution containing solid bars separated by spaces
-Histogram
A) A distribution of adjacent bars
B) A bell-shaped distribution centered on the mean
C) A continuous line connecting points that represent the number or percentage of cases at each value
D) A distribution containing solid bars separated by spaces
فتح الحزمة
افتح القفل للوصول البطاقات البالغ عددها 47 في هذه المجموعة.
فتح الحزمة
k this deck
32
Match the concept with the definition.
-Frequency polygon
A) A distribution of adjacent bars
B) A bell-shaped distribution centered on the mean
C) A continuous line connecting points that represent the number or percentage of cases at each value
D) A distribution containing solid bars separated by spaces
-Frequency polygon
A) A distribution of adjacent bars
B) A bell-shaped distribution centered on the mean
C) A continuous line connecting points that represent the number or percentage of cases at each value
D) A distribution containing solid bars separated by spaces
فتح الحزمة
افتح القفل للوصول البطاقات البالغ عددها 47 في هذه المجموعة.
فتح الحزمة
k this deck
33
Match the concept with the definition.
-Normal distribution
A) A distribution of adjacent bars
B) A bell-shaped distribution centered on the mean
C) A continuous line connecting points that represent the number or percentage of cases at each value
D) A distribution containing solid bars separated by spaces
-Normal distribution
A) A distribution of adjacent bars
B) A bell-shaped distribution centered on the mean
C) A continuous line connecting points that represent the number or percentage of cases at each value
D) A distribution containing solid bars separated by spaces
فتح الحزمة
افتح القفل للوصول البطاقات البالغ عددها 47 في هذه المجموعة.
فتح الحزمة
k this deck
34
Match the concept with the definition.
-Body of the table
A) The total number cases in the distribution
B) Part of table between row and column labels and row and column totals
C) Frequency distributions for independent and dependent variables
D) Typically divided into categories of the independent variable
E) Combinations of row and column values that represent unique combinations of values.
فتح الحزمة
افتح القفل للوصول البطاقات البالغ عددها 47 في هذه المجموعة.
فتح الحزمة
k this deck
35
Match the concept with the definition.
-Cell
A) The total number cases in the distribution
B) Part of table between row and column labels and row and column totals
C) Frequency distributions for independent and dependent variables
D) Typically divided into categories of the independent variable
E) Combinations of row and column values that represent unique combinations of values.
فتح الحزمة
افتح القفل للوصول البطاقات البالغ عددها 47 في هذه المجموعة.
فتح الحزمة
k this deck
36
Match the concept with the definition.
-Marginals
A) The total number cases in the distribution
B) Part of table between row and column labels and row and column totals
C) Frequency distributions for independent and dependent variables
D) Typically divided into categories of the independent variable
E) Combinations of row and column values that represent unique combinations of values.
فتح الحزمة
افتح القفل للوصول البطاقات البالغ عددها 47 في هذه المجموعة.
فتح الحزمة
k this deck
37
Match the concept with the definition.
-Column
A) The total number cases in the distribution
B) Part of table between row and column labels and row and column totals
C) Frequency distributions for independent and dependent variables
D) Typically divided into categories of the independent variable
E) Combinations of row and column values that represent unique combinations of values.
فتح الحزمة
افتح القفل للوصول البطاقات البالغ عددها 47 في هذه المجموعة.
فتح الحزمة
k this deck
38
Match the concept with the definition.
-Base number (N)
A) The total number cases in the distribution
B) Part of table between row and column labels and row and column totals
C) Frequency distributions for independent and dependent variables
D) Typically divided into categories of the independent variable
E) Combinations of row and column values that represent unique combinations of values.
فتح الحزمة
افتح القفل للوصول البطاقات البالغ عددها 47 في هذه المجموعة.
فتح الحزمة
k this deck
39
Match the cross-tabulation concept with the definition.
-Existence
A) The amount by which the percentage distributions vary between categories of the independent variable
B) A bell-shaped distribution centered on the mean
C) When values on the dependent variable tend to increase or decrease with an increase in value on the independent variable
D) There is a pattern of percentage distributions that vary between categories of the dependent variable
فتح الحزمة
افتح القفل للوصول البطاقات البالغ عددها 47 في هذه المجموعة.
فتح الحزمة
k this deck
40
Match the cross-tabulation concept with the definition.
-Strength
A) The amount by which the percentage distributions vary between categories of the independent variable
B) A bell-shaped distribution centered on the mean
C) When values on the dependent variable tend to increase or decrease with an increase in value on the independent variable
D) There is a pattern of percentage distributions that vary between categories of the dependent variable
فتح الحزمة
افتح القفل للوصول البطاقات البالغ عددها 47 في هذه المجموعة.
فتح الحزمة
k this deck
41
Match the cross-tabulation concept with the definition.
-Direction
A) The amount by which the percentage distributions vary between categories of the independent variable
B) A bell-shaped distribution centered on the mean
C) When values on the dependent variable tend to increase or decrease with an increase in value on the independent variable
D) There is a pattern of percentage distributions that vary between categories of the dependent variable
فتح الحزمة
افتح القفل للوصول البطاقات البالغ عددها 47 في هذه المجموعة.
فتح الحزمة
k this deck
42
Match the cross-tabulation concept with the definition.
-Patterm
A) The amount by which the percentage distributions vary between categories of the independent variable
B) A bell-shaped distribution centered on the mean
C) When values on the dependent variable tend to increase or decrease with an increase in value on the independent variable
D) There is a pattern of percentage distributions that vary between categories of the dependent variable
فتح الحزمة
افتح القفل للوصول البطاقات البالغ عددها 47 في هذه المجموعة.
فتح الحزمة
k this deck
43
Why is it important to assign a unique identifying number to each respondent?
فتح الحزمة
افتح القفل للوصول البطاقات البالغ عددها 47 في هذه المجموعة.
فتح الحزمة
k this deck
44
Discuss the problems you may encounter as you review instruments/questionnaires from a survey you administered.
فتح الحزمة
افتح القفل للوصول البطاقات البالغ عددها 47 في هذه المجموعة.
فتح الحزمة
k this deck
45
What are the problems that occur when comparisons are made across ethnic groups?
فتح الحزمة
افتح القفل للوصول البطاقات البالغ عددها 47 في هذه المجموعة.
فتح الحزمة
k this deck
46
Compare and contrast a bar chart, histogram, and frequency polygon.
فتح الحزمة
افتح القفل للوصول البطاقات البالغ عددها 47 في هذه المجموعة.
فتح الحزمة
k this deck
47
Why is a variable's level of measurement important in determining the appropriate descriptive statistics, graphs, and bivariate statistics?
Provide examples to describe the nature of the problem.
Provide examples to describe the nature of the problem.
فتح الحزمة
افتح القفل للوصول البطاقات البالغ عددها 47 في هذه المجموعة.
فتح الحزمة
k this deck
فتح الحزمة
افتح القفل للوصول البطاقات البالغ عددها 47 في هذه المجموعة.


