Deck 16: Person-Centered Analysis
ملء الشاشة (f)
سؤال
سؤال
سؤال
سؤال
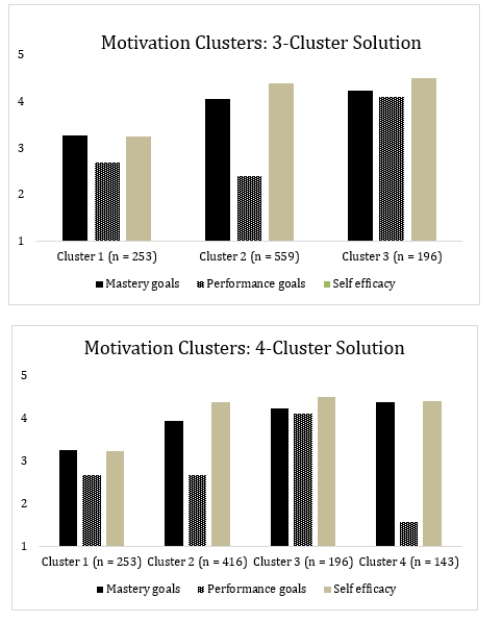
Suppose I performed a cluster analysis and I got a 3-cluster solution and a 4-cluster solution. Each solution is presented in the graphs below:
 a. What is the main difference between these solutions?
b. Which solution do you think is best? Why?
a. What is the main difference between these solutions?b. Which solution do you think is best? Why?
سؤال
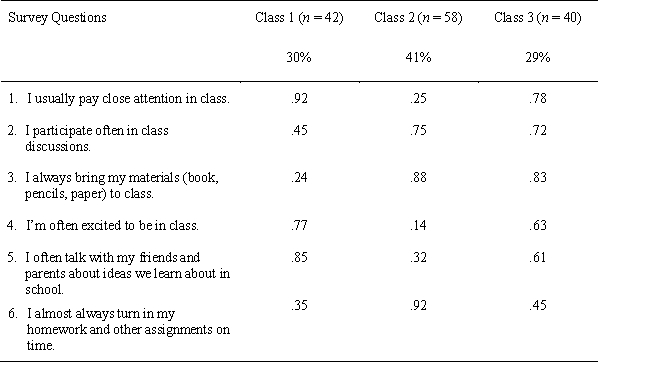
Suppose that I performed a latent-class analysis on several true-false questions designed to measure students' engagement with school. I got the results presented in the table below:
 a. How would you describe these three latent classes?
a. How would you describe these three latent classes? سؤال
سؤال

فتح الحزمة
قم بالتسجيل لفتح البطاقات في هذه المجموعة!
Unlock Deck
Unlock Deck
1/7
العب
ملء الشاشة (f)
Deck 16: Person-Centered Analysis
1
What does "person-centered analysis" mean and how does it differ from "variable-centered analysis?"
Person-centered analysis refers to statistical approaches that group cases according to their similar scores on multiple variables. This is in contrast to variable-centered analyses that look for whole-sample characteristics on one or more variables.
2
What is the purpose of a cluster analysis?
The purpose of a cluster analysis is to create groups, or clusters, of cases that score similarly on a set of clustering variables. These clusters can than be treated as groups and compared on other variables of interest using techniques like ANOVA.
3
What kind of variables are appropriate for use in a latent-class analysis?
Latent-class analysis uses responses on dichotomous variables to group cases based on their responses to these questions. These responses create "conditional probabilities" that are the basis for the latent classes.
4
Suppose I performed a cluster analysis and I got a 3-cluster solution and a 4-cluster solution. Each solution is presented in the graphs below:
a. What is the main difference between these solutions?
b. Which solution do you think is best? Why?
a. What is the main difference between these solutions?b. Which solution do you think is best? Why?
فتح الحزمة
افتح القفل للوصول البطاقات البالغ عددها 7 في هذه المجموعة.
فتح الحزمة
k this deck
5
Suppose that I performed a latent-class analysis on several true-false questions designed to measure students' engagement with school. I got the results presented in the table below:
a. How would you describe these three latent classes?
a. How would you describe these three latent classes? فتح الحزمة
افتح القفل للوصول البطاقات البالغ عددها 7 في هذه المجموعة.
فتح الحزمة
k this deck
6
What is a "conditional probability" in a latent-class analysis?
فتح الحزمة
افتح القفل للوصول البطاقات البالغ عددها 7 في هذه المجموعة.
فتح الحزمة
k this deck
7
Suppose that I happen to know that in the population of current college students in the U.S., the average level of satisfaction with life is 8.00, with a standard deviation of 3.00. (Satisfaction with life is measured on a scale from 1 to 15 with 1 = "totally unsatisfied" and 15 = "totally satisfied".) I suspect that college students in California have higher satisfaction with life. We have the sun, we have the mountains, we have the great stats professors. What's not to like? So I select a random sample of 36 college students from California and measure their satisfaction with life. This sample has a mean of 9.00 and a standard deviation of 2.5. Please answer the following questions based on this research question and data.
a. Suppose that one of the students in the California sample scored a 5.00 on his life satisfaction. Calculate two z scores for him, one for his score in the sample and one for his score in the population. Wrap words around each of these z scores. What do they tell you?
b. What is the probability of me reaching into the population and randomly selecting a student with a life-satisfaction score of 10 or higher?
c. What is/are the score(s) that mark the extreme 10% of the distribution for the population on the life-satisfaction measure?
d. Please write the null and alternative hypotheses for my research question and tell me why you wrote them as you did.
e. Calculate the standard error of the mean for the sample and wrap words around it.
f. Wrap words around the standard deviation for the sample. What does it tell us?
g. What is the probability of getting this sample mean by chance
h. When I say that I have an alpha level of .05 (i.e., = .05), what exactly do I mean?
i. What proportion of randomly selected samples of n = 36 from this population would be expected to have a mean between 6.5 and 9.0?
j. In the term standard error, what exactly does error mean? Error in what?
فتح الحزمة
افتح القفل للوصول البطاقات البالغ عددها 7 في هذه المجموعة.
فتح الحزمة
k this deck
فتح الحزمة
افتح القفل للوصول البطاقات البالغ عددها 7 في هذه المجموعة.


