Deck 2: Types of Data
ملء الشاشة (f)
سؤال
سؤال
سؤال
سؤال
سؤال
سؤال
سؤال
سؤال
سؤال
سؤال
سؤال
سؤال
سؤال
سؤال
سؤال
سؤال
سؤال
سؤال
سؤال
سؤال
سؤال
سؤال
سؤال
سؤال
سؤال
سؤال
سؤال
سؤال
سؤال
سؤال
سؤال
سؤال
سؤال
سؤال
سؤال
سؤال
سؤال
سؤال
سؤال
سؤال
سؤال
سؤال
سؤال
سؤال
سؤال
سؤال
سؤال
سؤال
سؤال
Below are data from an eating contest. Contestants tried to eat as many hot dogs as they can. Use the data to answer the following questions.
 The winner of the contest ate how many hot dogs?
The winner of the contest ate how many hot dogs? سؤال
Below are data from an eating contest. Contestants tried to eat as many hot dogs as they can. Use the data to answer the following questions.
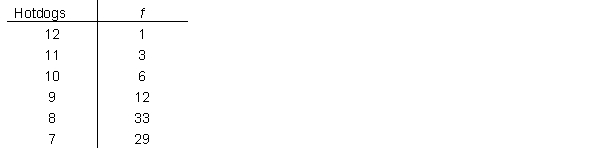 Create a new column of the table and calculate the cumulative frequencies
Create a new column of the table and calculate the cumulative frequencies سؤال
Below are data from an eating contest. Contestants tried to eat as many hot dogs as they can. Use the data to answer the following questions.
 What kind of measurement scale is this data on?
What kind of measurement scale is this data on? سؤال
Weddings are becoming increasingly expensive for couples. Below are data showing how much newly weds spent on their weddings. Use it to answer the following questions.
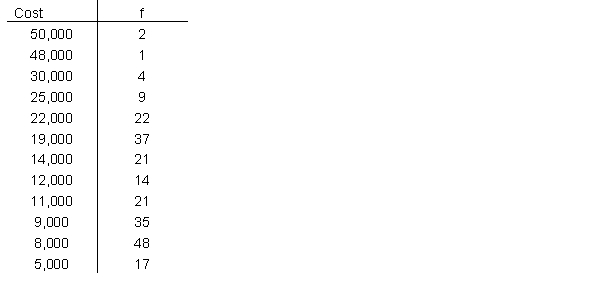 The most frequently observed cost in this dataset is how much for a wedding?
The most frequently observed cost in this dataset is how much for a wedding? سؤال
Weddings are becoming increasingly expensive for couples. Below are data showing how much newly weds spent on their weddings. Use it to answer the following questions.
 Create a new column of data and calculate the relative frequency
Create a new column of data and calculate the relative frequency
فتح الحزمة
قم بالتسجيل لفتح البطاقات في هذه المجموعة!
Unlock Deck
Unlock Deck
1/53
العب
ملء الشاشة (f)
Deck 2: Types of Data
1
Qualitative data can be in the form of numbers
True
2
Data based on rankings are qualitative
True
3
Nominal scales are qualitative measurements that use ranks to represent categories.
False
4
Nominal scales are inherently quantitative
فتح الحزمة
افتح القفل للوصول البطاقات البالغ عددها 53 في هذه المجموعة.
فتح الحزمة
k this deck
5
Ordinal scales are not a type of qualitative data. Rather, they are quantitative data.
فتح الحزمة
افتح القفل للوصول البطاقات البالغ عددها 53 في هذه المجموعة.
فتح الحزمة
k this deck
6
Placement in a race is on an ordinal scale
فتح الحزمة
افتح القفل للوصول البطاقات البالغ عددها 53 في هذه المجموعة.
فتح الحزمة
k this deck
7
Unlike interval scales, ratio scales have a true and meaningful zero point
فتح الحزمة
افتح القفل للوصول البطاقات البالغ عددها 53 في هذه المجموعة.
فتح الحزمة
k this deck
8
Just because you have numbers in a dataset to calculate a mean or median, it doesn't mean that the result is meaningful.
فتح الحزمة
افتح القفل للوصول البطاقات البالغ عددها 53 في هذه المجموعة.
فتح الحزمة
k this deck
9
A frequency distribution is a table that shows the frequency of possible measurements that could have been observed
فتح الحزمة
افتح القفل للوصول البطاقات البالغ عددها 53 في هذه المجموعة.
فتح الحزمة
k this deck
10
When counting cumulative frequency, the total frequency will only increase as you move up in an ordered dataset.
فتح الحزمة
افتح القفل للوصول البطاقات البالغ عددها 53 في هذه المجموعة.
فتح الحزمة
k this deck
11
In a grouped frequency distribution, the groups are formed based on the total number of observations.
فتح الحزمة
افتح القفل للوصول البطاقات البالغ عددها 53 في هذه المجموعة.
فتح الحزمة
k this deck
12
Grouped frequency distributions can be presented in different ways, such as to show relative frequencies and cumulative relative frequencies.
فتح الحزمة
افتح القفل للوصول البطاقات البالغ عددها 53 في هذه المجموعة.
فتح الحزمة
k this deck
13
When creating a grouped frequency distribution, it is best to start with 2 groups and then work your way up until a desired amount is reached.
فتح الحزمة
افتح القفل للوصول البطاقات البالغ عددها 53 في هذه المجموعة.
فتح الحزمة
k this deck
14
Relative frequencies are generally displayed as percentages or proportions, instead of actual counts.
فتح الحزمة
افتح القفل للوصول البطاقات البالغ عددها 53 في هذه المجموعة.
فتح الحزمة
k this deck
15
Cumulative relative frequencies are also known as percentile rank
فتح الحزمة
افتح القفل للوصول البطاقات البالغ عددها 53 في هذه المجموعة.
فتح الحزمة
k this deck
16
If a certain datum or observation is associated with a cumulative relative frequency of 59%, that means that 59% of the observations were ranked below that datum or observation.
فتح الحزمة
افتح القفل للوصول البطاقات البالغ عددها 53 في هذه المجموعة.
فتح الحزمة
k this deck
17
Asking participants of a survey to pick their favorite color would be on an ordinal scale
فتح الحزمة
افتح القفل للوصول البطاقات البالغ عددها 53 في هذه المجموعة.
فتح الحزمة
k this deck
18
Interval scales and ratio scales are not that different. Interval scales contain a true 0 point but ratio scales don't.
فتح الحزمة
افتح القفل للوصول البطاقات البالغ عددها 53 في هذه المجموعة.
فتح الحزمة
k this deck
19
In an ungrouped frequency distribution, you are able to extract the entire dataset precisely to have each observation available.
فتح الحزمة
افتح القفل للوصول البطاقات البالغ عددها 53 في هذه المجموعة.
فتح الحزمة
k this deck
20
Reaction time measured in milliseconds is on an interval scale because there are equal intervals between each millisecond
فتح الحزمة
افتح القفل للوصول البطاقات البالغ عددها 53 في هذه المجموعة.
فتح الحزمة
k this deck
21
Which of the following scenarios is a reason to use grouped frequency distributions over ungrouped frequency distributions?
A) small datasets with low variability
B) datasets on a nominal scale
C) datasets that contain categorical variables such as gender or color
D) large datasets with high variability
A) small datasets with low variability
B) datasets on a nominal scale
C) datasets that contain categorical variables such as gender or color
D) large datasets with high variability
فتح الحزمة
افتح القفل للوصول البطاقات البالغ عددها 53 في هذه المجموعة.
فتح الحزمة
k this deck
22
Which of the following accurately describes how 0's are represented in different scales?
A) They can be arbitrary for nominal scales, and do not reflect an absence of what is being measured on a ratio scale.
B) The represent an absence of what is being measured on all measurement scales regardless of what kind of scale the data are on.
C) The represent the absence of that which is being measured for interval scales only
D) They represent the absence of that which is being measured for ratio scales only.
فتح الحزمة
افتح القفل للوصول البطاقات البالغ عددها 53 في هذه المجموعة.
فتح الحزمة
k this deck
23
Which of the following does not describe ordinal scale?
A) Class rank in school
B) Letter grades on a test
C) Percentage of points earned on a test
D) All of the above are ordinal scales.
A) Class rank in school
B) Letter grades on a test
C) Percentage of points earned on a test
D) All of the above are ordinal scales.
فتح الحزمة
افتح القفل للوصول البطاقات البالغ عددها 53 في هذه المجموعة.
فتح الحزمة
k this deck
24
According to S.S. Stevens, what are the two basic characteristics of an object or event that is measurable?
A) Quality and interest
B) Quality and quantity
C) Who and how many
D) When and where
A) Quality and interest
B) Quality and quantity
C) Who and how many
D) When and where
فتح الحزمة
افتح القفل للوصول البطاقات البالغ عددها 53 في هذه المجموعة.
فتح الحزمة
k this deck
25
What percentage of days were hotter than 79 degrees Fahrenheit?
A) 81%
B) 89%
C) 19%
D) 100%
A) 81%
B) 89%
C) 19%
D) 100%
فتح الحزمة
افتح القفل للوصول البطاقات البالغ عددها 53 في هذه المجموعة.
فتح الحزمة
k this deck
26
How many days were 59 degrees or less?
A) 21
B) 7
C) 3
D) Insufficient information from the data
A) 21
B) 7
C) 3
D) Insufficient information from the data
فتح الحزمة
افتح القفل للوصول البطاقات البالغ عددها 53 في هذه المجموعة.
فتح الحزمة
k this deck
27
The most common range of temperature for the recorded days in this dataset was which range?
A) 70 - 79
B) 60 - 69
C) 90 - 99
D) 80 - 89
A) 70 - 79
B) 60 - 69
C) 90 - 99
D) 80 - 89
فتح الحزمة
افتح القفل للوصول البطاقات البالغ عددها 53 في هذه المجموعة.
فتح الحزمة
k this deck
28
What percentage of days had temperatures between 40 and 69 degrees Fahrenheit?
A) 61%
B) 28%
C) 37%
D) Insufficient information from the data
A) 61%
B) 28%
C) 37%
D) Insufficient information from the data
فتح الحزمة
افتح القفل للوصول البطاقات البالغ عددها 53 في هذه المجموعة.
فتح الحزمة
k this deck
29
What unique feature about interval scales separates it from ordinal scales?
A) equal distance between any two adjacent points on the scale
B) a true 0 that represents absence
C) rank ordered data
D) All of the above.
A) equal distance between any two adjacent points on the scale
B) a true 0 that represents absence
C) rank ordered data
D) All of the above.
فتح الحزمة
افتح القفل للوصول البطاقات البالغ عددها 53 في هذه المجموعة.
فتح الحزمة
k this deck
30
The following data set presents the number of laptops individuals own. Questions 10 through 13 will use the data below:
-How many individuals had either 1 or 3 laptops?
A) 146
B) 141
C) 227
D) 86
-How many individuals had either 1 or 3 laptops?
A) 146
B) 141
C) 227
D) 86
فتح الحزمة
افتح القفل للوصول البطاقات البالغ عددها 53 في هذه المجموعة.
فتح الحزمة
k this deck
31
The following data set presents the number of laptops individuals own. Questions 10 through 13 will use the data below:
-In this sample, the fewest people had how many laptops?
A) 1
B) 2
C) 3
D) 4
-In this sample, the fewest people had how many laptops?
A) 1
B) 2
C) 3
D) 4
فتح الحزمة
افتح القفل للوصول البطاقات البالغ عددها 53 في هذه المجموعة.
فتح الحزمة
k this deck
32
The following data set presents the number of laptops individuals own. Questions 10 through 13 will use the data below:
-This distribution is ___________, and is showing the ___________.
A) grouped; relative frequency
B) ungrouped; frequency
C) ungrouped; relatively frequency;
D) ungrouped; percentile rank.
-This distribution is ___________, and is showing the ___________.
A) grouped; relative frequency
B) ungrouped; frequency
C) ungrouped; relatively frequency;
D) ungrouped; percentile rank.
فتح الحزمة
افتح القفل للوصول البطاقات البالغ عددها 53 في هذه المجموعة.
فتح الحزمة
k this deck
33
The following data set presents the number of laptops individuals own. Questions 10 through 13 will use the data below:
-What is the cumulative relative frequency for owning 3 laptops?
A) 95.9%
B) 2%
C) 93.9%
D) insufficient information.
-What is the cumulative relative frequency for owning 3 laptops?
A) 95.9%
B) 2%
C) 93.9%
D) insufficient information.
فتح الحزمة
افتح القفل للوصول البطاقات البالغ عددها 53 في هذه المجموعة.
فتح الحزمة
k this deck
34
Interval and ratio scales are best described as which of the following?
A) descriptive
B) quantitative
C) qualitative
D) categorical
A) descriptive
B) quantitative
C) qualitative
D) categorical
فتح الحزمة
افتح القفل للوصول البطاقات البالغ عددها 53 في هذه المجموعة.
فتح الحزمة
k this deck
35
If your score on a test had a cumulative relative frequency of 55%, what does that mean?
A) you are in the 45th percentile
B) 55% of individuals in the sample scored higher than you
C) 55% of individuals in the sample scored lower than you
D) You scored 55% of the total points correct.
A) you are in the 45th percentile
B) 55% of individuals in the sample scored higher than you
C) 55% of individuals in the sample scored lower than you
D) You scored 55% of the total points correct.
فتح الحزمة
افتح القفل للوصول البطاقات البالغ عددها 53 في هذه المجموعة.
فتح الحزمة
k this deck
36
Qualitative data is generally concerned with _____________________ whereas quantitative data is concerned with _____________________.
A) frequency; categorization.
B) categorizing; counting
C) How and when; who and where
D) observing; counting
A) frequency; categorization.
B) categorizing; counting
C) How and when; who and where
D) observing; counting
فتح الحزمة
افتح القفل للوصول البطاقات البالغ عددها 53 في هذه المجموعة.
فتح الحزمة
k this deck
37
Interval scales are inherently...
A) qualitative.
B) quantitative.
C) categories.
D) None of the above.
A) qualitative.
B) quantitative.
C) categories.
D) None of the above.
فتح الحزمة
افتح القفل للوصول البطاقات البالغ عددها 53 في هذه المجموعة.
فتح الحزمة
k this deck
38
In a grouped frequency distribution, which one of the following is true?
A) you no longer know what the exact data points in the dataset were
B) you are only interested in percentile rank and not frequency, because the individual data points are not used
C) it makes small datasets more easily read
D) It is only a good idea when the difference between the largest and smallest observation is greater than 100.
فتح الحزمة
افتح القفل للوصول البطاقات البالغ عددها 53 في هذه المجموعة.
فتح الحزمة
k this deck
39
As a general rule of thumb, how many groups should you start with when creating a grouped frequency distribution?
A) 2
B) 5
C) 10
D) The range divided by 5
A) 2
B) 5
C) 10
D) The range divided by 5
فتح الحزمة
افتح القفل للوصول البطاقات البالغ عددها 53 في هذه المجموعة.
فتح الحزمة
k this deck
40
What is the midpoint for each group in a grouped frequency distribution?
A) |UL - LL|/2 + LL
B) UL - LL/2 + LL
C) |UL - LL|/2 + UL
D) UL - LL/2
A) |UL - LL|/2 + LL
B) UL - LL/2 + LL
C) |UL - LL|/2 + UL
D) UL - LL/2
فتح الحزمة
افتح القفل للوصول البطاقات البالغ عددها 53 في هذه المجموعة.
فتح الحزمة
k this deck
41
Which of the following accurately describes interval and ratio scales?
A) They have all the qualities that ordinal scales have
B) They do not have qualities that ordinal scales have
C) They are the same, except that interval scales have a true 0 point
D) a and c only
A) They have all the qualities that ordinal scales have
B) They do not have qualities that ordinal scales have
C) They are the same, except that interval scales have a true 0 point
D) a and c only
فتح الحزمة
افتح القفل للوصول البطاقات البالغ عددها 53 في هذه المجموعة.
فتح الحزمة
k this deck
42
A researcher is studying the life expectancy of grizzly bears. During her research, she finds that the grizzly bears that inhabit the area primarily find their food from four locations. She reorients her research and begins to examine what types of food is available is at each location and how common each food type is. The data is on what kind of scale?
A) Nominal
B) Ordinal
C) Ratio
D) Interval
A) Nominal
B) Ordinal
C) Ratio
D) Interval
فتح الحزمة
افتح القفل للوصول البطاقات البالغ عددها 53 في هذه المجموعة.
فتح الحزمة
k this deck
43
A student researcher is asking participants to report the number of hours they studied for a recent exam and the letter grade they received. These are variables on a ___________ and ___________ respectively.
A) ratio; ordinal
B) ratio; interval
C) interval; nominal
D) interval; ordinal
A) ratio; ordinal
B) ratio; interval
C) interval; nominal
D) interval; ordinal
فتح الحزمة
افتح القفل للوصول البطاقات البالغ عددها 53 في هذه المجموعة.
فتح الحزمة
k this deck
44
A dataset that is comprised of the value of homes in a neighborhood is on a ________ scale
A) interval
B) ratio
C) nominal
D) ordinal
A) interval
B) ratio
C) nominal
D) ordinal
فتح الحزمة
افتح القفل للوصول البطاقات البالغ عددها 53 في هذه المجموعة.
فتح الحزمة
k this deck
45
Grouped tables for datasets offer which advantage over an ungrouped frequency table?
A) it can be better organize large datasets with lots of variability
B) It can be used for all measurement scales whereas ungrouped frequency tables cannot
C) It shows all values of the dataset whereas ungrouped frequency tables do not.
D) All of the above
A) it can be better organize large datasets with lots of variability
B) It can be used for all measurement scales whereas ungrouped frequency tables cannot
C) It shows all values of the dataset whereas ungrouped frequency tables do not.
D) All of the above
فتح الحزمة
افتح القفل للوصول البطاقات البالغ عددها 53 في هذه المجموعة.
فتح الحزمة
k this deck
46
There are two types of data: qualitative and quantitative. Explain what they are and give an example of each
فتح الحزمة
افتح القفل للوصول البطاقات البالغ عددها 53 في هذه المجموعة.
فتح الحزمة
k this deck
47
identify the 4 types of measurement scales, and provide an example of each
فتح الحزمة
افتح القفل للوصول البطاقات البالغ عددها 53 في هذه المجموعة.
فتح الحزمة
k this deck
48
Identify and briefly describe the four ways that data can be organized in frequency tables
فتح الحزمة
افتح القفل للوصول البطاقات البالغ عددها 53 في هذه المجموعة.
فتح الحزمة
k this deck
49
Below are data from an eating contest. Contestants tried to eat as many hot dogs as they can. Use the data to answer the following questions.
The winner of the contest ate how many hot dogs?
The winner of the contest ate how many hot dogs? فتح الحزمة
افتح القفل للوصول البطاقات البالغ عددها 53 في هذه المجموعة.
فتح الحزمة
k this deck
50
Below are data from an eating contest. Contestants tried to eat as many hot dogs as they can. Use the data to answer the following questions.
Create a new column of the table and calculate the cumulative frequencies
Create a new column of the table and calculate the cumulative frequencies فتح الحزمة
افتح القفل للوصول البطاقات البالغ عددها 53 في هذه المجموعة.
فتح الحزمة
k this deck
51
Below are data from an eating contest. Contestants tried to eat as many hot dogs as they can. Use the data to answer the following questions.
What kind of measurement scale is this data on?
What kind of measurement scale is this data on? فتح الحزمة
افتح القفل للوصول البطاقات البالغ عددها 53 في هذه المجموعة.
فتح الحزمة
k this deck
52
Weddings are becoming increasingly expensive for couples. Below are data showing how much newly weds spent on their weddings. Use it to answer the following questions.
The most frequently observed cost in this dataset is how much for a wedding?
The most frequently observed cost in this dataset is how much for a wedding? فتح الحزمة
افتح القفل للوصول البطاقات البالغ عددها 53 في هذه المجموعة.
فتح الحزمة
k this deck
53
Weddings are becoming increasingly expensive for couples. Below are data showing how much newly weds spent on their weddings. Use it to answer the following questions.
Create a new column of data and calculate the relative frequency
Create a new column of data and calculate the relative frequency فتح الحزمة
افتح القفل للوصول البطاقات البالغ عددها 53 في هذه المجموعة.
فتح الحزمة
k this deck
فتح الحزمة
افتح القفل للوصول البطاقات البالغ عددها 53 في هذه المجموعة.


