Deck 27: Simple Analytics of Supply and Demand
ملء الشاشة (f)
سؤال
سؤال
سؤال
سؤال
سؤال
سؤال
سؤال
سؤال
سؤال
سؤال
سؤال
سؤال
سؤال
سؤال
سؤال
سؤال
سؤال
سؤال
سؤال
سؤال
سؤال
سؤال
سؤال
سؤال
سؤال
سؤال
سؤال
سؤال
سؤال
سؤال
سؤال
سؤال
سؤال
سؤال
سؤال
سؤال
سؤال
سؤال
سؤال
سؤال
سؤال
سؤال
سؤال
سؤال
سؤال
سؤال
سؤال
سؤال
سؤال
سؤال
سؤال
سؤال
سؤال
سؤال
سؤال
سؤال
Understand and describe what happens when a market is not in equilibrium.
-Suppose that the demand schedule is given as

a. Graph this data and find the vertical intercept. Assume the demand curve is everywhere linear.
b. Calculate an elasticity coefficient in the inelastic range of the demand curve.
c. Calculate an elasticity coefficient in the elastic range of the demand curve.
d. Find the point of unitary elasticity.
e. Find the point of maximum total revenue. What is the maximum total revenue at that point?
-Suppose that the demand schedule is given as
a. Graph this data and find the vertical intercept. Assume the demand curve is everywhere linear.
b. Calculate an elasticity coefficient in the inelastic range of the demand curve.
c. Calculate an elasticity coefficient in the elastic range of the demand curve.
d. Find the point of unitary elasticity.
e. Find the point of maximum total revenue. What is the maximum total revenue at that point?
سؤال
Understand and describe what happens when a market is not in equilibrium.
-Suppose that a supply curve is given as:

a. Graph this data.
b. Calculate an elasticity of supply coefficient.
Show the relationship between price elasticity of demand and total revenue and how this relationship is important to firms and policymakers.
-Suppose that a supply curve is given as:
a. Graph this data.
b. Calculate an elasticity of supply coefficient.
Show the relationship between price elasticity of demand and total revenue and how this relationship is important to firms and policymakers.
سؤال
سؤال
سؤال
سؤال
سؤال
سؤال
سؤال
سؤال
سؤال
سؤال
سؤال
سؤال
سؤال
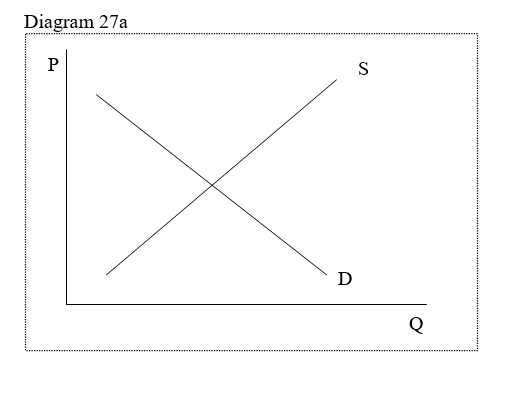
-In Diagram 27a, the demand curve represented by line D shows
A) that there is a positive relationship between price and quantity demanded.
B) that there is an inverse relationship between price and quantity demanded.
C) that the relationship between price and quantity demanded is both positive and inverse.
D) that the relationship between price and quantity demanded is circular.
سؤال
-In Diagram 27a, the supply curve represented by line S shows
A) that there is a positive relationship between price and quantity supplied.
B) that there is an inverse relationship between price and quantity supplied.
C) that the relationship between price and quantity supplied it both positive and inverse.
D) that the relationship between price and quantity supplied is circular.
سؤال
سؤال
سؤال
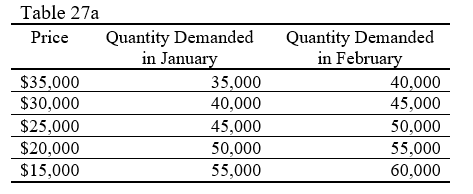
-Assume Table 27a represents demand schedules for Ford Explorers. In January consumers would have been willing to purchase 45,000 cars at a price of $25,000. In February, they would have been willing to purchase 50,000 cars at a price of $25,000. This change represents
A) an increase in demand.
B) an increase in quantity demanded.
C) an decrease in demand.
D) a decrease in quantity demanded.
سؤال
-Assume Table 27a represents demand schedules for Ford Explorers. What might account for the difference between the January demand schedule and the February demand schedule?
A) There was a shift in consumer preferences in favor of small, fuel efficient cars because of rising gasoline prices.
B) There was a decrease in consumer income in February.
C) There was a significant increase in the price of other Sport Utility Vehicles on the market.
D) Toyota and Honda announced special decreases on all their Sport Utility Vehicles in February.
سؤال

-Assume Table 27b represents supply schedules for Ford Explorers. In January Ford Motor Company would have been willing to supply 55,000 cars at a price of $35,000 and 40,000 cars at a price of $20,000. This change from $35,000 to $20,000 represents
A) an increase in supply.
B) an increase in quantity supplied.
C) an decrease in supply.
D) a decrease in quantity supplied.
سؤال
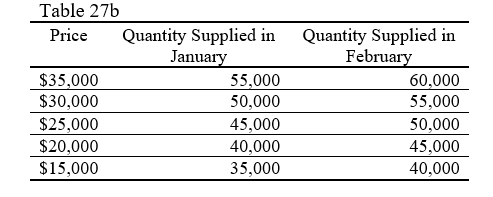
-Assume Table 27a represents supply schedules for Ford Explorers. What might account for the difference between the January supply schedule and the February supply schedule?
A) an increase in consumer income
B) a decrease in wages paid to Ford factory workers.
C) a decrease in consumer income.
D) an increase in the cost of glass used for windows in Ford Explorers.
سؤال
سؤال

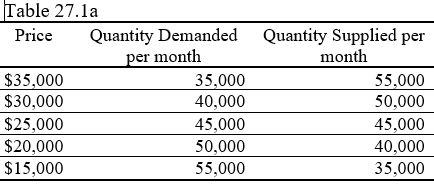
-Assume Table 27.1a represents the supply and demand of Ford Explorers. If price is currently $30,000
A) the market is in equilibrium.
B) there is excess demand.
C) there is excess supply.
D) there is both excess demand and excess supply
سؤال
-Assume Diagram 27.1a represents the market for wheat bread. The shift in demand from D1 to D2 will
A) cause equilibrium price to fall and equilibrium quantity to fall
B) cause equilibrium price to rise and equillibrium quantity to rise.
C) cause equilibrium price to fall and equilibrium quantity to rise.
D) cause equilibrium price to rise and equilibrium quantity to fall.

فتح الحزمة
قم بالتسجيل لفتح البطاقات في هذه المجموعة!
Unlock Deck
Unlock Deck
1/100
العب
ملء الشاشة (f)
Deck 27: Simple Analytics of Supply and Demand
1
Whats defention of terms:
-demand
-demand
the quantity of the good buyers would be willing and able to purchase during a given period, at various price levels, holding all other things constant
2
Whats defention of terms:
-demand curve
-demand curve
illustrates graphically the relationship between prices and the quantity demanded
3
Whats defention of terms:
-demand schedule
-demand schedule
relates various prices of a good with the amounts of that good people would like to buy at various prices
4
Whats defention of terms:
-law of demand
-law of demand
فتح الحزمة
افتح القفل للوصول البطاقات البالغ عددها 100 في هذه المجموعة.
فتح الحزمة
k this deck
5
Whats defention of terms:
-law of supply
-law of supply
فتح الحزمة
افتح القفل للوصول البطاقات البالغ عددها 100 في هذه المجموعة.
فتح الحزمة
k this deck
6
Whats defention of terms:
-supply
-supply
فتح الحزمة
افتح القفل للوصول البطاقات البالغ عددها 100 في هذه المجموعة.
فتح الحزمة
k this deck
7
Whats defention of terms:
-supply curve
-supply curve
فتح الحزمة
افتح القفل للوصول البطاقات البالغ عددها 100 في هذه المجموعة.
فتح الحزمة
k this deck
8
Whats defention of terms:
-supply schedule
-supply schedule
فتح الحزمة
افتح القفل للوصول البطاقات البالغ عددها 100 في هذه المجموعة.
فتح الحزمة
k this deck
9
Whats defention of terms:
-change in demand
-change in demand
فتح الحزمة
افتح القفل للوصول البطاقات البالغ عددها 100 في هذه المجموعة.
فتح الحزمة
k this deck
10
Whats defention of terms:
-change in quantity demanded
-change in quantity demanded
فتح الحزمة
افتح القفل للوصول البطاقات البالغ عددها 100 في هذه المجموعة.
فتح الحزمة
k this deck
11
Whats defention of terms:
-change in quantity supplied
-change in quantity supplied
فتح الحزمة
افتح القفل للوصول البطاقات البالغ عددها 100 في هذه المجموعة.
فتح الحزمة
k this deck
12
Whats defention of terms:
-change in supply
-change in supply
فتح الحزمة
افتح القفل للوصول البطاقات البالغ عددها 100 في هذه المجموعة.
فتح الحزمة
k this deck
13
Whats defention of terms:
-equilibrium
-equilibrium
فتح الحزمة
افتح القفل للوصول البطاقات البالغ عددها 100 في هذه المجموعة.
فتح الحزمة
k this deck
14
Whats defention of terms:
-excess demand
-excess demand
فتح الحزمة
افتح القفل للوصول البطاقات البالغ عددها 100 في هذه المجموعة.
فتح الحزمة
k this deck
15
Whats defention of terms:
-excess supply
-excess supply
فتح الحزمة
افتح القفل للوصول البطاقات البالغ عددها 100 في هذه المجموعة.
فتح الحزمة
k this deck
16
Whats defention of terms:
-complementary goods
-complementary goods
فتح الحزمة
افتح القفل للوصول البطاقات البالغ عددها 100 في هذه المجموعة.
فتح الحزمة
k this deck
17
Whats defention of terms:
-cross-price elasticity
-cross-price elasticity
فتح الحزمة
افتح القفل للوصول البطاقات البالغ عددها 100 في هذه المجموعة.
فتح الحزمة
k this deck
18
Whats defention of terms:
-elastic demand
-elastic demand
فتح الحزمة
افتح القفل للوصول البطاقات البالغ عددها 100 في هذه المجموعة.
فتح الحزمة
k this deck
19
Whats defention of terms:
-identification problem
-identification problem
فتح الحزمة
افتح القفل للوصول البطاقات البالغ عددها 100 في هذه المجموعة.
فتح الحزمة
k this deck
20
Whats defention of terms:
-income elasticity
-income elasticity
فتح الحزمة
افتح القفل للوصول البطاقات البالغ عددها 100 في هذه المجموعة.
فتح الحزمة
k this deck
21
Whats defention of terms:
-inelastic demand
-inelastic demand
فتح الحزمة
افتح القفل للوصول البطاقات البالغ عددها 100 في هذه المجموعة.
فتح الحزمة
k this deck
22
Whats defention of terms:
-inferior goods
-inferior goods
فتح الحزمة
افتح القفل للوصول البطاقات البالغ عددها 100 في هذه المجموعة.
فتح الحزمة
k this deck
23
Whats defention of terms:
-luxury goods
-luxury goods
فتح الحزمة
افتح القفل للوصول البطاقات البالغ عددها 100 في هذه المجموعة.
فتح الحزمة
k this deck
24
Whats defention of terms:
-necessity goods
-necessity goods
فتح الحزمة
افتح القفل للوصول البطاقات البالغ عددها 100 في هذه المجموعة.
فتح الحزمة
k this deck
25
Whats defention of terms:
-normal goods
-normal goods
فتح الحزمة
افتح القفل للوصول البطاقات البالغ عددها 100 في هذه المجموعة.
فتح الحزمة
k this deck
26
Whats defention of terms:
-perfectly elastic
-perfectly elastic
فتح الحزمة
افتح القفل للوصول البطاقات البالغ عددها 100 في هذه المجموعة.
فتح الحزمة
k this deck
27
Whats defention of terms:
-perfectly inelastic
-perfectly inelastic
فتح الحزمة
افتح القفل للوصول البطاقات البالغ عددها 100 في هذه المجموعة.
فتح الحزمة
k this deck
28
Whats defention of terms:
-price elasticity of demand
-price elasticity of demand
فتح الحزمة
افتح القفل للوصول البطاقات البالغ عددها 100 في هذه المجموعة.
فتح الحزمة
k this deck
29
Whats defention of terms:
-price elasticity of supply
-price elasticity of supply
فتح الحزمة
افتح القفل للوصول البطاقات البالغ عددها 100 في هذه المجموعة.
فتح الحزمة
k this deck
30
Whats defention of terms:
-substitute goods
-substitute goods
فتح الحزمة
افتح القفل للوصول البطاقات البالغ عددها 100 في هذه المجموعة.
فتح الحزمة
k this deck
31
Whats defention of terms:
-total revenue
-total revenue
فتح الحزمة
افتح القفل للوصول البطاقات البالغ عددها 100 في هذه المجموعة.
فتح الحزمة
k this deck
32
Whats defention of terms:
-unitary elasticity
-unitary elasticity
فتح الحزمة
افتح القفل للوصول البطاقات البالغ عددها 100 في هذه المجموعة.
فتح الحزمة
k this deck
33
Define and explain the basics of supply and demand analysis.
-Explain what is meant by referring to the market as a "process."
-Explain what is meant by referring to the market as a "process."
فتح الحزمة
افتح القفل للوصول البطاقات البالغ عددها 100 في هذه المجموعة.
فتح الحزمة
k this deck
34
Define and explain the basics of supply and demand analysis.
-State the law of demand. State the law of supply. What is meant by the phrase "…holding all other things constant?"
-State the law of demand. State the law of supply. What is meant by the phrase "…holding all other things constant?"
فتح الحزمة
افتح القفل للوصول البطاقات البالغ عددها 100 في هذه المجموعة.
فتح الحزمة
k this deck
35
Define and explain the basics of supply and demand analysis.
-What is equilibrium? Why is it significant? Does it ever change?
-What is equilibrium? Why is it significant? Does it ever change?
فتح الحزمة
افتح القفل للوصول البطاقات البالغ عددها 100 في هذه المجموعة.
فتح الحزمة
k this deck
36
Understand the context in which the supply and demand model is developed.
-Explain why the focus of supply and demand analysis is strictly limited to exchange?
-Explain why the focus of supply and demand analysis is strictly limited to exchange?
فتح الحزمة
افتح القفل للوصول البطاقات البالغ عددها 100 في هذه المجموعة.
فتح الحزمة
k this deck
37
Understand the context in which the supply and demand model is developed.
-Does the demand curve in the supply and demand model capture all the people who want or desire a good? Why or why not?
-Does the demand curve in the supply and demand model capture all the people who want or desire a good? Why or why not?
فتح الحزمة
افتح القفل للوصول البطاقات البالغ عددها 100 في هذه المجموعة.
فتح الحزمة
k this deck
38
Explain the progressive critiques of supply and demand analysis.
-What happens to supply and demand analysis if the government intervenes in the market?
-What happens to supply and demand analysis if the government intervenes in the market?
فتح الحزمة
افتح القفل للوصول البطاقات البالغ عددها 100 في هذه المجموعة.
فتح الحزمة
k this deck
39
Explain the progressive critiques of supply and demand analysis.
-Are there many real world examples of perfectly competitive markets? What might that mean for supply and demand analysis? Give an example.
-Are there many real world examples of perfectly competitive markets? What might that mean for supply and demand analysis? Give an example.
فتح الحزمة
افتح القفل للوصول البطاقات البالغ عددها 100 في هذه المجموعة.
فتح الحزمة
k this deck
40
Define equilibrium and explain what it means.
-What is equilibrium? Why is it such an important concept?
-What is equilibrium? Why is it such an important concept?
فتح الحزمة
افتح القفل للوصول البطاقات البالغ عددها 100 في هذه المجموعة.
فتح الحزمة
k this deck
41
Understand and describe what happens when a market is not in equilibrium.
-Use supply and demand to explain excess supply. What might cause excess supply? Describe the process that eliminates excess supply.
-Use supply and demand to explain excess supply. What might cause excess supply? Describe the process that eliminates excess supply.
فتح الحزمة
افتح القفل للوصول البطاقات البالغ عددها 100 في هذه المجموعة.
فتح الحزمة
k this deck
42
Understand and describe what happens when a market is not in equilibrium.
-Use supply and demand to explain excess demand. What might cause excess demand? Describe the process that eliminates excess demand.
-Use supply and demand to explain excess demand. What might cause excess demand? Describe the process that eliminates excess demand.
فتح الحزمة
افتح القفل للوصول البطاقات البالغ عددها 100 في هذه المجموعة.
فتح الحزمة
k this deck
43
Understand and describe what happens when a market is not in equilibrium.
-What three factors can cause a change in demand? What factor can cause a change in the quantity demanded?
-What three factors can cause a change in demand? What factor can cause a change in the quantity demanded?
فتح الحزمة
افتح القفل للوصول البطاقات البالغ عددها 100 في هذه المجموعة.
فتح الحزمة
k this deck
44
Understand and describe what happens when a market is not in equilibrium.
-Carefully distinguish between a change in supply and a change in the quantity ?supplied.
-Carefully distinguish between a change in supply and a change in the quantity ?supplied.
فتح الحزمة
افتح القفل للوصول البطاقات البالغ عددها 100 في هذه المجموعة.
فتح الحزمة
k this deck
45
Understand and describe what happens when a market is not in equilibrium.
-What factors can cause a change in supply? What causes a change in the quantity ?supplied?
-What factors can cause a change in supply? What causes a change in the quantity ?supplied?
فتح الحزمة
افتح القفل للوصول البطاقات البالغ عددها 100 في هذه المجموعة.
فتح الحزمة
k this deck
46
Understand and describe what happens when a market is not in equilibrium.
-Draw a simple supply and demand curve diagram for coffee. Assume that incomes of consumer are rising. What happens to demand and supply? What happens to equilibrium price and quantity?
-Draw a simple supply and demand curve diagram for coffee. Assume that incomes of consumer are rising. What happens to demand and supply? What happens to equilibrium price and quantity?
فتح الحزمة
افتح القفل للوصول البطاقات البالغ عددها 100 في هذه المجموعة.
فتح الحزمة
k this deck
47
Understand and describe what happens when a market is not in equilibrium.
-Assume that for some reason the coffee price in the previous question is above the equilibrium price. What pressures would cause this market to tend toward equilibrium?
-Assume that for some reason the coffee price in the previous question is above the equilibrium price. What pressures would cause this market to tend toward equilibrium?
فتح الحزمة
افتح القفل للوصول البطاقات البالغ عددها 100 في هذه المجموعة.
فتح الحزمة
k this deck
48
Understand and describe what happens when a market is not in equilibrium.
-Assume that the price of coffee is below equilibrium. What pressures would cause this market to tend toward equilibrium?
-Assume that the price of coffee is below equilibrium. What pressures would cause this market to tend toward equilibrium?
فتح الحزمة
افتح القفل للوصول البطاقات البالغ عددها 100 في هذه المجموعة.
فتح الحزمة
k this deck
49
Understand and describe what happens when a market is not in equilibrium.
-Suppose that the market for wooden Number 2 lead pencils is in equilibrium. Determine how the following shocks will affect the equilibrium price and quantity. Draw a graph to illustrate each of your answers.
a. Professors begin to require ink on all exams.
b. The price of lead increases.
c. School attendance falls.
d. Legislation restricts lumber harvests.
e. Pencil makers receive a large wage increase.
f. The price of ballpoint pens falls.
فتح الحزمة
افتح القفل للوصول البطاقات البالغ عددها 100 في هذه المجموعة.
فتح الحزمة
k this deck
50
Understand and describe what happens when a market is not in equilibrium.
-Suppose that the market for PC laptop computers is in equilibrium. Determine how the following shocks will affect the equilibrium price and quantity. Draw a fully labeled demand and supply curve diagram to illustrate each of your answers.
a. Computers become easier to use.
b. The price of memory chips falls.
c. Software prices fall.
d. All college students are required to own personal computers.
e. The price of electricity rises substantially.
f. Doctors warn of health risks from radiation from video terminals.
فتح الحزمة
افتح القفل للوصول البطاقات البالغ عددها 100 في هذه المجموعة.
فتح الحزمة
k this deck
51
Understand and describe what happens when a market is not in equilibrium.
-What does the measure of price elasticity try to capture? Why might this measure be useful information?
-What does the measure of price elasticity try to capture? Why might this measure be useful information?
فتح الحزمة
افتح القفل للوصول البطاقات البالغ عددها 100 في هذه المجموعة.
فتح الحزمة
k this deck
52
Understand and describe what happens when a market is not in equilibrium.
-What are the main determinants of price elasticity of demand? What are the main determinants of price elasticity of supply?
-What are the main determinants of price elasticity of demand? What are the main determinants of price elasticity of supply?
فتح الحزمة
افتح القفل للوصول البطاقات البالغ عددها 100 في هذه المجموعة.
فتح الحزمة
k this deck
53
Understand and describe what happens when a market is not in equilibrium.
-How is price elasticity of demand calculated? Why do we use absolute values for price elasticity of demand?
-How is price elasticity of demand calculated? Why do we use absolute values for price elasticity of demand?
فتح الحزمة
افتح القفل للوصول البطاقات البالغ عددها 100 في هذه المجموعة.
فتح الحزمة
k this deck
54
Understand and describe what happens when a market is not in equilibrium.
-Explain why all downward-sloping linear demand curves have elastic, inelastic, and unitary elastic regions.
-Explain why all downward-sloping linear demand curves have elastic, inelastic, and unitary elastic regions.
فتح الحزمة
افتح القفل للوصول البطاقات البالغ عددها 100 في هذه المجموعة.
فتح الحزمة
k this deck
55
Understand and describe what happens when a market is not in equilibrium.
-What is the difference between elasticity and slope?
-What is the difference between elasticity and slope?
فتح الحزمة
افتح القفل للوصول البطاقات البالغ عددها 100 في هذه المجموعة.
فتح الحزمة
k this deck
56
Understand and describe what happens when a market is not in equilibrium.
-Suppose that the demand schedule is given as
a. Graph this data and find the vertical intercept. Assume the demand curve is everywhere linear.
b. Calculate an elasticity coefficient in the inelastic range of the demand curve.
c. Calculate an elasticity coefficient in the elastic range of the demand curve.
d. Find the point of unitary elasticity.
e. Find the point of maximum total revenue. What is the maximum total revenue at that point?
فتح الحزمة
افتح القفل للوصول البطاقات البالغ عددها 100 في هذه المجموعة.
فتح الحزمة
k this deck
57
Understand and describe what happens when a market is not in equilibrium.
-Suppose that a supply curve is given as:
a. Graph this data.
b. Calculate an elasticity of supply coefficient.
Show the relationship between price elasticity of demand and total revenue and how this relationship is important to firms and policymakers.
-Suppose that a supply curve is given as:
a. Graph this data.
b. Calculate an elasticity of supply coefficient.
Show the relationship between price elasticity of demand and total revenue and how this relationship is important to firms and policymakers.
فتح الحزمة
افتح القفل للوصول البطاقات البالغ عددها 100 في هذه المجموعة.
فتح الحزمة
k this deck
58
Understand and describe what happens when a market is not in equilibrium.
-How are total revenue and price elasticity of demand related?
-How are total revenue and price elasticity of demand related?
فتح الحزمة
افتح القفل للوصول البطاقات البالغ عددها 100 في هذه المجموعة.
فتح الحزمة
k this deck
59
Understand and describe what happens when a market is not in equilibrium.
-Would a firm planning a price increase be better off if the demand for its product was elastic or inelastic? Explain.
-Would a firm planning a price increase be better off if the demand for its product was elastic or inelastic? Explain.
فتح الحزمة
افتح القفل للوصول البطاقات البالغ عددها 100 في هذه المجموعة.
فتح الحزمة
k this deck
60
Understand and describe what happens when a market is not in equilibrium.
-As manager of the Eagle Crest Ski Resort and Lodge, you announce an increase in the price of lift tickets from $35 to $50. The number of skiers falls, but your total revenue increases.
a. What does this say about the elasticity of demand for lift tickets? Should you raise ticket prices even more?
b. Your friend, an avid skier and economics major-but in no way affiliated with the ski lodge-says she is actually happy that you raised the ticket prices. How could she think such a thing?
فتح الحزمة
افتح القفل للوصول البطاقات البالغ عددها 100 في هذه المجموعة.
فتح الحزمة
k this deck
61
Understand and describe what happens when a market is not in equilibrium.
-Use price elasticity to explain the following observations:
a. The price of gasoline is higher near the freeway than at a gas station two miles off the freeway.
b. Airline tickets are less expensive if purchased a month before you plan to fly than if purchased one day before you plan to fly.
c. Prices in grocery stores in low-income areas of town might actually be higher than in a more affluent area of town.
فتح الحزمة
افتح القفل للوصول البطاقات البالغ عددها 100 في هذه المجموعة.
فتح الحزمة
k this deck
62
Calculate and explain the use of income elasticity.
-What is income elasticity? What is it used to measure?
-What is income elasticity? What is it used to measure?
فتح الحزمة
افتح القفل للوصول البطاقات البالغ عددها 100 في هذه المجموعة.
فتح الحزمة
k this deck
63
Calculate and explain the use of income elasticity.
-Use income elasticity to explain the differences between normal, inferior, luxury, and necessity goods.
-Use income elasticity to explain the differences between normal, inferior, luxury, and necessity goods.
فتح الحزمة
افتح القفل للوصول البطاقات البالغ عددها 100 في هذه المجموعة.
فتح الحزمة
k this deck
64
Calculate and explain the use of income elasticity.
-Look at each of the following pairs and discuss which component has a higher price and income elasticity. Briefly explain your answer.
a. movies/taxi cabs
b. tobacco/gasoline
c. electricity/water
d. mobile phone service/clothing
e. intercity busses/doctor's services
Both are necessity goods. Doctor's services are likely to be more inelastic in most cases.
فتح الحزمة
افتح القفل للوصول البطاقات البالغ عددها 100 في هذه المجموعة.
فتح الحزمة
k this deck
65
Define cross-price elasticity and show how it is used to define necessity and luxury goods.
-What is a complement and what is a substitute good? Give examples of goods that are complements and goods that are substitutes.
-What is a complement and what is a substitute good? Give examples of goods that are complements and goods that are substitutes.
فتح الحزمة
افتح القفل للوصول البطاقات البالغ عددها 100 في هذه المجموعة.
فتح الحزمة
k this deck
66
Define cross-price elasticity and show how it is used to define necessity and luxury goods.
-What is cross-price elasticity? What is the formula for calculating cross-price elasticity?
-What is cross-price elasticity? What is the formula for calculating cross-price elasticity?
فتح الحزمة
افتح القفل للوصول البطاقات البالغ عددها 100 في هذه المجموعة.
فتح الحزمة
k this deck
67
Define cross-price elasticity and show how it is used to define necessity and luxury goods.
-Using cross-price elasticity, how is it determined whether a good is a complement or substitute?
-Using cross-price elasticity, how is it determined whether a good is a complement or substitute?
فتح الحزمة
افتح القفل للوصول البطاقات البالغ عددها 100 في هذه المجموعة.
فتح الحزمة
k this deck
68
Explain the limitations of elasticity (demand, supply, income, and cross-price).
-What are some problems with measuring the various types of elasticities?
-What are some problems with measuring the various types of elasticities?
فتح الحزمة
افتح القفل للوصول البطاقات البالغ عددها 100 في هذه المجموعة.
فتح الحزمة
k this deck
69
Explain the limitations of elasticity (demand, supply, income, and cross-price).
-Explain the "identification problem."
-Explain the "identification problem."
فتح الحزمة
افتح القفل للوصول البطاقات البالغ عددها 100 في هذه المجموعة.
فتح الحزمة
k this deck
70
-In Diagram 27a, the demand curve represented by line D shows
A) that there is a positive relationship between price and quantity demanded.
B) that there is an inverse relationship between price and quantity demanded.
C) that the relationship between price and quantity demanded is both positive and inverse.
D) that the relationship between price and quantity demanded is circular.
فتح الحزمة
افتح القفل للوصول البطاقات البالغ عددها 100 في هذه المجموعة.
فتح الحزمة
k this deck
71
-In Diagram 27a, the supply curve represented by line S shows
A) that there is a positive relationship between price and quantity supplied.
B) that there is an inverse relationship between price and quantity supplied.
C) that the relationship between price and quantity supplied it both positive and inverse.
D) that the relationship between price and quantity supplied is circular.
فتح الحزمة
افتح القفل للوصول البطاقات البالغ عددها 100 في هذه المجموعة.
فتح الحزمة
k this deck
72
Which of the following factors may influence the demand for coffee sold in fast food restaurants?
A) the cost of coffee beans used to make the coffee.
B) the income of consumers shopping in fast food restaurants.
C) the wages paid to workers in fast food restaurants.
D) the weather during the growing season in Brazil (where the coffee is grown).
A) the cost of coffee beans used to make the coffee.
B) the income of consumers shopping in fast food restaurants.
C) the wages paid to workers in fast food restaurants.
D) the weather during the growing season in Brazil (where the coffee is grown).
فتح الحزمة
افتح القفل للوصول البطاقات البالغ عددها 100 في هذه المجموعة.
فتح الحزمة
k this deck
73
In the simple supply and demand diagram, equilibrium prices are determined by
A) demand
B) supply
C) both supply and demand
D) the government
A) demand
B) supply
C) both supply and demand
D) the government
فتح الحزمة
افتح القفل للوصول البطاقات البالغ عددها 100 في هذه المجموعة.
فتح الحزمة
k this deck
74
-Assume Table 27a represents demand schedules for Ford Explorers. In January consumers would have been willing to purchase 45,000 cars at a price of $25,000. In February, they would have been willing to purchase 50,000 cars at a price of $25,000. This change represents
A) an increase in demand.
B) an increase in quantity demanded.
C) an decrease in demand.
D) a decrease in quantity demanded.
فتح الحزمة
افتح القفل للوصول البطاقات البالغ عددها 100 في هذه المجموعة.
فتح الحزمة
k this deck
75
-Assume Table 27a represents demand schedules for Ford Explorers. What might account for the difference between the January demand schedule and the February demand schedule?
A) There was a shift in consumer preferences in favor of small, fuel efficient cars because of rising gasoline prices.
B) There was a decrease in consumer income in February.
C) There was a significant increase in the price of other Sport Utility Vehicles on the market.
D) Toyota and Honda announced special decreases on all their Sport Utility Vehicles in February.
فتح الحزمة
افتح القفل للوصول البطاقات البالغ عددها 100 في هذه المجموعة.
فتح الحزمة
k this deck
76
-Assume Table 27b represents supply schedules for Ford Explorers. In January Ford Motor Company would have been willing to supply 55,000 cars at a price of $35,000 and 40,000 cars at a price of $20,000. This change from $35,000 to $20,000 represents
A) an increase in supply.
B) an increase in quantity supplied.
C) an decrease in supply.
D) a decrease in quantity supplied.
فتح الحزمة
افتح القفل للوصول البطاقات البالغ عددها 100 في هذه المجموعة.
فتح الحزمة
k this deck
77
-Assume Table 27a represents supply schedules for Ford Explorers. What might account for the difference between the January supply schedule and the February supply schedule?
A) an increase in consumer income
B) a decrease in wages paid to Ford factory workers.
C) a decrease in consumer income.
D) an increase in the cost of glass used for windows in Ford Explorers.
فتح الحزمة
افتح القفل للوصول البطاقات البالغ عددها 100 في هذه المجموعة.
فتح الحزمة
k this deck
78
A movement along the same demand curve is referred to as
A) an change in demand
B) a change in quantity demanded.
C) a change in the demand schedule.
D) an income effect.
A) an change in demand
B) a change in quantity demanded.
C) a change in the demand schedule.
D) an income effect.
فتح الحزمة
افتح القفل للوصول البطاقات البالغ عددها 100 في هذه المجموعة.
فتح الحزمة
k this deck
79
-Assume Table 27.1a represents the supply and demand of Ford Explorers. If price is currently $30,000
A) the market is in equilibrium.
B) there is excess demand.
C) there is excess supply.
D) there is both excess demand and excess supply
فتح الحزمة
افتح القفل للوصول البطاقات البالغ عددها 100 في هذه المجموعة.
فتح الحزمة
k this deck
80
-Assume Diagram 27.1a represents the market for wheat bread. The shift in demand from D1 to D2 will
A) cause equilibrium price to fall and equilibrium quantity to fall
B) cause equilibrium price to rise and equillibrium quantity to rise.
C) cause equilibrium price to fall and equilibrium quantity to rise.
D) cause equilibrium price to rise and equilibrium quantity to fall.
فتح الحزمة
افتح القفل للوصول البطاقات البالغ عددها 100 في هذه المجموعة.
فتح الحزمة
k this deck
فتح الحزمة
افتح القفل للوصول البطاقات البالغ عددها 100 في هذه المجموعة.


