Deck 31: Phillips Curve
ملء الشاشة (f)
سؤال
سؤال
سؤال
سؤال
سؤال
سؤال
سؤال
سؤال
سؤال
سؤال
سؤال
سؤال
سؤال
سؤال
سؤال
سؤال
سؤال
سؤال
سؤال
سؤال
سؤال
سؤال
سؤال
سؤال
سؤال
سؤال
سؤال
سؤال
سؤال
سؤال
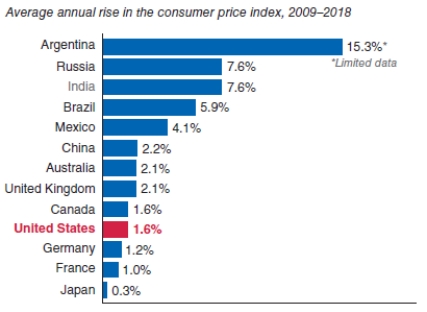
The figure shows inflation from 2009 to 2018 for countries in the Organization for Economic Cooperation and Development (OECD). The country with the highest inflation rate was:

A)Switzerland.
B)Argentina.
C)Turkey.
D)Italy.
A)Switzerland.
B)Argentina.
C)Turkey.
D)Italy.
سؤال
The figure shows inflation from 2009 to 2018 for countries in the Organization for Economic Cooperation and Development (OECD). The country with the lowest inflation rate was:

A)Japan.
B)Argentina.
C)Turkey.
D)Italy.
A)Japan.
B)Argentina.
C)Turkey.
D)Italy.
سؤال
The figure shows inflation from 2009 to 2018 for countries in the Organization for Economic Cooperation and Development (OECD). The country with the second-highest inflation rate was:
A)Switzerland.
B)Argentina.
C)Russia.
D)Italy.
A)Switzerland.
B)Argentina.
C)Russia.
D)Italy.
سؤال
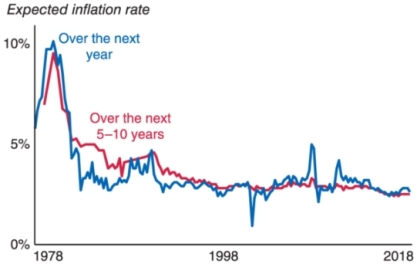
The figure shows inflation expectations for U.S. consumers over time. In which time period did consumers expect the highest inflation rates?
A)late 1990s
B)early 1990s
C)late 1970s
D)early 2000s
A)late 1990s
B)early 1990s
C)late 1970s
D)early 2000s
سؤال
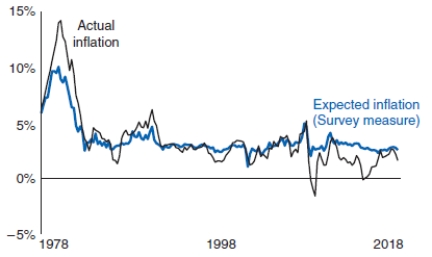
The figure shows inflation expectations and actual inflation for U.S. consumers over time. Which of the following statements correctly describes the relationship between these rates?
A)Actual inflation and inflation expectations seem to behave independently.
B)Actual inflation and inflation expectations are exactly the same over time.
C)Actual inflation tends to follow inflation expectations.
D)Actual inflation and inflation expectations have an inverse relationship.
A)Actual inflation and inflation expectations seem to behave independently.
B)Actual inflation and inflation expectations are exactly the same over time.
C)Actual inflation tends to follow inflation expectations.
D)Actual inflation and inflation expectations have an inverse relationship.
سؤال
سؤال
سؤال
سؤال
سؤال
سؤال
سؤال
سؤال
سؤال
سؤال
سؤال
سؤال
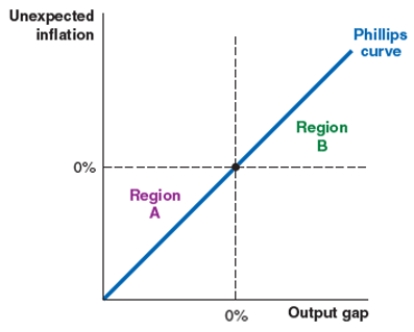
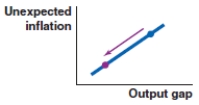
Consider the Phillips curve shown here. In region A:

A)inflation falls below expected inflation.
B)inflation rises above expected inflation.
C)there is excess demand.
D)the output gap is positive.
A)inflation falls below expected inflation.
B)inflation rises above expected inflation.
C)there is excess demand.
D)the output gap is positive.
سؤال
Consider the Phillips curve shown here. In region A:

A)inflation equals expected inflation.
B)inflation rises above expected inflation.
C)there is insufficient demand.
D)the output gap is positive.
A)inflation equals expected inflation.
B)inflation rises above expected inflation.
C)there is insufficient demand.
D)the output gap is positive.
سؤال
Consider the Phillips curve shown here. In region A:

A)inflation equals expected inflation.
B)inflation rises above expected inflation.
C)there is excess demand.
D)the output gap is negative.
A)inflation equals expected inflation.
B)inflation rises above expected inflation.
C)there is excess demand.
D)the output gap is negative.
سؤال
Consider the Phillips curve shown here. In region B:

A)inflation equals expected inflation.
B)inflation rises above expected inflation.
C)there is insufficient demand.
D)the output gap is negative.
A)inflation equals expected inflation.
B)inflation rises above expected inflation.
C)there is insufficient demand.
D)the output gap is negative.
سؤال
Consider the Phillips curve shown here. In region B:
A)there is excess demand.
B)inflation falls below expected inflation.
C)there is insufficient demand.
D)the output gap is negative.
A)there is excess demand.
B)inflation falls below expected inflation.
C)there is insufficient demand.
D)the output gap is negative.
سؤال
Consider the Phillips curve shown here. In region B:

A)there is insufficient demand.
B)inflation falls below expected inflation.
C)the output gap is positive.
D)the output gap is negative.
A)there is insufficient demand.
B)inflation falls below expected inflation.
C)the output gap is positive.
D)the output gap is negative.
سؤال
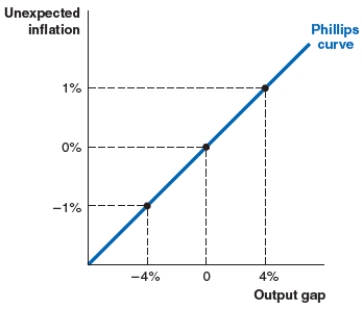
Suppose that in a given country, the line of best fit approximates the Phillips curve shown here. When the output gap is -4%:

A)there is excess demand.
B)inflation rises above expected inflation.
C)the output gap is positive.
D)the output gap is negative.
A)there is excess demand.
B)inflation rises above expected inflation.
C)the output gap is positive.
D)the output gap is negative.
سؤال
Suppose that in a given country, the line of best fit approximates the Phillips curve shown here. When the output gap is 4%:
A)there is insufficient demand.
B)inflation falls below expected inflation.
C)the output gap is positive.
D)the output gap is negative.
A)there is insufficient demand.
B)inflation falls below expected inflation.
C)the output gap is positive.
D)the output gap is negative.
سؤال
Suppose that in a given country, the line of best fit approximates the Phillips curve shown here. When the output gap is 4%:

A)there is insufficient demand.
B)inflation rises above expected inflation.
C)unexpected inflation is zero.
D)the output gap is negative.
A)there is insufficient demand.
B)inflation rises above expected inflation.
C)unexpected inflation is zero.
D)the output gap is negative.
سؤال
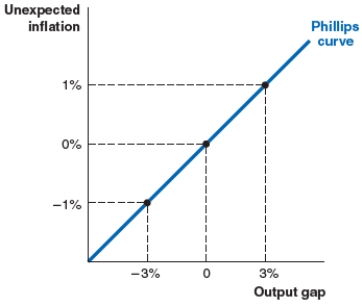
Suppose that in a given country, the line of best fit approximates the Phillips curve shown here. Next year, you expect GDP to be 3% above potential GDP. What is your forecast for unexpected inflation?

A)1%
B)0%
C)3%
D)-1%
A)1%
B)0%
C)3%
D)-1%
سؤال
Suppose that in a given country, the line of best fit approximates the Phillips curve shown here. Next year, you expect GDP to be 3% below potential GDP. What is your forecast for unexpected inflation?

A)1%
B)0%
C)3%
D)-1%
A)1%
B)0%
C)3%
D)-1%
سؤال
Suppose that in a given country, the line of best fit approximates the Phillips curve shown here. Next year, you expect GDP to be equal to potential GDP. What is your forecast for unexpected inflation?

A)1%
B)0%
C)3%
D)-1%
A)1%
B)0%
C)3%
D)-1%
سؤال
Suppose that in a given country, the line of best fit approximates the Phillips curve shown here. Next year, you expect GDP to be 3% above potential GDP. Current inflation expectations are at 2%. How much does your salary have to change, in nominal terms, in order to maintain your purchasing power?

A)3%
B)2%
C)1%
D)4%
A)3%
B)2%
C)1%
D)4%
سؤال
Suppose that in a given country, the line of best fit approximates the Phillips curve shown here. Suppose for next year, you expect GDP to be 3% below potential GDP. Current inflation expectations are at 2%. How much does your salary have to change, in nominal terms, in order to maintain your purchasing power?
A)3%
B)2%
C)1%
D)4%
A)3%
B)2%
C)1%
D)4%
سؤال
Suppose that in a given country, the line of best fit approximates the Phillips curve shown here. Suppose for next year, you expect GDP to be equal to potential GDP. Current inflation expectations are at 2%. How much does your salary have to change, in nominal terms, in order to maintain your purchasing power at the current level?

A)3%
B)2%
C)1%
D)4%
A)3%
B)2%
C)1%
D)4%
سؤال
سؤال
سؤال
سؤال
سؤال
سؤال
سؤال
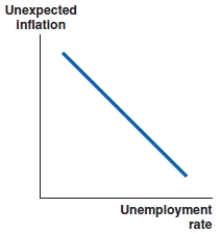
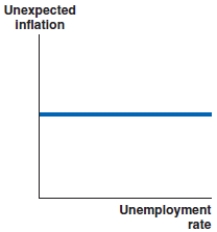
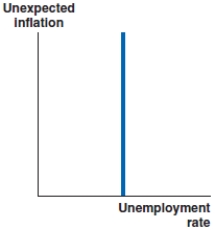
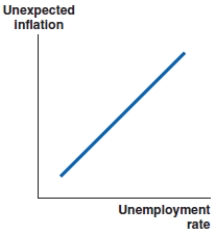
Which of the graphs shows the correct shape of the labor market Phillips curve?
A)
B)
C)
D)
A)
B)
C)
D)
سؤال
سؤال
سؤال
سؤال
سؤال
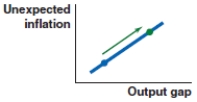
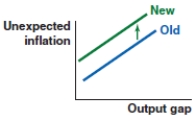
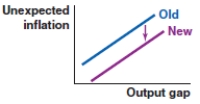
Suppose that the euro depreciates. Which figure shows the effect on the Phillips curve in Germany?
A)

B)

C)

D)

A)
B)
C)
D)
سؤال
Suppose that the U.S. dollar appreciates. Which figure shows the effect on the Phillips curve in the United States?
A)

B)

C)

D)

A)
B)
C)
D)
سؤال
Suppose that the Indian rupee loses value against the U.S. dollar. Which figure shows the effect on the Phillips curve in India?
A)

B)

C)

D)

A)
B)
C)
D)
سؤال
Canada is the world's largest exporter of sawn wood, which is used as an input in products produced by other countries. Cutbacks at Canadian lumber factories caused a rise in lumber prices. How does this affect the Phillips curve in China?
A)

B)

C)

D)

A)
B)
C)
D)
سؤال
The use of automated harvesting machines greatly increased productivity in farming. How does this affect the Phillips curve for an economy where agriculture is a significant part of GDP?
A)

B)

C)

D)

A)
B)
C)
D)
سؤال
If robots replace workers on the production lines, what do we expect would happen to the Phillips curve?
A)

B)

C)

D)

A)
B)
C)
D)
سؤال
Suppose the Chinese economy is experiencing significant excess demand. Which figure shows the effect on the Phillips curve in China?
A)
B)
C)

D)
A)
B)
C)
D)
سؤال
Suppose the Kenyan markets are experiencing insufficient demand. Which figure shows the effect on the Phillips curve in Kenya?
A)

B)

C)

D)

A)
B)
C)
D)
سؤال
The output gap becomes negative in Bangladesh. Which figure shows the effect on the Phillips curve in Bangladesh?
A)

B)

C)
D)

A)
B)
C)
D)

فتح الحزمة
قم بالتسجيل لفتح البطاقات في هذه المجموعة!
Unlock Deck
Unlock Deck
1/131
العب
ملء الشاشة (f)
Deck 31: Phillips Curve
1
If a manager has an expectation of ongoing inflation, this means she believes that:
A)inflation has been negative but will soon turn positive.
B)wages will rise.
C)deflation will occur.
D)cost of inputs will rise.
A)inflation has been negative but will soon turn positive.
B)wages will rise.
C)deflation will occur.
D)cost of inputs will rise.
D
2
If managers have an expectation of ongoing inflation, then it is likely that:
A)prices will not change.
B)prices will rise.
C)prices will fall.
D)the cost of inputs will fall.
A)prices will not change.
B)prices will rise.
C)prices will fall.
D)the cost of inputs will fall.
B
3
The rate of change of inflation is affected by:
(i) inflation expectations.
(ii) demand.
(iii) the measurement of inflation.
(iv) supply shocks.
A)(i) only
B)(i) and (ii)
C)(i), (ii), and (iv)
D)(ii), (iii), and (iv)
(i) inflation expectations.
(ii) demand.
(iii) the measurement of inflation.
(iv) supply shocks.
A)(i) only
B)(i) and (ii)
C)(i), (ii), and (iv)
D)(ii), (iii), and (iv)
C
4
What is excess demand?
A)too many buyers for too few goods
B)too much supply for too few buyers
C)fast-changing consumer preferences
D)higher equilibrium quantity
A)too many buyers for too few goods
B)too much supply for too few buyers
C)fast-changing consumer preferences
D)higher equilibrium quantity
فتح الحزمة
افتح القفل للوصول البطاقات البالغ عددها 131 في هذه المجموعة.
فتح الحزمة
k this deck
5
Excess demand occurs when:
A)there is a surplus in the market.
B)supply is in excess of demand at the market price.
C)demand is in excess of supply at the market price.
D)demand and supply are equal at the market price.
A)there is a surplus in the market.
B)supply is in excess of demand at the market price.
C)demand is in excess of supply at the market price.
D)demand and supply are equal at the market price.
فتح الحزمة
افتح القفل للوصول البطاقات البالغ عددها 131 في هذه المجموعة.
فتح الحزمة
k this deck
6
Excess demand leads to a:
A)surplus and falling prices.
B)shortage and falling prices.
C)shortage and rising prices.
D)surplus and rising prices.
A)surplus and falling prices.
B)shortage and falling prices.
C)shortage and rising prices.
D)surplus and rising prices.
فتح الحزمة
افتح القفل للوصول البطاقات البالغ عددها 131 في هذه المجموعة.
فتح الحزمة
k this deck
7
What is insufficient demand?
A)too many buyers for too few goods
B)too much supply for too few buyers
C)slow-changing consumer preferences
D)lower equilibrium quantity
A)too many buyers for too few goods
B)too much supply for too few buyers
C)slow-changing consumer preferences
D)lower equilibrium quantity
فتح الحزمة
افتح القفل للوصول البطاقات البالغ عددها 131 في هذه المجموعة.
فتح الحزمة
k this deck
8
Insufficient demand occurs when:
A)there is a shortage in the market.
B)supply is in excess of demand at the market price.
C)demand is in excess of supply at the market price.
D)demand and supply are equal at the market price.
A)there is a shortage in the market.
B)supply is in excess of demand at the market price.
C)demand is in excess of supply at the market price.
D)demand and supply are equal at the market price.
فتح الحزمة
افتح القفل للوصول البطاقات البالغ عددها 131 في هذه المجموعة.
فتح الحزمة
k this deck
9
Insufficient demand leads to a:
A)surplus and falling prices.
B)shortage and falling prices.
C)shortage and rising prices.
D)surplus and rising prices.
A)surplus and falling prices.
B)shortage and falling prices.
C)shortage and rising prices.
D)surplus and rising prices.
فتح الحزمة
افتح القفل للوصول البطاقات البالغ عددها 131 في هذه المجموعة.
فتح الحزمة
k this deck
10
Inflation expectations refer to the rate at which:
A)actual inflation exceeds expected inflation.
B)last year's prices rose.
C)current prices are rising.
D)average prices are expected to rise next year.
A)actual inflation exceeds expected inflation.
B)last year's prices rose.
C)current prices are rising.
D)average prices are expected to rise next year.
فتح الحزمة
افتح القفل للوصول البطاقات البالغ عددها 131 في هذه المجموعة.
فتح الحزمة
k this deck
11
Demand-pull inflation is inflation resulting from:
A)a surplus.
B)excess supply.
C)excess demand.
D)insufficient demand.
A)a surplus.
B)excess supply.
C)excess demand.
D)insufficient demand.
فتح الحزمة
افتح القفل للوصول البطاقات البالغ عددها 131 في هذه المجموعة.
فتح الحزمة
k this deck
12
When the output gap becomes more positive:
A)prices fall due to surpluses.
B)demand-pull inflation rises.
C)unemployment rises.
D)negative supply shocks come about.
A)prices fall due to surpluses.
B)demand-pull inflation rises.
C)unemployment rises.
D)negative supply shocks come about.
فتح الحزمة
افتح القفل للوصول البطاقات البالغ عددها 131 في هذه المجموعة.
فتح الحزمة
k this deck
13
Consumer confidence in the economy increases greatly, and consumers increase spending significantly. Production does not increase as fast, and prices rise. This scenario describes:
A)cost-push inflation.
B)demand-pull inflation.
C)unanticipated deflation.
D)a negative output gap.
A)cost-push inflation.
B)demand-pull inflation.
C)unanticipated deflation.
D)a negative output gap.
فتح الحزمة
افتح القفل للوصول البطاقات البالغ عددها 131 في هذه المجموعة.
فتح الحزمة
k this deck
14
In 2008, consumer confidence fell in the United States. This would lead to:
A)cost-push inflation.
B)demand-pull inflation.
C)falling unemployment.
D)insufficient demand.
A)cost-push inflation.
B)demand-pull inflation.
C)falling unemployment.
D)insufficient demand.
فتح الحزمة
افتح القفل للوصول البطاقات البالغ عددها 131 في هذه المجموعة.
فتح الحزمة
k this deck
15
A sudden unexpected situation of stagflation (a situation of high inflation and high unemployment) is evidenced when the labor market Phillips curve:
A)becomes vertical.
B)has a slope of zero.
C)shifts inward.
D)shifts outward.
A)becomes vertical.
B)has a slope of zero.
C)shifts inward.
D)shifts outward.
فتح الحزمة
افتح القفل للوصول البطاقات البالغ عددها 131 في هذه المجموعة.
فتح الحزمة
k this deck
16
In the United Kingdom, worries about Brexit have caused consumer confidence to fall. Holding everything else equal, this could lead to _____ in the UK economy.
A)excess demand
B)demand-pull inflation
C)insufficient demand
D)a shortage
A)excess demand
B)demand-pull inflation
C)insufficient demand
D)a shortage
فتح الحزمة
افتح القفل للوصول البطاقات البالغ عددها 131 في هذه المجموعة.
فتح الحزمة
k this deck
17
Leading economic pundits predict inflation. Businesses believe these forecasts and raise prices accordingly. This scenario describes:
A)how positive output gaps create inflation.
B)demand-pull inflation.
C)how credible inflation expectations create inflation.
D)a situation where inflation expectations are higher than actual inflation.
A)how positive output gaps create inflation.
B)demand-pull inflation.
C)how credible inflation expectations create inflation.
D)a situation where inflation expectations are higher than actual inflation.
فتح الحزمة
افتح القفل للوصول البطاقات البالغ عددها 131 في هذه المجموعة.
فتح الحزمة
k this deck
18
Cost-push inflation is inflation that arises from an unexpected:
A)rise in production costs.
B)fall in production costs.
C)fall in demand.
D)rise in unemployment.
A)rise in production costs.
B)fall in production costs.
C)fall in demand.
D)rise in unemployment.
فتح الحزمة
افتح القفل للوصول البطاقات البالغ عددها 131 في هذه المجموعة.
فتح الحزمة
k this deck
19
When the U.S. dollar depreciates, this makes foreign goods more expensive. As a result:
A)competitive pressure on U.S. businesses is increased, leading U.S. businesses to lower prices.
B)competitive pressure on U.S. businesses is released, leading some U.S. businesses to raise prices.
C)cost of inputs decrease for U.S. firms that use foreign-made inputs.
D)foreign buyers are now willing to pay less for American-made goods.
فتح الحزمة
افتح القفل للوصول البطاقات البالغ عددها 131 في هذه المجموعة.
فتح الحزمة
k this deck
20
Suppose aluminum prices rise in international markets. U.S. firms that import aluminum face higher marginal costs and raise prices. This scenario describes:
A)demand-pull inflation.
B)cost-push inflation.
C)a decrease in potential output.
D)a positive supply shock.
A)demand-pull inflation.
B)cost-push inflation.
C)a decrease in potential output.
D)a positive supply shock.
فتح الحزمة
افتح القفل للوصول البطاقات البالغ عددها 131 في هذه المجموعة.
فتح الحزمة
k this deck
21
Suppose rubber prices rise in international markets. For countries that import rubber, this scenario would lead to:
A)cost-push inflation.
B)demand-pull inflation.
C)an increase in potential output.
D)a positive supply shock.
A)cost-push inflation.
B)demand-pull inflation.
C)an increase in potential output.
D)a positive supply shock.
فتح الحزمة
افتح القفل للوصول البطاقات البالغ عددها 131 في هذه المجموعة.
فتح الحزمة
k this deck
22
A negative supply shock causes:
A)a surplus in consumer markets.
B)demand-pull inflation.
C)a decrease in unexpected inflation.
D)cost-push inflation.
A)a surplus in consumer markets.
B)demand-pull inflation.
C)a decrease in unexpected inflation.
D)cost-push inflation.
فتح الحزمة
افتح القفل للوصول البطاقات البالغ عددها 131 في هذه المجموعة.
فتح الحزمة
k this deck
23
If the Canadian dollar appreciates, this makes foreign goods cheaper for Canadians. As a result:
A)competitive pressure on Canadian businesses is increased, leading Canadian businesses to lower prices.
B)competitive pressure on Canadian businesses is released, leading some Canadian businesses to raise prices.
C)cost of inputs increase for Canadian businesses that use foreign-made inputs.
D)foreign buyers are now willing to pay more for Canadian goods.
فتح الحزمة
افتح القفل للوصول البطاقات البالغ عددها 131 في هذه المجموعة.
فتح الحزمة
k this deck
24
Inflation arises due to:
A)changes in real output, changes in nominal output, and changes in the unemployment rate.
B)inflation expectations, potential output, and the non-accelerating inflation rate of unemployment (NAIRU).
C)inflation expectations, demand-pull inflation, and cost-push inflation.
D)the negative output gap, the positive output gap, and unexpected inflation.
فتح الحزمة
افتح القفل للوصول البطاقات البالغ عددها 131 في هذه المجموعة.
فتح الحزمة
k this deck
25
When a competitive business sets prices, it takes into account:
(i) marginal costs.
(ii) competitive prices.
(iii) prices from two decades back.
(iv) monopoly prices.
A)(i) only
B)(i) and (ii)
C)(i), (ii), and (iv)
D)(ii) and (iv)
(i) marginal costs.
(ii) competitive prices.
(iii) prices from two decades back.
(iv) monopoly prices.
A)(i) only
B)(i) and (ii)
C)(i), (ii), and (iv)
D)(ii) and (iv)
فتح الحزمة
افتح القفل للوصول البطاقات البالغ عددها 131 في هذه المجموعة.
فتح الحزمة
k this deck
26
The Treasury inflation-protected security (TIPS) is a bond with a principal value that fluctuates relative to changes in the consumer price index. The interest on the bond is calculated on the adjusted principal. This instrument has an advantage over a regular bond because it:
A)has a real return that is zero.
B)protects the saver against inflation.
C)has a return that matches the economic growth rate.
D)protects the saver against supply-side shocks.
A)has a real return that is zero.
B)protects the saver against inflation.
C)has a return that matches the economic growth rate.
D)protects the saver against supply-side shocks.
فتح الحزمة
افتح القفل للوصول البطاقات البالغ عددها 131 في هذه المجموعة.
فتح الحزمة
k this deck
27
If managers expect the inflation rate to continue over time, they have _____ expectations.
A)adaptive
B)anchored
C)zero
D)rational
A)adaptive
B)anchored
C)zero
D)rational
فتح الحزمة
افتح القفل للوصول البطاقات البالغ عددها 131 في هذه المجموعة.
فتح الحزمة
k this deck
28
If managers expect inflation to approach the Federal Reserve's target, they have _____ expectations.
A)adaptive
B)anchored
C)zero
D)rational
A)adaptive
B)anchored
C)zero
D)rational
فتح الحزمة
افتح القفل للوصول البطاقات البالغ عددها 131 في هذه المجموعة.
فتح الحزمة
k this deck
29
If managers use strong macroeconomic knowledge and good forecasts to build their inflation expectations, they have _____ expectations.
A)adaptive
B)anchored
C)aero
D)rational
A)adaptive
B)anchored
C)aero
D)rational
فتح الحزمة
افتح القفل للوصول البطاقات البالغ عددها 131 في هذه المجموعة.
فتح الحزمة
k this deck
30
The figure shows inflation from 2009 to 2018 for countries in the Organization for Economic Cooperation and Development (OECD). The country with the highest inflation rate was:
A)Switzerland.
B)Argentina.
C)Turkey.
D)Italy.
A)Switzerland.
B)Argentina.
C)Turkey.
D)Italy.
فتح الحزمة
افتح القفل للوصول البطاقات البالغ عددها 131 في هذه المجموعة.
فتح الحزمة
k this deck
31
The figure shows inflation from 2009 to 2018 for countries in the Organization for Economic Cooperation and Development (OECD). The country with the lowest inflation rate was:
A)Japan.
B)Argentina.
C)Turkey.
D)Italy.
A)Japan.
B)Argentina.
C)Turkey.
D)Italy.
فتح الحزمة
افتح القفل للوصول البطاقات البالغ عددها 131 في هذه المجموعة.
فتح الحزمة
k this deck
32
The figure shows inflation from 2009 to 2018 for countries in the Organization for Economic Cooperation and Development (OECD). The country with the second-highest inflation rate was:
A)Switzerland.
B)Argentina.
C)Russia.
D)Italy.
A)Switzerland.
B)Argentina.
C)Russia.
D)Italy.
فتح الحزمة
افتح القفل للوصول البطاقات البالغ عددها 131 في هذه المجموعة.
فتح الحزمة
k this deck
33
The figure shows inflation expectations for U.S. consumers over time. In which time period did consumers expect the highest inflation rates?
A)late 1990s
B)early 1990s
C)late 1970s
D)early 2000s
A)late 1990s
B)early 1990s
C)late 1970s
D)early 2000s
فتح الحزمة
افتح القفل للوصول البطاقات البالغ عددها 131 في هذه المجموعة.
فتح الحزمة
k this deck
34
The figure shows inflation expectations and actual inflation for U.S. consumers over time. Which of the following statements correctly describes the relationship between these rates?
A)Actual inflation and inflation expectations seem to behave independently.
B)Actual inflation and inflation expectations are exactly the same over time.
C)Actual inflation tends to follow inflation expectations.
D)Actual inflation and inflation expectations have an inverse relationship.
A)Actual inflation and inflation expectations seem to behave independently.
B)Actual inflation and inflation expectations are exactly the same over time.
C)Actual inflation tends to follow inflation expectations.
D)Actual inflation and inflation expectations have an inverse relationship.
فتح الحزمة
افتح القفل للوصول البطاقات البالغ عددها 131 في هذه المجموعة.
فتح الحزمة
k this deck
35
When output exceeds potential output:
(i) there is excess demand.
(ii) demand-pull inflation occurs.
(iii) the output gap becomes negative.
(iv) the output gap becomes positive.
A)(i) only
B)(ii) and (iv)
C)(iii) only
D)(i), (ii), and (iv)
(i) there is excess demand.
(ii) demand-pull inflation occurs.
(iii) the output gap becomes negative.
(iv) the output gap becomes positive.
A)(i) only
B)(ii) and (iv)
C)(iii) only
D)(i), (ii), and (iv)
فتح الحزمة
افتح القفل للوصول البطاقات البالغ عددها 131 في هذه المجموعة.
فتح الحزمة
k this deck
36
When output is less than potential output:
(i) there is insufficient demand.
(ii) demand-pull inflation occurs.
(iii) the output gap becomes negative.
(iv) the output gap becomes positive.
A)(i) only
B)(ii) and (iv)
C)(i) and (iii)
D)(i), (ii), and (iv)
(i) there is insufficient demand.
(ii) demand-pull inflation occurs.
(iii) the output gap becomes negative.
(iv) the output gap becomes positive.
A)(i) only
B)(ii) and (iv)
C)(i) and (iii)
D)(i), (ii), and (iv)
فتح الحزمة
افتح القفل للوصول البطاقات البالغ عددها 131 في هذه المجموعة.
فتح الحزمة
k this deck
37
If expected inflation is 3% and actual inflation is 4.2%, then unexpected inflation is:
A)3.0%.
B)4.2%.
C)7.2%.
D)1.2%.
A)3.0%.
B)4.2%.
C)7.2%.
D)1.2%.
فتح الحزمة
افتح القفل للوصول البطاقات البالغ عددها 131 في هذه المجموعة.
فتح الحزمة
k this deck
38
If expected inflation is 2%, and actual inflation is 2.8%, then unexpected inflation is:
A)2.8%.
B)2.0%.
C)0.8%.
D)4.8%.
A)2.8%.
B)2.0%.
C)0.8%.
D)4.8%.
فتح الحزمة
افتح القفل للوصول البطاقات البالغ عددها 131 في هذه المجموعة.
فتح الحزمة
k this deck
39
If expected inflation is 1.75% and actual inflation is 2.30%, then unexpected inflation is:
A)4.05%.
B)2.30%.
C)1.75%.
D)0.55%.
A)4.05%.
B)2.30%.
C)1.75%.
D)0.55%.
فتح الحزمة
افتح القفل للوصول البطاقات البالغ عددها 131 في هذه المجموعة.
فتح الحزمة
k this deck
40
Forecasts expect inflation to be 2%. Actual inflation ends up being 1.75%. Holding all else equal, if there is no supply-side change in the economy, these statistics indicate there is:
A)currency depreciation.
B)excess demand.
C)demand-pull inflation.
D)insufficient demand.
A)currency depreciation.
B)excess demand.
C)demand-pull inflation.
D)insufficient demand.
فتح الحزمة
افتح القفل للوصول البطاقات البالغ عددها 131 في هذه المجموعة.
فتح الحزمة
k this deck
41
Forecasts expect inflation to be 2%. Actual inflation ends up being 1.75%. Holding all else equal, if there is no supply-side change in the economy, these statistics indicate inflation is ____ less than expected.
A)3.75%
B)0.25%
C)1.75%
D)2.0%
A)3.75%
B)0.25%
C)1.75%
D)2.0%
فتح الحزمة
افتح القفل للوصول البطاقات البالغ عددها 131 في هذه المجموعة.
فتح الحزمة
k this deck
42
Why do the unexpected inflation and output gap axes need to extend into the negative regions in the Phillips curve diagram?
A)Both output gaps and unexpected inflation can be negative or positive.
B)Both output gaps and unexpected inflation always begin by being negative.
C)Negative inflation gaps are very common.
D)Negative output gaps are very common.
A)Both output gaps and unexpected inflation can be negative or positive.
B)Both output gaps and unexpected inflation always begin by being negative.
C)Negative inflation gaps are very common.
D)Negative output gaps are very common.
فتح الحزمة
افتح القفل للوصول البطاقات البالغ عددها 131 في هذه المجموعة.
فتح الحزمة
k this deck
43
What is measured on the vertical axis on the Phillips curve diagram?
A)the price level
B)unexpected inflation
C)the output gap
D)real GDP
A)the price level
B)unexpected inflation
C)the output gap
D)real GDP
فتح الحزمة
افتح القفل للوصول البطاقات البالغ عددها 131 في هذه المجموعة.
فتح الحزمة
k this deck
44
What is measured on the horizontal axis on the Phillips curve diagram?
A)unexpected inflation
B)the output gap
C)the price level
D)real GDP
A)unexpected inflation
B)the output gap
C)the price level
D)real GDP
فتح الحزمة
افتح القفل للوصول البطاقات البالغ عددها 131 في هذه المجموعة.
فتح الحزمة
k this deck
45
The Phillips curve is upward-sloping because:
A)when prices rise, quantity supplied rises.
B)the more positive the output gap, the higher inflation rises above expected inflation.
C)the more positive the output gap, the lower inflation is when compared to expected inflation.
D)higher unemployment is not related to unexpected inflation.
A)when prices rise, quantity supplied rises.
B)the more positive the output gap, the higher inflation rises above expected inflation.
C)the more positive the output gap, the lower inflation is when compared to expected inflation.
D)higher unemployment is not related to unexpected inflation.
فتح الحزمة
افتح القفل للوصول البطاقات البالغ عددها 131 في هذه المجموعة.
فتح الحزمة
k this deck
46
Consider the Phillips curve shown here. In region A:
A)inflation falls below expected inflation.
B)inflation rises above expected inflation.
C)there is excess demand.
D)the output gap is positive.
A)inflation falls below expected inflation.
B)inflation rises above expected inflation.
C)there is excess demand.
D)the output gap is positive.
فتح الحزمة
افتح القفل للوصول البطاقات البالغ عددها 131 في هذه المجموعة.
فتح الحزمة
k this deck
47
Consider the Phillips curve shown here. In region A:
A)inflation equals expected inflation.
B)inflation rises above expected inflation.
C)there is insufficient demand.
D)the output gap is positive.
A)inflation equals expected inflation.
B)inflation rises above expected inflation.
C)there is insufficient demand.
D)the output gap is positive.
فتح الحزمة
افتح القفل للوصول البطاقات البالغ عددها 131 في هذه المجموعة.
فتح الحزمة
k this deck
48
Consider the Phillips curve shown here. In region A:
A)inflation equals expected inflation.
B)inflation rises above expected inflation.
C)there is excess demand.
D)the output gap is negative.
A)inflation equals expected inflation.
B)inflation rises above expected inflation.
C)there is excess demand.
D)the output gap is negative.
فتح الحزمة
افتح القفل للوصول البطاقات البالغ عددها 131 في هذه المجموعة.
فتح الحزمة
k this deck
49
Consider the Phillips curve shown here. In region B:
A)inflation equals expected inflation.
B)inflation rises above expected inflation.
C)there is insufficient demand.
D)the output gap is negative.
A)inflation equals expected inflation.
B)inflation rises above expected inflation.
C)there is insufficient demand.
D)the output gap is negative.
فتح الحزمة
افتح القفل للوصول البطاقات البالغ عددها 131 في هذه المجموعة.
فتح الحزمة
k this deck
50
Consider the Phillips curve shown here. In region B:
A)there is excess demand.
B)inflation falls below expected inflation.
C)there is insufficient demand.
D)the output gap is negative.
A)there is excess demand.
B)inflation falls below expected inflation.
C)there is insufficient demand.
D)the output gap is negative.
فتح الحزمة
افتح القفل للوصول البطاقات البالغ عددها 131 في هذه المجموعة.
فتح الحزمة
k this deck
51
Consider the Phillips curve shown here. In region B:
A)there is insufficient demand.
B)inflation falls below expected inflation.
C)the output gap is positive.
D)the output gap is negative.
A)there is insufficient demand.
B)inflation falls below expected inflation.
C)the output gap is positive.
D)the output gap is negative.
فتح الحزمة
افتح القفل للوصول البطاقات البالغ عددها 131 في هذه المجموعة.
فتح الحزمة
k this deck
52
Suppose that in a given country, the line of best fit approximates the Phillips curve shown here. When the output gap is -4%:
A)there is excess demand.
B)inflation rises above expected inflation.
C)the output gap is positive.
D)the output gap is negative.
A)there is excess demand.
B)inflation rises above expected inflation.
C)the output gap is positive.
D)the output gap is negative.
فتح الحزمة
افتح القفل للوصول البطاقات البالغ عددها 131 في هذه المجموعة.
فتح الحزمة
k this deck
53
Suppose that in a given country, the line of best fit approximates the Phillips curve shown here. When the output gap is 4%:
A)there is insufficient demand.
B)inflation falls below expected inflation.
C)the output gap is positive.
D)the output gap is negative.
A)there is insufficient demand.
B)inflation falls below expected inflation.
C)the output gap is positive.
D)the output gap is negative.
فتح الحزمة
افتح القفل للوصول البطاقات البالغ عددها 131 في هذه المجموعة.
فتح الحزمة
k this deck
54
Suppose that in a given country, the line of best fit approximates the Phillips curve shown here. When the output gap is 4%:
A)there is insufficient demand.
B)inflation rises above expected inflation.
C)unexpected inflation is zero.
D)the output gap is negative.
A)there is insufficient demand.
B)inflation rises above expected inflation.
C)unexpected inflation is zero.
D)the output gap is negative.
فتح الحزمة
افتح القفل للوصول البطاقات البالغ عددها 131 في هذه المجموعة.
فتح الحزمة
k this deck
55
Suppose that in a given country, the line of best fit approximates the Phillips curve shown here. Next year, you expect GDP to be 3% above potential GDP. What is your forecast for unexpected inflation?
A)1%
B)0%
C)3%
D)-1%
A)1%
B)0%
C)3%
D)-1%
فتح الحزمة
افتح القفل للوصول البطاقات البالغ عددها 131 في هذه المجموعة.
فتح الحزمة
k this deck
56
Suppose that in a given country, the line of best fit approximates the Phillips curve shown here. Next year, you expect GDP to be 3% below potential GDP. What is your forecast for unexpected inflation?
A)1%
B)0%
C)3%
D)-1%
A)1%
B)0%
C)3%
D)-1%
فتح الحزمة
افتح القفل للوصول البطاقات البالغ عددها 131 في هذه المجموعة.
فتح الحزمة
k this deck
57
Suppose that in a given country, the line of best fit approximates the Phillips curve shown here. Next year, you expect GDP to be equal to potential GDP. What is your forecast for unexpected inflation?
A)1%
B)0%
C)3%
D)-1%
A)1%
B)0%
C)3%
D)-1%
فتح الحزمة
افتح القفل للوصول البطاقات البالغ عددها 131 في هذه المجموعة.
فتح الحزمة
k this deck
58
Suppose that in a given country, the line of best fit approximates the Phillips curve shown here. Next year, you expect GDP to be 3% above potential GDP. Current inflation expectations are at 2%. How much does your salary have to change, in nominal terms, in order to maintain your purchasing power?
A)3%
B)2%
C)1%
D)4%
A)3%
B)2%
C)1%
D)4%
فتح الحزمة
افتح القفل للوصول البطاقات البالغ عددها 131 في هذه المجموعة.
فتح الحزمة
k this deck
59
Suppose that in a given country, the line of best fit approximates the Phillips curve shown here. Suppose for next year, you expect GDP to be 3% below potential GDP. Current inflation expectations are at 2%. How much does your salary have to change, in nominal terms, in order to maintain your purchasing power?
A)3%
B)2%
C)1%
D)4%
A)3%
B)2%
C)1%
D)4%
فتح الحزمة
افتح القفل للوصول البطاقات البالغ عددها 131 في هذه المجموعة.
فتح الحزمة
k this deck
60
Suppose that in a given country, the line of best fit approximates the Phillips curve shown here. Suppose for next year, you expect GDP to be equal to potential GDP. Current inflation expectations are at 2%. How much does your salary have to change, in nominal terms, in order to maintain your purchasing power at the current level?
A)3%
B)2%
C)1%
D)4%
A)3%
B)2%
C)1%
D)4%
فتح الحزمة
افتح القفل للوصول البطاقات البالغ عددها 131 في هذه المجموعة.
فتح الحزمة
k this deck
61
Historical data for the United States has shown a 5% rise in the output gap to correspond to about _____ increase in unexpected inflation.
A)8%
B)3%
C)1%
D)5%
A)8%
B)3%
C)1%
D)5%
فتح الحزمة
افتح القفل للوصول البطاقات البالغ عددها 131 في هذه المجموعة.
فتح الحزمة
k this deck
62
Using the Phillips curve to forecast future inflation involves which two steps?
A)Assess inflation expectations, and then forecast unexpected inflation.
B)Fix inflation expectations, and then calculate the difference from actual inflation.
C)Use adaptive expectations, and then use anchored expectations.
D)Calculate a trend based on past inflation, and then add 2%.
A)Assess inflation expectations, and then forecast unexpected inflation.
B)Fix inflation expectations, and then calculate the difference from actual inflation.
C)Use adaptive expectations, and then use anchored expectations.
D)Calculate a trend based on past inflation, and then add 2%.
فتح الحزمة
افتح القفل للوصول البطاقات البالغ عددها 131 في هذه المجموعة.
فتح الحزمة
k this deck
63
High unemployment occurs when:
A)there is insufficient demand.
B)inflation rises above inflation expectations.
C)the output gap is positive.
D)the output gap is equal to zero.
A)there is insufficient demand.
B)inflation rises above inflation expectations.
C)the output gap is positive.
D)the output gap is equal to zero.
فتح الحزمة
افتح القفل للوصول البطاقات البالغ عددها 131 في هذه المجموعة.
فتح الحزمة
k this deck
64
High unemployment occurs when:
A)there is excess demand.
B)inflation rises above inflation expectations.
C)the output gap is negative.
D)the output gap is equal to zero.
A)there is excess demand.
B)inflation rises above inflation expectations.
C)the output gap is negative.
D)the output gap is equal to zero.
فتح الحزمة
افتح القفل للوصول البطاقات البالغ عددها 131 في هذه المجموعة.
فتح الحزمة
k this deck
65
Unemployment will rise when:
A)there is excess demand.
B)inflation falls below inflation expectations.
C)the output gap is positive.
D)the output gap is equal to zero.
A)there is excess demand.
B)inflation falls below inflation expectations.
C)the output gap is positive.
D)the output gap is equal to zero.
فتح الحزمة
افتح القفل للوصول البطاقات البالغ عددها 131 في هذه المجموعة.
فتح الحزمة
k this deck
66
Which of these choices is correct? Holding all else equal, assuming no supply-side shock, the:
A)lower the unemployment rate, the higher the unexpected inflation.
B)lower the unemployment rate, the lower the unexpected inflation.
C)higher the unemployment rate, the higher the unexpected inflation.
D)more positive the output gap, the higher the unemployment rate.
A)lower the unemployment rate, the higher the unexpected inflation.
B)lower the unemployment rate, the lower the unexpected inflation.
C)higher the unemployment rate, the higher the unexpected inflation.
D)more positive the output gap, the higher the unemployment rate.
فتح الحزمة
افتح القفل للوصول البطاقات البالغ عددها 131 في هذه المجموعة.
فتح الحزمة
k this deck
67
Which of the graphs shows the correct shape of the labor market Phillips curve?
A)
B)
C)
D)
A)
B)
C)
D)
فتح الحزمة
افتح القفل للوصول البطاقات البالغ عددها 131 في هذه المجموعة.
فتح الحزمة
k this deck
68
When unexpected inflation is zero, the corresponding unemployment rate is the _____ unemployment rate.
A)zero
B)minimum
C)equilibrium
D)maximum
A)zero
B)minimum
C)equilibrium
D)maximum
فتح الحزمة
افتح القفل للوصول البطاقات البالغ عددها 131 في هذه المجموعة.
فتح الحزمة
k this deck
69
When unexpected inflation is zero, the corresponding unemployment rate is the:
A)cyclical unemployment rate.
B)non-accelerating rate of inflation.
C)nonequilibrium unemployment rate.
D)non-accelerating inflation rate of unemployment (NAIRU).
A)cyclical unemployment rate.
B)non-accelerating rate of inflation.
C)nonequilibrium unemployment rate.
D)non-accelerating inflation rate of unemployment (NAIRU).
فتح الحزمة
افتح القفل للوصول البطاقات البالغ عددها 131 في هذه المجموعة.
فتح الحزمة
k this deck
70
When unexpected inflation is zero, the corresponding unemployment rate is not zero because:
A)cyclical unemployment is high and positive.
B)the output gap is negative.
C)the output gap is positive.
D)structural unemployment and frictional unemployment are not zero.
A)cyclical unemployment is high and positive.
B)the output gap is negative.
C)the output gap is positive.
D)structural unemployment and frictional unemployment are not zero.
فتح الحزمة
افتح القفل للوصول البطاقات البالغ عددها 131 في هذه المجموعة.
فتح الحزمة
k this deck
71
When the economy is at potential GDP, the unexpected inflation rate is _____, and the unemployment rate is equal to _____.
A)zero; potential output
B)2%; cyclical
C)zero; the natural rate of unemployment
D)2%; the non-accelerating inflation rate of unemployment (NAIRU)
A)zero; potential output
B)2%; cyclical
C)zero; the natural rate of unemployment
D)2%; the non-accelerating inflation rate of unemployment (NAIRU)
فتح الحزمة
افتح القفل للوصول البطاقات البالغ عددها 131 في هذه المجموعة.
فتح الحزمة
k this deck
72
Suppose that the euro depreciates. Which figure shows the effect on the Phillips curve in Germany?
A)
B)
C)
D)
A)
B)
C)
D)
فتح الحزمة
افتح القفل للوصول البطاقات البالغ عددها 131 في هذه المجموعة.
فتح الحزمة
k this deck
73
Suppose that the U.S. dollar appreciates. Which figure shows the effect on the Phillips curve in the United States?
A)
B)
C)
D)
A)
B)
C)
D)
فتح الحزمة
افتح القفل للوصول البطاقات البالغ عددها 131 في هذه المجموعة.
فتح الحزمة
k this deck
74
Suppose that the Indian rupee loses value against the U.S. dollar. Which figure shows the effect on the Phillips curve in India?
A)
B)
C)
D)
A)
B)
C)
D)
فتح الحزمة
افتح القفل للوصول البطاقات البالغ عددها 131 في هذه المجموعة.
فتح الحزمة
k this deck
75
Canada is the world's largest exporter of sawn wood, which is used as an input in products produced by other countries. Cutbacks at Canadian lumber factories caused a rise in lumber prices. How does this affect the Phillips curve in China?
A)
B)
C)
D)
A)
B)
C)
D)
فتح الحزمة
افتح القفل للوصول البطاقات البالغ عددها 131 في هذه المجموعة.
فتح الحزمة
k this deck
76
The use of automated harvesting machines greatly increased productivity in farming. How does this affect the Phillips curve for an economy where agriculture is a significant part of GDP?
A)
B)
C)
D)
A)
B)
C)
D)
فتح الحزمة
افتح القفل للوصول البطاقات البالغ عددها 131 في هذه المجموعة.
فتح الحزمة
k this deck
77
If robots replace workers on the production lines, what do we expect would happen to the Phillips curve?
A)
B)
C)
D)
A)
B)
C)
D)
فتح الحزمة
افتح القفل للوصول البطاقات البالغ عددها 131 في هذه المجموعة.
فتح الحزمة
k this deck
78
Suppose the Chinese economy is experiencing significant excess demand. Which figure shows the effect on the Phillips curve in China?
A)
B)
C)
D)
A)
B)
C)
D)
فتح الحزمة
افتح القفل للوصول البطاقات البالغ عددها 131 في هذه المجموعة.
فتح الحزمة
k this deck
79
Suppose the Kenyan markets are experiencing insufficient demand. Which figure shows the effect on the Phillips curve in Kenya?
A)
B)
C)
D)
A)
B)
C)
D)
فتح الحزمة
افتح القفل للوصول البطاقات البالغ عددها 131 في هذه المجموعة.
فتح الحزمة
k this deck
80
The output gap becomes negative in Bangladesh. Which figure shows the effect on the Phillips curve in Bangladesh?
A)
B)
C)
D)
A)
B)
C)
D)
فتح الحزمة
افتح القفل للوصول البطاقات البالغ عددها 131 في هذه المجموعة.
فتح الحزمة
k this deck
فتح الحزمة
افتح القفل للوصول البطاقات البالغ عددها 131 في هذه المجموعة.


