Deck 29: Business Cycles
ملء الشاشة (f)
سؤال
سؤال
سؤال
سؤال
سؤال
سؤال
سؤال
سؤال
سؤال
سؤال
سؤال
سؤال
سؤال
سؤال
سؤال
سؤال
سؤال
سؤال
Refer to the data dashboard shown. Which indicator directly tells you how the labor market is doing?

A)Consumer confidence
B)Real GDI
C)Initial unemployment claims
D)Nonfarm payrolls
A)Consumer confidence
B)Real GDI
C)Initial unemployment claims
D)Nonfarm payrolls
سؤال
Refer to the data dashboard shown. Which indicator is a lagging indicator?

A)Consumer confidence
B)Business confidence
C)Unemployment rate
D)Stock prices: S&P 500
A)Consumer confidence
B)Business confidence
C)Unemployment rate
D)Stock prices: S&P 500
سؤال
Refer to the data dashboard shown. Which of the following is an indicator of excess capacity?

A)Consumer confidence
B)Inflation
C)Business confidence
D)Unemployment rate
A)Consumer confidence
B)Inflation
C)Business confidence
D)Unemployment rate
سؤال
Refer to the data dashboard shown. Which indicator tells you what managers are planning?

A)Consumer confidence
B)Inflation
C)Business confidence
D)Unemployment rate
A)Consumer confidence
B)Inflation
C)Business confidence
D)Unemployment rate
سؤال
Refer to the data dashboard shown. Which indicator is a cross-check on GDP?

A)Employment cost index
B)Real GDI
C)Business confidence
D)Stock prices: S&P 500
A)Employment cost index
B)Real GDI
C)Business confidence
D)Stock prices: S&P 500
سؤال
Refer to the data dashboard shown. Which indicator tells you how fast wages and benefits are rising?
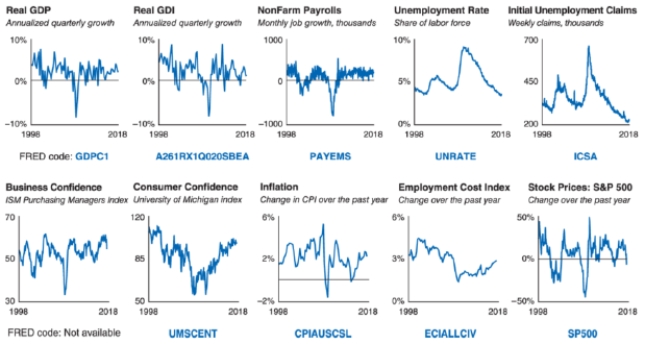
A)Employment cost index
B)Inflation
C)Business confidence
D)Stock prices: S&P 500
A)Employment cost index
B)Inflation
C)Business confidence
D)Stock prices: S&P 500
سؤال
سؤال
سؤال
سؤال
سؤال
سؤال
سؤال
سؤال
سؤال
سؤال
سؤال
سؤال
سؤال
سؤال
سؤال
سؤال
سؤال
سؤال
سؤال
سؤال
سؤال
سؤال
سؤال
سؤال
سؤال
سؤال
سؤال
سؤال
سؤال
سؤال
سؤال
سؤال
سؤال
سؤال
سؤال
سؤال
سؤال
سؤال
سؤال
سؤال
سؤال
سؤال
سؤال
سؤال
سؤال
سؤال
سؤال
سؤال
سؤال
سؤال
سؤال
سؤال
سؤال
سؤال
سؤال
سؤال
سؤال

فتح الحزمة
قم بالتسجيل لفتح البطاقات في هذه المجموعة!
Unlock Deck
Unlock Deck
1/149
العب
ملء الشاشة (f)
Deck 29: Business Cycles
1
The business cycle refers to the:
A)rise and fall of business revenues over time.
B)long-term trends in economic growth.
C)increases in GDP above potential GDP.
D)short-term fluctuations in economic activity.
A)rise and fall of business revenues over time.
B)long-term trends in economic growth.
C)increases in GDP above potential GDP.
D)short-term fluctuations in economic activity.
D
2
An economy's potential output level is:
A)the output when unemployment is zero.
B)equivalent of the GDP at current market value.
C)the level at which no resources are available in the economy.
D)the output that is possible when all resources are fully employed.
A)the output when unemployment is zero.
B)equivalent of the GDP at current market value.
C)the level at which no resources are available in the economy.
D)the output that is possible when all resources are fully employed.
D
3
Which of the following correctly describes the business cycle?
A)It is the fluctuations of GDP around the potential output.
B)It is the constant rise in GDP over time.
C)It refers to ups and downs in business revenue during expansions and recessions.
D)It refers to excess unemployment during recessionary periods.
A)It is the fluctuations of GDP around the potential output.
B)It is the constant rise in GDP over time.
C)It refers to ups and downs in business revenue during expansions and recessions.
D)It refers to excess unemployment during recessionary periods.
A
4
The four stages of the business cycle are:
A)expansion, growth, contraction, and depression.
B)peak, recession, trough, and expansion.
C)consumption, investment, government expenditure, and net exports.
D)full employment, potential GDP, recessionary gap, and inflationary gap.
A)expansion, growth, contraction, and depression.
B)peak, recession, trough, and expansion.
C)consumption, investment, government expenditure, and net exports.
D)full employment, potential GDP, recessionary gap, and inflationary gap.
فتح الحزمة
افتح القفل للوصول البطاقات البالغ عددها 149 في هذه المجموعة.
فتح الحزمة
k this deck
5
How many stages are in the business cycle?
A)Five
B)Between three and eight, depending on severity
C)Four
D)Six
A)Five
B)Between three and eight, depending on severity
C)Four
D)Six
فتح الحزمة
افتح القفل للوصول البطاقات البالغ عددها 149 في هذه المجموعة.
فتح الحزمة
k this deck
6
To say that business cycles are persistent means that:
A)they typically have short and sharp recessions, followed by long and gradual expansions.
B)they usually last over 20 years.
C)current conditions typically continue in the near future.
D)growth rates in a cycle will always be higher than growth rates in the previous cycle.
A)they typically have short and sharp recessions, followed by long and gradual expansions.
B)they usually last over 20 years.
C)current conditions typically continue in the near future.
D)growth rates in a cycle will always be higher than growth rates in the previous cycle.
فتح الحزمة
افتح القفل للوصول البطاقات البالغ عددها 149 في هذه المجموعة.
فتح الحزمة
k this deck
7
Typically, business cycles:
A)have short and sharp recessions, followed by long and gradual expansions.
B)last over 20 years.
C)do not display persistence.
D)have short and sharp expansions, followed by long and gradual recessions.
A)have short and sharp recessions, followed by long and gradual expansions.
B)last over 20 years.
C)do not display persistence.
D)have short and sharp expansions, followed by long and gradual recessions.
فتح الحزمة
افتح القفل للوصول البطاقات البالغ عددها 149 في هذه المجموعة.
فتح الحزمة
k this deck
8
Which of the following stages of the business cycle is most preferable when you graduate from college and begin looking for a job?
A)Expansion
B)Trough
C)Contraction
D)Recession
A)Expansion
B)Trough
C)Contraction
D)Recession
فتح الحزمة
افتح القفل للوصول البطاقات البالغ عددها 149 في هذه المجموعة.
فتح الحزمة
k this deck
9
Which of the following indicators will probably rise when the economy is in a recession?
A)Real GDP growth
B)Unemployment
C)Industrial production
D)Real retail sales
A)Real GDP growth
B)Unemployment
C)Industrial production
D)Real retail sales
فتح الحزمة
افتح القفل للوصول البطاقات البالغ عددها 149 في هذه المجموعة.
فتح الحزمة
k this deck
10
Which of the following will probably rise when the economy is in a recession?
A)Real GDP growth
B)Employment
C)Initial unemployment claims
D)Real retail sales
A)Real GDP growth
B)Employment
C)Initial unemployment claims
D)Real retail sales
فتح الحزمة
افتح القفل للوصول البطاقات البالغ عددها 149 في هذه المجموعة.
فتح الحزمة
k this deck
11
Which of the following will rise when the economy is expanding?
A)Real GDP growth
B)Unemployment
C)Initial unemployment claims
D)Equilibrium unemployment rate
A)Real GDP growth
B)Unemployment
C)Initial unemployment claims
D)Equilibrium unemployment rate
فتح الحزمة
افتح القفل للوصول البطاقات البالغ عددها 149 في هذه المجموعة.
فتح الحزمة
k this deck
12
Which of the following will rise when the economy is expanding?
A)Applications for unemployment benefits
B)Unemployment across the economy
C)State-level unemployment
D)Industrial production
A)Applications for unemployment benefits
B)Unemployment across the economy
C)State-level unemployment
D)Industrial production
فتح الحزمة
افتح القفل للوصول البطاقات البالغ عددها 149 في هذه المجموعة.
فتح الحزمة
k this deck
13
Which of the following will fall when the economy is expanding?
A)Applications for unemployment benefits
B)Business confidence
C)Consumer confidence
D)Nonfarm payrolls
A)Applications for unemployment benefits
B)Business confidence
C)Consumer confidence
D)Nonfarm payrolls
فتح الحزمة
افتح القفل للوصول البطاقات البالغ عددها 149 في هذه المجموعة.
فتح الحزمة
k this deck
14
Which of the following will rise when the economy is contracting?
A)Applications for unemployment benefits
B)Business confidence
C)Consumer confidence
D)Nonfarm payrolls
A)Applications for unemployment benefits
B)Business confidence
C)Consumer confidence
D)Nonfarm payrolls
فتح الحزمة
افتح القفل للوصول البطاقات البالغ عددها 149 في هذه المجموعة.
فتح الحزمة
k this deck
15
The broadest measure of economic activity is:
A)the stock market.
B)business confidence.
C)real GDP.
D)nonfarm payrolls.
A)the stock market.
B)business confidence.
C)real GDP.
D)nonfarm payrolls.
فتح الحزمة
افتح القفل للوصول البطاقات البالغ عددها 149 في هذه المجموعة.
فتح الحزمة
k this deck
16
Real GDP is calculated by:
A)adding total income to total expenditure.
B)counting the number of items produced in an economy.
C)subtracting national spending from national income.
D)adding all the spending in the economy.
A)adding total income to total expenditure.
B)counting the number of items produced in an economy.
C)subtracting national spending from national income.
D)adding all the spending in the economy.
فتح الحزمة
افتح القفل للوصول البطاقات البالغ عددها 149 في هذه المجموعة.
فتح الحزمة
k this deck
17
Nonfarm payroll is an important indicator because it tells you how _____ is doing.
A)farm production
B)the labor market
C)employment within the agricultural sector
D)consumer confidence
A)farm production
B)the labor market
C)employment within the agricultural sector
D)consumer confidence
فتح الحزمة
افتح القفل للوصول البطاقات البالغ عددها 149 في هذه المجموعة.
فتح الحزمة
k this deck
18
Refer to the data dashboard shown. Which indicator directly tells you how the labor market is doing?
A)Consumer confidence
B)Real GDI
C)Initial unemployment claims
D)Nonfarm payrolls
A)Consumer confidence
B)Real GDI
C)Initial unemployment claims
D)Nonfarm payrolls
فتح الحزمة
افتح القفل للوصول البطاقات البالغ عددها 149 في هذه المجموعة.
فتح الحزمة
k this deck
19
Refer to the data dashboard shown. Which indicator is a lagging indicator?
A)Consumer confidence
B)Business confidence
C)Unemployment rate
D)Stock prices: S&P 500
A)Consumer confidence
B)Business confidence
C)Unemployment rate
D)Stock prices: S&P 500
فتح الحزمة
افتح القفل للوصول البطاقات البالغ عددها 149 في هذه المجموعة.
فتح الحزمة
k this deck
20
Refer to the data dashboard shown. Which of the following is an indicator of excess capacity?
A)Consumer confidence
B)Inflation
C)Business confidence
D)Unemployment rate
A)Consumer confidence
B)Inflation
C)Business confidence
D)Unemployment rate
فتح الحزمة
افتح القفل للوصول البطاقات البالغ عددها 149 في هذه المجموعة.
فتح الحزمة
k this deck
21
Refer to the data dashboard shown. Which indicator tells you what managers are planning?
A)Consumer confidence
B)Inflation
C)Business confidence
D)Unemployment rate
A)Consumer confidence
B)Inflation
C)Business confidence
D)Unemployment rate
فتح الحزمة
افتح القفل للوصول البطاقات البالغ عددها 149 في هذه المجموعة.
فتح الحزمة
k this deck
22
Refer to the data dashboard shown. Which indicator is a cross-check on GDP?
A)Employment cost index
B)Real GDI
C)Business confidence
D)Stock prices: S&P 500
A)Employment cost index
B)Real GDI
C)Business confidence
D)Stock prices: S&P 500
فتح الحزمة
افتح القفل للوصول البطاقات البالغ عددها 149 في هذه المجموعة.
فتح الحزمة
k this deck
23
Refer to the data dashboard shown. Which indicator tells you how fast wages and benefits are rising?
A)Employment cost index
B)Inflation
C)Business confidence
D)Stock prices: S&P 500
A)Employment cost index
B)Inflation
C)Business confidence
D)Stock prices: S&P 500
فتح الحزمة
افتح القفل للوصول البطاقات البالغ عددها 149 في هذه المجموعة.
فتح الحزمة
k this deck
24
Why are broad indicators better than narrow indicators?
A)Narrow indicators are harder to measure than broad indicators.
B)Narrow indicators present economy-wide trends.
C)Broad indicators better capture economy-wide effects.
D)Narrow indicators present more refined forecasts.
A)Narrow indicators are harder to measure than broad indicators.
B)Narrow indicators present economy-wide trends.
C)Broad indicators better capture economy-wide effects.
D)Narrow indicators present more refined forecasts.
فتح الحزمة
افتح القفل للوصول البطاقات البالغ عددها 149 في هذه المجموعة.
فتح الحزمة
k this deck
25
Which of the following is a broad indicator?
A)The consumer price index
B)Agricultural sector output
C)Starbucks stock returns
D)Labor demand in the agricultural industry
A)The consumer price index
B)Agricultural sector output
C)Starbucks stock returns
D)Labor demand in the agricultural industry
فتح الحزمة
افتح القفل للوصول البطاقات البالغ عددها 149 في هذه المجموعة.
فتح الحزمة
k this deck
26
Which of the following is a broad indicator?
A)The price of imported avocados
B)Enrollment at your university
C)The unemployment rate
D)An index of technology use in farming
A)The price of imported avocados
B)Enrollment at your university
C)The unemployment rate
D)An index of technology use in farming
فتح الحزمة
افتح القفل للوصول البطاقات البالغ عددها 149 في هذه المجموعة.
فتح الحزمة
k this deck
27
Which of the following is a narrow indicator?
A)The consumer price index
B)The stock price for JPMorgan Chase & Co.
C)Non-farm payrolls
D)Real GDI
A)The consumer price index
B)The stock price for JPMorgan Chase & Co.
C)Non-farm payrolls
D)Real GDI
فتح الحزمة
افتح القفل للوصول البطاقات البالغ عددها 149 في هذه المجموعة.
فتح الحزمة
k this deck
28
Which of the following is a broad indicator?
A)Real gross domestic income
B)Agricultural sector output
C)Starbucks stock returns
D)Labor demand in the agricultural industry
A)Real gross domestic income
B)Agricultural sector output
C)Starbucks stock returns
D)Labor demand in the agricultural industry
فتح الحزمة
افتح القفل للوصول البطاقات البالغ عددها 149 في هذه المجموعة.
فتح الحزمة
k this deck
29
Suppose the equilibrium unemployment rate is 3.8%. Which of the following rates of unemployment would be most likely if the economy is in the trough of a recession?
A)2.85%
B)4.1%
C)3.8%
D)7.9%
A)2.85%
B)4.1%
C)3.8%
D)7.9%
فتح الحزمة
افتح القفل للوصول البطاقات البالغ عددها 149 في هذه المجموعة.
فتح الحزمة
k this deck
30
Suppose that an economy is in a recession. You would expect to see the unemployment rate:
A)rise above the equilibrium unemployment rate.
B)fall below the equilibrium unemployment rate.
C)be equal to the equilibrium unemployment rate.
D)be zero.
A)rise above the equilibrium unemployment rate.
B)fall below the equilibrium unemployment rate.
C)be equal to the equilibrium unemployment rate.
D)be zero.
فتح الحزمة
افتح القفل للوصول البطاقات البالغ عددها 149 في هذه المجموعة.
فتح الحزمة
k this deck
31
Suppose that an economy is overheating. You would expect to see the unemployment rate:
A)rise above the equilibrium unemployment rate.
B)fall below the equilibrium unemployment rate.
C)be equal to the equilibrium unemployment rate.
D)be zero.
A)rise above the equilibrium unemployment rate.
B)fall below the equilibrium unemployment rate.
C)be equal to the equilibrium unemployment rate.
D)be zero.
فتح الحزمة
افتح القفل للوصول البطاقات البالغ عددها 149 في هذه المجموعة.
فتح الحزمة
k this deck
32
Suppose that an economy is in a recession. You would expect to see real GDP:
A)rise above potential GDP.
B)be equal to potential GDP.
C)fall below potential GDP.
D)and nominal GDP unchanged.
A)rise above potential GDP.
B)be equal to potential GDP.
C)fall below potential GDP.
D)and nominal GDP unchanged.
فتح الحزمة
افتح القفل للوصول البطاقات البالغ عددها 149 في هذه المجموعة.
فتح الحزمة
k this deck
33
Suppose that an economy is overheating. You would expect to see real GDP:
A)rise above potential GDP.
B)be equal to potential GDP.
C)fall below potential GDP.
D)and nominal GDP unchanged.
A)rise above potential GDP.
B)be equal to potential GDP.
C)fall below potential GDP.
D)and nominal GDP unchanged.
فتح الحزمة
افتح القفل للوصول البطاقات البالغ عددها 149 في هذه المجموعة.
فتح الحزمة
k this deck
34
The output gap allows us to capture:
A)changes in inflation from the long-run level of inflation.
B)the economy's deviations from the neutral interest rate.
C)increases in unemployment.
D)the economy's deviations from potential GDP.
A)changes in inflation from the long-run level of inflation.
B)the economy's deviations from the neutral interest rate.
C)increases in unemployment.
D)the economy's deviations from potential GDP.
فتح الحزمة
افتح القفل للوصول البطاقات البالغ عددها 149 في هذه المجموعة.
فتح الحزمة
k this deck
35
If an economy has a positive output gap of 3%, this means:
A)unemployment is 3% above the natural rate of unemployment.
B)GDP is 3% above potential GDP.
C)inflation is 3% above the long-run rate of inflation.
D)GDP is 3% below potential GDP.
A)unemployment is 3% above the natural rate of unemployment.
B)GDP is 3% above potential GDP.
C)inflation is 3% above the long-run rate of inflation.
D)GDP is 3% below potential GDP.
فتح الحزمة
افتح القفل للوصول البطاقات البالغ عددها 149 في هذه المجموعة.
فتح الحزمة
k this deck
36
If an economy has a positive output gap of 1.5%, this means:
A)unemployment is 1.5% above the natural rate of unemployment.
B)GDP is 1.5% above potential GDP.
C)inflation is 1.5% above the long-run rate of inflation.
D)GDP is 1.5% below potential GDP.
A)unemployment is 1.5% above the natural rate of unemployment.
B)GDP is 1.5% above potential GDP.
C)inflation is 1.5% above the long-run rate of inflation.
D)GDP is 1.5% below potential GDP.
فتح الحزمة
افتح القفل للوصول البطاقات البالغ عددها 149 في هذه المجموعة.
فتح الحزمة
k this deck
37
If an economy has a negative output gap of 2%, this means:
A)unemployment is 2% above the natural rate of unemployment.
B)GDP is 2% above potential GDP.
C)inflation is 2% above the long-run rate of inflation.
D)GDP is 2% below potential GDP.
A)unemployment is 2% above the natural rate of unemployment.
B)GDP is 2% above potential GDP.
C)inflation is 2% above the long-run rate of inflation.
D)GDP is 2% below potential GDP.
فتح الحزمة
افتح القفل للوصول البطاقات البالغ عددها 149 في هذه المجموعة.
فتح الحزمة
k this deck
38
If an economy has a positive output gap of 2.75%, this means:
A)unemployment is 2.75% above the natural rate of unemployment.
B)GDP is 2.75% above potential GDP.
C)inflation is 2.75% above the long-run rate of inflation.
D)GDP is 2.75% below potential GDP.
A)unemployment is 2.75% above the natural rate of unemployment.
B)GDP is 2.75% above potential GDP.
C)inflation is 2.75% above the long-run rate of inflation.
D)GDP is 2.75% below potential GDP.
فتح الحزمة
افتح القفل للوصول البطاقات البالغ عددها 149 في هذه المجموعة.
فتح الحزمة
k this deck
39
If an economy has an output gap of 0%, this means:
A)inflation is 0%.
B)unemployment is 0%.
C)actual GDP is at potential GDP.
D)the neutral rate of interest is at 0%.
A)inflation is 0%.
B)unemployment is 0%.
C)actual GDP is at potential GDP.
D)the neutral rate of interest is at 0%.
فتح الحزمة
افتح القفل للوصول البطاقات البالغ عددها 149 في هذه المجموعة.
فتح الحزمة
k this deck
40
If an economy has an output gap of 0%, this means the economy is:
A)experiencing cyclical unemployment.
B)unsustainable in the long run.
C)at its highest sustainable rate of production.
D)suffering from hyperinflation.
A)experiencing cyclical unemployment.
B)unsustainable in the long run.
C)at its highest sustainable rate of production.
D)suffering from hyperinflation.
فتح الحزمة
افتح القفل للوصول البطاقات البالغ عددها 149 في هذه المجموعة.
فتح الحزمة
k this deck
41
Economic expansions:
A)are always equal in length to economic contractions.
B)are sharp.
C)cannot last more than five years.
D)do not last forever due to adverse shocks.
A)are always equal in length to economic contractions.
B)are sharp.
C)cannot last more than five years.
D)do not last forever due to adverse shocks.
فتح الحزمة
افتح القفل للوصول البطاقات البالغ عددها 149 في هذه المجموعة.
فتح الحزمة
k this deck
42
According to Okun's rule of thumb, for every 1% fall in the actual output below potential output, the unemployment rate:
A)rises by 1%.
B)falls by 1%.
C)rises by 0.5%.
D)falls by 0.5%.
A)rises by 1%.
B)falls by 1%.
C)rises by 0.5%.
D)falls by 0.5%.
فتح الحزمة
افتح القفل للوصول البطاقات البالغ عددها 149 في هذه المجموعة.
فتح الحزمة
k this deck
43
If the Turkish Central Bank forecasts a negative output gap, you can reasonably expect _____ on the horizon.
A)deflation
B)excess demand
C)high demand for labor
D)rising consumer confidence
A)deflation
B)excess demand
C)high demand for labor
D)rising consumer confidence
فتح الحزمة
افتح القفل للوصول البطاقات البالغ عددها 149 في هذه المجموعة.
فتح الحزمة
k this deck
44
If the Turkish Central Bank forecasts a positive output gap, you can reasonably expect _____ on the horizon.
A)deflation
B)very low demand
C)falling business confidence
D)rising consumer confidence
A)deflation
B)very low demand
C)falling business confidence
D)rising consumer confidence
فتح الحزمة
افتح القفل للوصول البطاقات البالغ عددها 149 في هذه المجموعة.
فتح الحزمة
k this deck
45
The Great Moderation refers to the:
A)stable level of inflation in the United States.
B)increase in globalization.
C)decreased volatility of the U.S. economy.
D)longstanding effect of the Great Recession.
A)stable level of inflation in the United States.
B)increase in globalization.
C)decreased volatility of the U.S. economy.
D)longstanding effect of the Great Recession.
فتح الحزمة
افتح القفل للوصول البطاقات البالغ عددها 149 في هذه المجموعة.
فتح الحزمة
k this deck
46
Which of the following is a reason for the Great Moderation?
A)Global demand for U.S. goods and services
B)The 2007 to 2009 Great Recession
C)Stagflation during the 1970s
D)Fiscal policy lags
A)Global demand for U.S. goods and services
B)The 2007 to 2009 Great Recession
C)Stagflation during the 1970s
D)Fiscal policy lags
فتح الحزمة
افتح القفل للوصول البطاقات البالغ عددها 149 في هذه المجموعة.
فتح الحزمة
k this deck
47
Which of the following is a reason for the Great Moderation?
A)Increased effectiveness of Federal Reserve policy
B)Decreased business confidence
C)Politics
D)Fiscal policy lags
A)Increased effectiveness of Federal Reserve policy
B)Decreased business confidence
C)Politics
D)Fiscal policy lags
فتح الحزمة
افتح القفل للوصول البطاقات البالغ عددها 149 في هذه المجموعة.
فتح الحزمة
k this deck
48
Leading indicators are variables that:
A)reflect the effects of monetary policy.
B)tend to predict the future state of the economy.
C)follow the business cycle with a delay.
D)reflect the effects of fiscal policy.
A)reflect the effects of monetary policy.
B)tend to predict the future state of the economy.
C)follow the business cycle with a delay.
D)reflect the effects of fiscal policy.
فتح الحزمة
افتح القفل للوصول البطاقات البالغ عددها 149 في هذه المجموعة.
فتح الحزمة
k this deck
49
Lagging indicators are variables that:
A)predict monetary policy.
B)tend to predict the future state of the economy.
C)follow the business cycle with a delay.
D)predict fiscal policy.
A)predict monetary policy.
B)tend to predict the future state of the economy.
C)follow the business cycle with a delay.
D)predict fiscal policy.
فتح الحزمة
افتح القفل للوصول البطاقات البالغ عددها 149 في هذه المجموعة.
فتح الحزمة
k this deck
50
An example of a leading indicator is:
A)tariffs.
B)college enrollment.
C)unemployment.
D)business confidence.
A)tariffs.
B)college enrollment.
C)unemployment.
D)business confidence.
فتح الحزمة
افتح القفل للوصول البطاقات البالغ عددها 149 في هذه المجموعة.
فتح الحزمة
k this deck
51
An example of a leading indicator is:
A)nonfarm payrolls.
B)unemployment insurance claims.
C)unemployment.
D)the stock market.
A)nonfarm payrolls.
B)unemployment insurance claims.
C)unemployment.
D)the stock market.
فتح الحزمة
افتح القفل للوصول البطاقات البالغ عددها 149 في هذه المجموعة.
فتح الحزمة
k this deck
52
An example of a lagging indicator is:
A)consumer confidence.
B)unemployment insurance claims.
C)business confidence.
D)the stock market.
A)consumer confidence.
B)unemployment insurance claims.
C)business confidence.
D)the stock market.
فتح الحزمة
افتح القفل للوصول البطاقات البالغ عددها 149 في هذه المجموعة.
فتح الحزمة
k this deck
53
An example of a lagging indicator is:
A)consumer confidence.
B)business confidence.
C)unemployment.
D)the stock market.
A)consumer confidence.
B)business confidence.
C)unemployment.
D)the stock market.
فتح الحزمة
افتح القفل للوصول البطاقات البالغ عددها 149 في هذه المجموعة.
فتح الحزمة
k this deck
54
Based on Okun's rule of thumb, if you forecast that the output gap will decline from 0% to -3%, the unemployment rate will:
A)rise by 1.5%.
B)fall by 2%.
C)rise by 3%.
D)fall by 1.5%.
A)rise by 1.5%.
B)fall by 2%.
C)rise by 3%.
D)fall by 1.5%.
فتح الحزمة
افتح القفل للوصول البطاقات البالغ عددها 149 في هذه المجموعة.
فتح الحزمة
k this deck
55
Based on Okun's rule of thumb, if you forecast that the output gap will decline from -2% to -4%, the unemployment rate will:
A)fall by 2%.
B)fall by 1%.
C)rise by 2%.
D)rise by 1%.
A)fall by 2%.
B)fall by 1%.
C)rise by 2%.
D)rise by 1%.
فتح الحزمة
افتح القفل للوصول البطاقات البالغ عددها 149 في هذه المجموعة.
فتح الحزمة
k this deck
56
Based on Okun's rule of thumb, if you forecast that the output gap will decline from -2% to -3%, the unemployment rate will:
A)fall by 1%.
B)rise by 1.5%.
C)rise by 1%.
D)rise by 0.5%.
A)fall by 1%.
B)rise by 1.5%.
C)rise by 1%.
D)rise by 0.5%.
فتح الحزمة
افتح القفل للوصول البطاقات البالغ عددها 149 في هذه المجموعة.
فتح الحزمة
k this deck
57
Based on Okun's rule of thumb, if you forecast that the output gap will decline from -1% to -3%, the unemployment rate will:
A)fall by 1%.
B)rise by 2%.
C)rise by 1%.
D)rise by 0.5%.
A)fall by 1%.
B)rise by 2%.
C)rise by 1%.
D)rise by 0.5%.
فتح الحزمة
افتح القفل للوصول البطاقات البالغ عددها 149 في هذه المجموعة.
فتح الحزمة
k this deck
58
Which economic indicator tells you how fast the economy is growing?
A)The level of real GDP
B)Real GDP growth
C)Nonfarm payrolls
D)The employment cost index
A)The level of real GDP
B)Real GDP growth
C)Nonfarm payrolls
D)The employment cost index
فتح الحزمة
افتح القفل للوصول البطاقات البالغ عددها 149 في هذه المجموعة.
فتح الحزمة
k this deck
59
Which economic indicator tells you how fast wages and benefits are rising?
A)S&P 500
B)Business confidence
C)Nonfarm payrolls
D)The employment cost index
A)S&P 500
B)Business confidence
C)Nonfarm payrolls
D)The employment cost index
فتح الحزمة
افتح القفل للوصول البطاقات البالغ عددها 149 في هذه المجموعة.
فتح الحزمة
k this deck
60
Which economic indicator would you expect will decrease continuously as the economy grows?
A)Unemployment
B)Real GDP growth
C)Nonfarm payrolls
D)Consumer confidence
A)Unemployment
B)Real GDP growth
C)Nonfarm payrolls
D)Consumer confidence
فتح الحزمة
افتح القفل للوصول البطاقات البالغ عددها 149 في هذه المجموعة.
فتح الحزمة
k this deck
61
Which economic indicator accounts for changes in the composition of the workforce?
A)The level of real GDP
B)Real GDP growth
C)Nonfarm payrolls
D)The employment cost index
A)The level of real GDP
B)Real GDP growth
C)Nonfarm payrolls
D)The employment cost index
فتح الحزمة
افتح القفل للوصول البطاقات البالغ عددها 149 في هذه المجموعة.
فتح الحزمة
k this deck
62
Which economic indicator tracks the value of 500 publicly traded firms?
A)S&P 500
B)Business confidence
C)Nonfarm payrolls
D)The employment cost index
A)S&P 500
B)Business confidence
C)Nonfarm payrolls
D)The employment cost index
فتح الحزمة
افتح القفل للوصول البطاقات البالغ عددها 149 في هذه المجموعة.
فتح الحزمة
k this deck
63
Which economic indicator tells you about the future expected profits of businesses?
A)S&P 500
B)Consumer price index
C)Nonfarm payrolls
D)Initial unemployment claims
A)S&P 500
B)Consumer price index
C)Nonfarm payrolls
D)Initial unemployment claims
فتح الحزمة
افتح القفل للوصول البطاقات البالغ عددها 149 في هذه المجموعة.
فتح الحزمة
k this deck
64
Which economic indicator will tell you whether real wages will rise or fall?
A)Initial unemployment claims
B)Consumer confidence
C)S&P 500
D)Consumer price index
A)Initial unemployment claims
B)Consumer confidence
C)S&P 500
D)Consumer price index
فتح الحزمة
افتح القفل للوصول البطاقات البالغ عددها 149 في هذه المجموعة.
فتح الحزمة
k this deck
65
Which of the following indicators might be a good predictor of investment?
A)Initial unemployment claims
B)Consumer confidence
C)Business confidence
D)Nonfarm payrolls
A)Initial unemployment claims
B)Consumer confidence
C)Business confidence
D)Nonfarm payrolls
فتح الحزمة
افتح القفل للوصول البطاقات البالغ عددها 149 في هذه المجموعة.
فتح الحزمة
k this deck
66
Refer to the following table. What was the approximate output gap in 1995?
A)-3%
B)-3.6%
C)1.2%
D)3%
A)-3%
B)-3.6%
C)1.2%
D)3%
فتح الحزمة
افتح القفل للوصول البطاقات البالغ عددها 149 في هذه المجموعة.
فتح الحزمة
k this deck
67
Refer to the following table. What was the approximate output gap in 1996?
A)3%
B)-5.5%
C)1.2%
D)-1.2%
A)3%
B)-5.5%
C)1.2%
D)-1.2%
فتح الحزمة
افتح القفل للوصول البطاقات البالغ عددها 149 في هذه المجموعة.
فتح الحزمة
k this deck
68
Refer to the following table. What was the approximate output gap in 1997?
A)1.9%
B)1.2%
C)-3.6%
D)3%
A)1.9%
B)1.2%
C)-3.6%
D)3%
فتح الحزمة
افتح القفل للوصول البطاقات البالغ عددها 149 في هذه المجموعة.
فتح الحزمة
k this deck
69
Refer to the following table. What was the approximate output gap in 1998?
A)3%
B)-5.5%
C)1.2%
D)-1.2%
A)3%
B)-5.5%
C)1.2%
D)-1.2%
فتح الحزمة
افتح القفل للوصول البطاقات البالغ عددها 149 في هذه المجموعة.
فتح الحزمة
k this deck
70
Refer to the following table. What was the approximate output gap in 1999?
A)1.9%
B)1.2%
C)-3.6%
D)3%
A)1.9%
B)1.2%
C)-3.6%
D)3%
فتح الحزمة
افتح القفل للوصول البطاقات البالغ عددها 149 في هذه المجموعة.
فتح الحزمة
k this deck
71
Refer to the following table. In which year(s) was the economy above potential GDP?
A)1997 only
B)1999 only
C)1995, 1996, 1997, and 1998 only
D)1995 and 1996 only
A)1997 only
B)1999 only
C)1995, 1996, 1997, and 1998 only
D)1995 and 1996 only
فتح الحزمة
افتح القفل للوصول البطاقات البالغ عددها 149 في هذه المجموعة.
فتح الحزمة
k this deck
72
Refer to the following table. In which year(s) was the economy below potential GDP?
A)1997 only
B)1999 only
C)1995, 1996, 1997, and 1998
D)1995 and 1996 only
A)1997 only
B)1999 only
C)1995, 1996, 1997, and 1998
D)1995 and 1996 only
فتح الحزمة
افتح القفل للوصول البطاقات البالغ عددها 149 في هذه المجموعة.
فتح الحزمة
k this deck
73
Refer to the following table. What was the approximate output gap in 1970?
A)3.3%
B)2.1%
C)6.1%
D)-6.5%
A)3.3%
B)2.1%
C)6.1%
D)-6.5%
فتح الحزمة
افتح القفل للوصول البطاقات البالغ عددها 149 في هذه المجموعة.
فتح الحزمة
k this deck
74
Refer to the following table. What was the approximate output gap in 1971?
A)3.3%
B)2.1%
C)6.1%
D)-6.5%
A)3.3%
B)2.1%
C)6.1%
D)-6.5%
فتح الحزمة
افتح القفل للوصول البطاقات البالغ عددها 149 في هذه المجموعة.
فتح الحزمة
k this deck
75
Refer to the following table. What was the approximate output gap in 1972?
A)3.3%
B)2.1%
C)6.1%
D)-6.5%
A)3.3%
B)2.1%
C)6.1%
D)-6.5%
فتح الحزمة
افتح القفل للوصول البطاقات البالغ عددها 149 في هذه المجموعة.
فتح الحزمة
k this deck
76
Refer to the following table. What was the approximate output gap in 1973?
A)6.1%
B)2.1%
C)4.8%
D)-6.5%
A)6.1%
B)2.1%
C)4.8%
D)-6.5%
فتح الحزمة
افتح القفل للوصول البطاقات البالغ عددها 149 في هذه المجموعة.
فتح الحزمة
k this deck
77
Refer to the following table. What was the approximate output gap in 1974?
A)3.3%
B)2.1%
C)6.1%
D)-6.5%
A)3.3%
B)2.1%
C)6.1%
D)-6.5%
فتح الحزمة
افتح القفل للوصول البطاقات البالغ عددها 149 في هذه المجموعة.
فتح الحزمة
k this deck
78
Refer to the following table. In which year(s) was the economy above potential GDP?
A)1970, 1971, 1972, and 1973 only
B)1974 only
C)1970 and 1971 only
D)1973 and 1974 only
A)1970, 1971, 1972, and 1973 only
B)1974 only
C)1970 and 1971 only
D)1973 and 1974 only
فتح الحزمة
افتح القفل للوصول البطاقات البالغ عددها 149 في هذه المجموعة.
فتح الحزمة
k this deck
79
Refer to the following table. In which year(s) was the economy below potential GDP?
A)1970, 1971, 1972, and 1973 only
B)1974 only
C)1970 and 1971 only
D)1973 and 1974 only
A)1970, 1971, 1972, and 1973 only
B)1974 only
C)1970 and 1971 only
D)1973 and 1974 only
فتح الحزمة
افتح القفل للوصول البطاقات البالغ عددها 149 في هذه المجموعة.
فتح الحزمة
k this deck
80
Refer to the following table. What was the approximate output gap in 1980?
A)0.5%
B)1%
C)-2.2%
D)-1.6%
A)0.5%
B)1%
C)-2.2%
D)-1.6%
فتح الحزمة
افتح القفل للوصول البطاقات البالغ عددها 149 في هذه المجموعة.
فتح الحزمة
k this deck
فتح الحزمة
افتح القفل للوصول البطاقات البالغ عددها 149 في هذه المجموعة.


