Deck 3: Basic Statistics
ملء الشاشة (f)
سؤال
سؤال
سؤال
سؤال
سؤال
سؤال
سؤال
سؤال
سؤال
سؤال
سؤال
سؤال
سؤال
سؤال
سؤال
سؤال
سؤال
سؤال
سؤال
سؤال
سؤال
سؤال
سؤال
سؤال
سؤال
سؤال
سؤال
سؤال
سؤال
سؤال
سؤال
سؤال
سؤال
سؤال
سؤال
سؤال
سؤال
سؤال
سؤال
سؤال
سؤال
سؤال
سؤال
سؤال
سؤال
سؤال
سؤال
سؤال
سؤال
سؤال
سؤال
سؤال
سؤال
سؤال
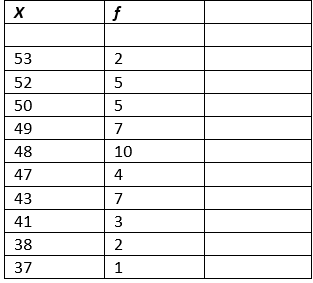
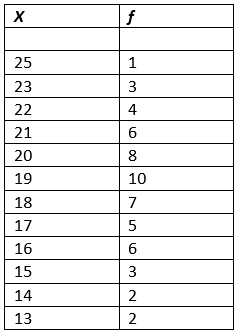
Calculate the mean for the simple frequency distribution below.
سؤال
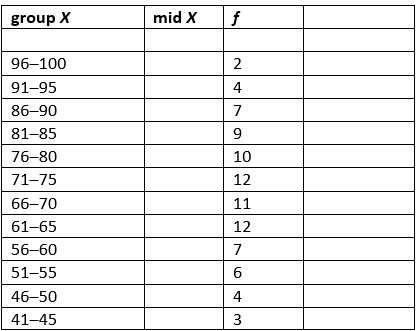
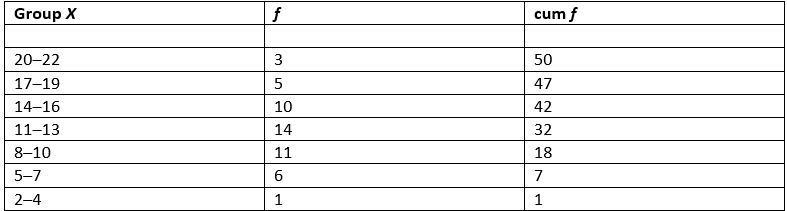
Calculate the mean for the data listed below in the grouped frequency distribution.
سؤال
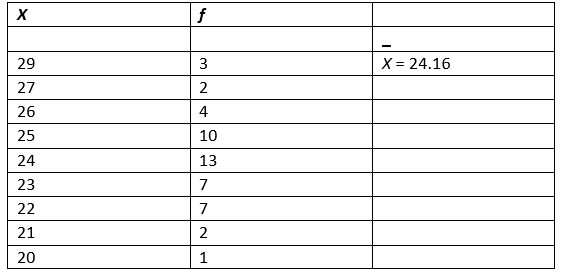
For the following set of data representing basketball shots made in one minute, calculate the standard deviation.
سؤال
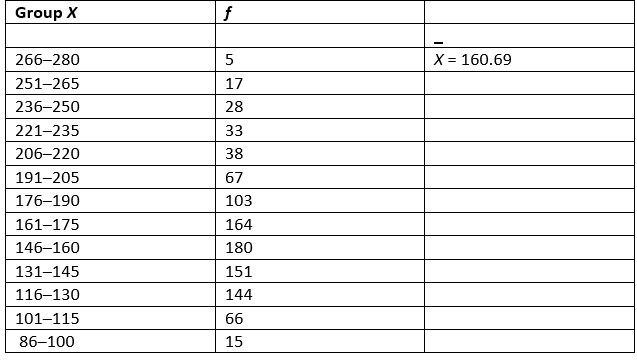
From the data below on the 600-yard walk-run test (time in seconds), calculate the standard deviation.
سؤال
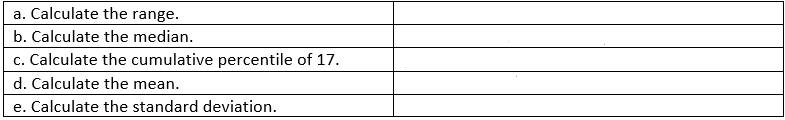
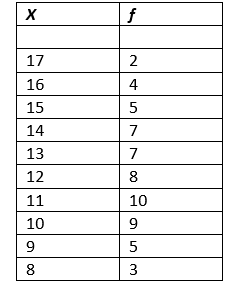
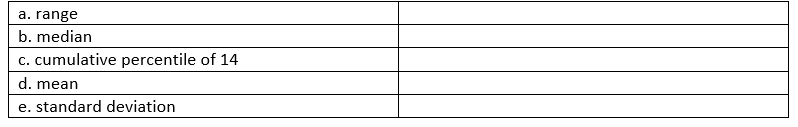
For the data listed below, complete the following:
سؤال
-Using the set of data above, what is the exact percentile rank of the score of 10?
سؤال
-Using the set of data above, what is the score corresponding to the percentile rank of 70%?
سؤال
-Given a set of data with a mean of 25.7 and standard deviation of 5.2, calculate the z-score of the following raw scores.

سؤال
-Using the normal distribution table in your textbook, what is the equivalent percentile rank of each of the scores above?
سؤال
-Calculate the T-scores for the raw scores listed in #3.
سؤال
-What percentage of scores is higher than a z-score of .34?
سؤال
-What percentage of scores lies between the z-scores of −.12 and .75?
سؤال
-What percentage of scores lies between the z-scores of .33 and 2.15?
سؤال
-What percentage of scores lies between the z-scores of −.15 and −.75?
سؤال
-In a 100-meter run, a sprinter covered the distance in 10.5 seconds. Out of thirty sprinters, the mean time was 10.9 seconds and the standard deviation was .30 seconds. What is the equivalent z-score for this performance?
سؤال
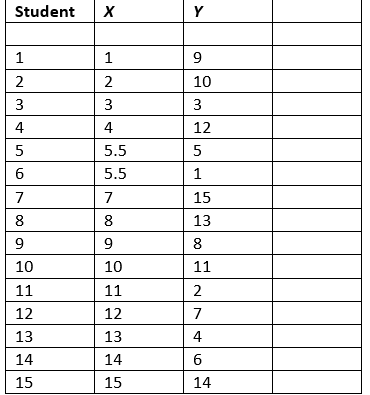
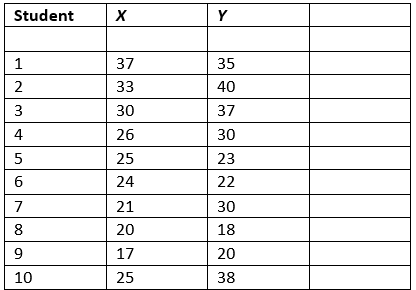
A physical education instructor administered a leadership aptitude survey and ranked the scores (X) of the 15 students. A tennis tournament was held for the same students and their order of finish is shown below (Y). Calculate the correlation between leadership aptitude and the finish in the tennis tournament.
سؤال
A group was tested to see how many sit-ups could be executed in 30 seconds. They were tested on Wednesday and again on Friday to check the reliability of the scores. Calculate the correlation coefficients for the two sets of sit-up scores.
سؤال
-For the data listed above, find the following:
سؤال
-What score from a group of scores having a mean of 25 and a standard deviation of 6 corresponds to a z-score of −1.5?
سؤال
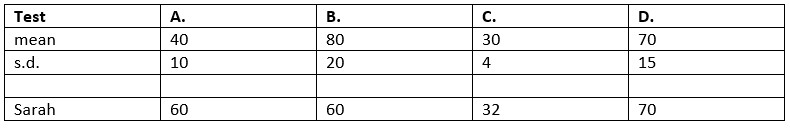
-On which of the following tests did Sarah perform best?
سؤال
-A pupil obtains a raw score of 41 on a test with a mean of 50 and a standard deviation of 6. What is the corresponding T-score?
سؤال
-What T-score value is associated with a raw score of 15 from a group of scores having a mean of 25 and a standard deviation of 10?
سؤال
-Approximately what percentile rank is associated with a score located one standard deviation above the mean in a normal distribution?
سؤال
سؤال
-A student runs the 50-yard dash in 6.1 seconds. If the mean is 6.52 and the standard deviation is .25, what is the student's z-score?
سؤال
-If 40 of the 120 scores in a distribution fall below a score of 50, what is the percentile rank of this score?
سؤال
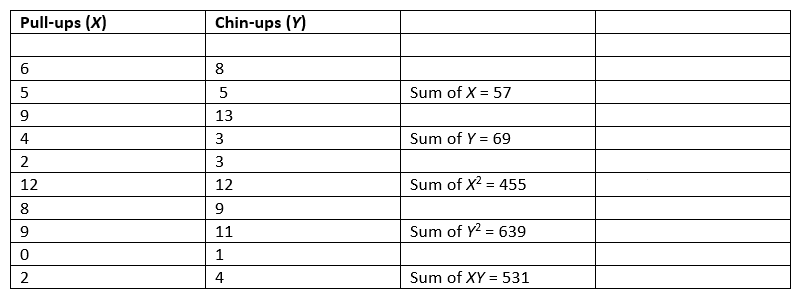
-For the data listed below, calculate the correlation coefficient between pull-ups and chin-ups using the appropriate statistical method.

فتح الحزمة
قم بالتسجيل لفتح البطاقات في هذه المجموعة!
Unlock Deck
Unlock Deck
1/81
العب
ملء الشاشة (f)
Deck 3: Basic Statistics
1
Slight changes in some scores will probably not affect the:
A) mean.
B) standard deviation.
C) median.
D) variance.
E) standard score.
A) mean.
B) standard deviation.
C) median.
D) variance.
E) standard score.
C
2
A basketball team played ten games at home, ten games on the road, and 12 games on a neutral court. The coach wanted to know if there was a statistically significant difference in the offensive point production in the three settings. To make this determination, the appropriate statistical test would be:
A) t-test for independent samples.
B) t-test for dependent samples.
C) simple analysis of variance.
D) two-way analysis of variance.
E) multiple regression analysis.
A) t-test for independent samples.
B) t-test for dependent samples.
C) simple analysis of variance.
D) two-way analysis of variance.
E) multiple regression analysis.
C
3
Three groups of adult women engaged in a 12-week exercise program designed to help them lose weight. Group A participated in aerobic dance five times weekly, Group B did resistance weight training five times weekly, and Group C did aerobic dance three times weekly and resistance weight training twice a week. At the start and the end of the exercise program, the exercise leader weighed the participants and recorded their weights. To ascertain if there were statistically significant differences in
A) t-test for independent samples.
B) t-test for dependent samples.
C) simple analysis of variance.
D) two-way analysis of variance.
E) multiple regression analysis.
A) t-test for independent samples.
B) t-test for dependent samples.
C) simple analysis of variance.
D) two-way analysis of variance.
E) multiple regression analysis.
D
4
A group of students completes the 12-minute run prior to a six-week jogging unit. At the end of the unit, the 12-minute run test is administered a second time. The instructor is interested in knowing if there is a statistically significant difference in the results of the two tests. To answer this question, the appropriate statistical test would be:
A) t-test for independent samples.
B) t-test for dependent samples.
C) simple analysis of variance.
D) two-way analysis of variance.
E) multiple regression analysis.
A) t-test for independent samples.
B) t-test for dependent samples.
C) simple analysis of variance.
D) two-way analysis of variance.
E) multiple regression analysis.
فتح الحزمة
افتح القفل للوصول البطاقات البالغ عددها 81 في هذه المجموعة.
فتح الحزمة
k this deck
5
A correlation coefficient of −.68 was calculated between body weight and the number of push-ups a person can do. Which statement would be most correct?
A) Generally, heavy people can do few push-ups.
B) Obesity causes it to be difficult to do push-ups.
C) Generally, lighter people can do fewer push-ups.
D) Low body weight is related with low push-up scores.
E) High body weight is related with high push-up scores.
A) Generally, heavy people can do few push-ups.
B) Obesity causes it to be difficult to do push-ups.
C) Generally, lighter people can do fewer push-ups.
D) Low body weight is related with low push-up scores.
E) High body weight is related with high push-up scores.
فتح الحزمة
افتح القفل للوصول البطاقات البالغ عددها 81 في هذه المجموعة.
فتح الحزمة
k this deck
6
Which of these correlation coefficients indicates the smallest amount of shared variance?
A) +0.91
B) −0.47
C) −1.23
D) +0.17
E) +1.33
A) +0.91
B) −0.47
C) −1.23
D) +0.17
E) +1.33
فتح الحزمة
افتح القفل للوصول البطاقات البالغ عددها 81 في هذه المجموعة.
فتح الحزمة
k this deck
7
The correlation between Tests A and B is .34. The correlation between Tests A and C is .68. Which of the following statements is correct?
A) The relationship between A and C is twice as strong as the relationship between A and B.
B) The relationship between A and C is higher than the relationship between A and B.
C) A student receiving a high score on Test A will receive a higher score on Test C than on Test B.
D) Tests A and C measure the same ability.
E) A student will score about the same on Test B and Test C.
فتح الحزمة
افتح القفل للوصول البطاقات البالغ عددها 81 في هذه المجموعة.
فتح الحزمة
k this deck
8
If there is a negative relationship between two physical measures:
A) the relationship is quite small.
B) the two physical measures are unrelated.
C) the value of one measure decreases as the value of the other decreases.
D) the value of one measure increases as the value of the other decreases.
E) none of the above statements are correct.
A) the relationship is quite small.
B) the two physical measures are unrelated.
C) the value of one measure decreases as the value of the other decreases.
D) the value of one measure increases as the value of the other decreases.
E) none of the above statements are correct.
فتح الحزمة
افتح القفل للوصول البطاقات البالغ عددها 81 في هذه المجموعة.
فتح الحزمة
k this deck
9
If a normal distribution of scores has a mean of 55 and a standard deviation of 10, what range of values would contain 99.73% of the scores?
A) 25-85
B) 35-75
C) 30-80
D) 45-65
E) not possible to determine from the information given.
A) 25-85
B) 35-75
C) 30-80
D) 45-65
E) not possible to determine from the information given.
فتح الحزمة
افتح القفل للوصول البطاقات البالغ عددها 81 في هذه المجموعة.
فتح الحزمة
k this deck
10
In a normal distribution having a mean of 53.0 and a standard deviation of 7.0, the estimated value of the median would likely be:
A) 46.0.
B) approximately the same as the mean.
C) 60
D) not possible to estimate from the information given.
A) 46.0.
B) approximately the same as the mean.
C) 60
D) not possible to estimate from the information given.
فتح الحزمة
افتح القفل للوصول البطاقات البالغ عددها 81 في هذه المجموعة.
فتح الحزمة
k this deck
11
The percentage of scores falling between the mean and a +1 deviation unit on a normal distribution is approximately:
A) 14%.
B) 34%.
C) 58%.
D) 68%.
E) 95%.
A) 14%.
B) 34%.
C) 58%.
D) 68%.
E) 95%.
فتح الحزمة
افتح القفل للوصول البطاقات البالغ عددها 81 في هذه المجموعة.
فتح الحزمة
k this deck
12
When using a two-way ANOVA, each subject must take the same test on two different occasions.
فتح الحزمة
افتح القفل للوصول البطاقات البالغ عددها 81 في هذه المجموعة.
فتح الحزمة
k this deck
13
When ratio data are involved, the following measure(s) of central tendency can be used:
A) mean and median.
B) mode and median.
C) mode, median, and mean.
D) mean only.
E) median only.
A) mean and median.
B) mode and median.
C) mode, median, and mean.
D) mean only.
E) median only.
فتح الحزمة
افتح القفل للوصول البطاقات البالغ عددها 81 في هذه المجموعة.
فتح الحزمة
k this deck
14
When ordinal data are involved, the following measure(s) of central tendency can be used:
A) mean and median.
B) mode and media.
C) mode, median, and mean.
D) mean only.
E) median only.
A) mean and median.
B) mode and media.
C) mode, median, and mean.
D) mean only.
E) median only.
فتح الحزمة
افتح القفل للوصول البطاقات البالغ عددها 81 في هذه المجموعة.
فتح الحزمة
k this deck
15
When a frequency distribution is severely skewed to the right,
A) the mode is the same as the mean.
B) the mean is the most appropriate measure of central tendency.
C) the mode is the most appropriate measure of central tendency.
D) the median and the mean will be approximately in the same place in the distribution.
E) the median is the most appropriate measure of central tendency.
فتح الحزمة
افتح القفل للوصول البطاقات البالغ عددها 81 في هذه المجموعة.
فتح الحزمة
k this deck
16
The sum of deviations around the mean:
A) is usually a negative number.
B) depends on the number of scores.
C) depends on the range of scores.
D) is one.
E) is zero.
A) is usually a negative number.
B) depends on the number of scores.
C) depends on the range of scores.
D) is one.
E) is zero.
فتح الحزمة
افتح القفل للوصول البطاقات البالغ عددها 81 في هذه المجموعة.
فتح الحزمة
k this deck
17
If nine scores have a mean of 11, what is the sum of the scores?
A) 121
B) 81
C) 99
D) 11
E) not possible to calculate from information given.
A) 121
B) 81
C) 99
D) 11
E) not possible to calculate from information given.
فتح الحزمة
افتح القفل للوصول البطاقات البالغ عددها 81 في هذه المجموعة.
فتح الحزمة
k this deck
18
Use the following data to answer this question: 10, 9, 7, 7, 6, 5, 4, 2, 1. What is the mode for this distribution?
A) 5
B) 6
C) 7
D) 5.5
E) not possible to calculate from information given.
A) 5
B) 6
C) 7
D) 5.5
E) not possible to calculate from information given.
فتح الحزمة
افتح القفل للوصول البطاقات البالغ عددها 81 في هذه المجموعة.
فتح الحزمة
k this deck
19
Use the following data to answer this question: 10, 9, 7, 7, 6, 5, 4, 2, 1. What is the median for this distribution?
A) 5
B) 6
C) 7
D) 5.5
E) not possible to calculate from information given.
A) 5
B) 6
C) 7
D) 5.5
E) not possible to calculate from information given.
فتح الحزمة
افتح القفل للوصول البطاقات البالغ عددها 81 في هذه المجموعة.
فتح الحزمة
k this deck
20
Use the following data to answer this question: 10, 9, 7, 7, 6, 5, 4, 2, 1. What measure of central tendency would change most if the highest score were 25 instead of 10?
A) range.
B) mean.
C) median.
D) mode.
E) standard deviation.
A) range.
B) mean.
C) median.
D) mode.
E) standard deviation.
فتح الحزمة
افتح القفل للوصول البطاقات البالغ عددها 81 في هذه المجموعة.
فتح الحزمة
k this deck
21
Use the following data to answer this question: 10, 9, 7, 7, 6, 5, 4, 2, 1. What is the rank of the score 7 in this distribution?
A) 2
B) 3
C) 3.5
D) 6
E) 4
A) 2
B) 3
C) 3.5
D) 6
E) 4
فتح الحزمة
افتح القفل للوصول البطاقات البالغ عددها 81 في هذه المجموعة.
فتح الحزمة
k this deck
22
When scores are to be handled in an ungrouped distribution, what is the recommended arrangement?
A) placed into high, middle, and low categories
B) depends on the type of test
C) similar scores placed next to each other
D) no particular arrangement is necessary
E) ordered from best to worst
A) placed into high, middle, and low categories
B) depends on the type of test
C) similar scores placed next to each other
D) no particular arrangement is necessary
E) ordered from best to worst
فتح الحزمة
افتح القفل للوصول البطاقات البالغ عددها 81 في هذه المجموعة.
فتح الحزمة
k this deck
23
The least important consideration factor in making the decision to work with data in a grouped or an ungrouped distribution is:
A) the availability of a hand calculator.
B) the number of data involved.
C) the test from which the data were obtained.
D) the degree of accuracy required.
E) the number of students taking the test.
A) the availability of a hand calculator.
B) the number of data involved.
C) the test from which the data were obtained.
D) the degree of accuracy required.
E) the number of students taking the test.
فتح الحزمة
افتح القفل للوصول البطاقات البالغ عددها 81 في هذه المجموعة.
فتح الحزمة
k this deck
24
The numbers on football jerseys are an example of the:
A) nominal scale.
B) ordinal scale.
C) interval scale.
D) ratio scale.
E) normative scale.
A) nominal scale.
B) ordinal scale.
C) interval scale.
D) ratio scale.
E) normative scale.
فتح الحزمة
افتح القفل للوصول البطاقات البالغ عددها 81 في هذه المجموعة.
فتح الحزمة
k this deck
25
A temperature of 98.6 degrees Fahrenheit is an example of the:
A) nominal scale.
B) ordinal scale.
C) interval scale.
D) ratio scale.
E) normative scale.
A) nominal scale.
B) ordinal scale.
C) interval scale.
D) ratio scale.
E) normative scale.
فتح الحزمة
افتح القفل للوصول البطاقات البالغ عددها 81 في هذه المجموعة.
فتح الحزمة
k this deck
26
Graphic presentation of data consisting of a series of bars or rectangles whose widths are the lengths of the data intervals and whose heights are the corresponding frequencies are appropriately referred to as:
A) histograms.
B) scattergrams.
C) frequency polygons.
D) ogive curves.
E) bar graphs.
A) histograms.
B) scattergrams.
C) frequency polygons.
D) ogive curves.
E) bar graphs.
فتح الحزمة
افتح القفل للوصول البطاقات البالغ عددها 81 في هذه المجموعة.
فتح الحزمة
k this deck
27
Testing four groups with a pretest and posttest would require the use of a two-way ANOVA statistic.
فتح الحزمة
افتح القفل للوصول البطاقات البالغ عددها 81 في هذه المجموعة.
فتح الحزمة
k this deck
28
Predicting a person's weight based on height, shoe size, and waist circumference would be an example of using a multiple regression formula.
فتح الحزمة
افتح القفل للوصول البطاقات البالغ عددها 81 في هذه المجموعة.
فتح الحزمة
k this deck
29
Multiple regression equations allow the user to predict multiple scores based on a single measurement.
فتح الحزمة
افتح القفل للوصول البطاقات البالغ عددها 81 في هذه المجموعة.
فتح الحزمة
k this deck
30
Data that are at the interval level of measurement are more precise than ratio-level data.
فتح الحزمة
افتح القفل للوصول البطاقات البالغ عددها 81 في هذه المجموعة.
فتح الحزمة
k this deck
31
Any change in any score of a group of data (N = 200) will change the value of the mean.
فتح الحزمة
افتح القفل للوصول البطاقات البالغ عددها 81 في هذه المجموعة.
فتح الحزمة
k this deck
32
The Pearson Product correlation procedure requires that data be at least ordinal in nature.
فتح الحزمة
افتح القفل للوصول البطاقات البالغ عددها 81 في هذه المجموعة.
فتح الحزمة
k this deck
33
The standard deviation is considered a descriptive statistic.
فتح الحزمة
افتح القفل للوصول البطاقات البالغ عددها 81 في هذه المجموعة.
فتح الحزمة
k this deck
34
The standard deviation is considered a terminal statistic.
فتح الحزمة
افتح القفل للوصول البطاقات البالغ عددها 81 في هذه المجموعة.
فتح الحزمة
k this deck
35
If all scores in a distribution are equal, the standard deviation would be zero.
فتح الحزمة
افتح القفل للوصول البطاقات البالغ عددها 81 في هذه المجموعة.
فتح الحزمة
k this deck
36
The mean should be used when reporting wages in order to avoid undue influence of extremes in salary.
فتح الحزمة
افتح القفل للوصول البطاقات البالغ عددها 81 في هذه المجموعة.
فتح الحزمة
k this deck
37
In order to make statements such as 8 units is twice as much as 4 units, the ratio scale of measurement is required.
فتح الحزمة
افتح القفل للوصول البطاقات البالغ عددها 81 في هذه المجموعة.
فتح الحزمة
k this deck
38
Lining students up according to height without actually measuring height represents the interval scale of measurement.
فتح الحزمة
افتح القفل للوصول البطاقات البالغ عددها 81 في هذه المجموعة.
فتح الحزمة
k this deck
39
A graphic representation of a distribution of scores that is skewed to the right is often normally distributed.
فتح الحزمة
افتح القفل للوصول البطاقات البالغ عددها 81 في هذه المجموعة.
فتح الحزمة
k this deck
40
The mode is representative of the 50th percentile.
فتح الحزمة
افتح القفل للوصول البطاقات البالغ عددها 81 في هذه المجموعة.
فتح الحزمة
k this deck
41
A simple ANOVA is a statistical measure used to determine differences between three sets of scores.
فتح الحزمة
افتح القفل للوصول البطاقات البالغ عددها 81 في هذه المجموعة.
فتح الحزمة
k this deck
42
A t-test can be used to determine statistically significant differences between two sets of scores.
فتح الحزمة
افتح القفل للوصول البطاقات البالغ عددها 81 في هذه المجموعة.
فتح الحزمة
k this deck
43
A t-test is a statistical measure that should be used when there is a high correlation between more than two sets of scores.
فتح الحزمة
افتح القفل للوصول البطاقات البالغ عددها 81 في هذه المجموعة.
فتح الحزمة
k this deck
44
A t-test is a statistical measure that should be used when there is a high correlation between two sets of scores.
فتح الحزمة
افتح القفل للوصول البطاقات البالغ عددها 81 في هذه المجموعة.
فتح الحزمة
k this deck
45
Percentile ranks are a form of standard score.
فتح الحزمة
افتح القفل للوصول البطاقات البالغ عددها 81 في هذه المجموعة.
فتح الحزمة
k this deck
46
Simple regression formulas should be developed when the correlation coefficient between two sets of scores falls between −.5 and +.5.
فتح الحزمة
افتح القفل للوصول البطاقات البالغ عددها 81 في هذه المجموعة.
فتح الحزمة
k this deck
47
High correlation coefficients never prove causation.
فتح الحزمة
افتح القفل للوصول البطاقات البالغ عددها 81 في هذه المجموعة.
فتح الحزمة
k this deck
48
A z-score of +1 is equivalent to a T-score of 50.
فتح الحزمة
افتح القفل للوصول البطاقات البالغ عددها 81 في هذه المجموعة.
فتح الحزمة
k this deck
49
Generally a T-score is derived from a z-score.
فتح الحزمة
افتح القفل للوصول البطاقات البالغ عددها 81 في هذه المجموعة.
فتح الحزمة
k this deck
50
Standard scores are an example of an ordinal level of measurement.
فتح الحزمة
افتح القفل للوصول البطاقات البالغ عددها 81 في هذه المجموعة.
فتح الحزمة
k this deck
51
Standard scores allow meaningful comparisons to be made from raw scores of different types of measurement.
فتح الحزمة
افتح القفل للوصول البطاقات البالغ عددها 81 في هذه المجموعة.
فتح الحزمة
k this deck
52
The standard deviation is a measure of the spread of the middle 50% of the scores.
فتح الحزمة
افتح القفل للوصول البطاقات البالغ عددها 81 في هذه المجموعة.
فتح الحزمة
k this deck
53
Calculate the mean for the data listed below.
53, 52, 50, 49, 48, 47, 43, 41, 38, 37
_
53, 52, 50, 49, 48, 47, 43, 41, 38, 37
_
فتح الحزمة
افتح القفل للوصول البطاقات البالغ عددها 81 في هذه المجموعة.
فتح الحزمة
k this deck
54
Calculate the mean for the simple frequency distribution below.
فتح الحزمة
افتح القفل للوصول البطاقات البالغ عددها 81 في هذه المجموعة.
فتح الحزمة
k this deck
55
Calculate the mean for the data listed below in the grouped frequency distribution.
فتح الحزمة
افتح القفل للوصول البطاقات البالغ عددها 81 في هذه المجموعة.
فتح الحزمة
k this deck
56
For the following set of data representing basketball shots made in one minute, calculate the standard deviation.
فتح الحزمة
افتح القفل للوصول البطاقات البالغ عددها 81 في هذه المجموعة.
فتح الحزمة
k this deck
57
From the data below on the 600-yard walk-run test (time in seconds), calculate the standard deviation.
فتح الحزمة
افتح القفل للوصول البطاقات البالغ عددها 81 في هذه المجموعة.
فتح الحزمة
k this deck
58
For the data listed below, complete the following:
فتح الحزمة
افتح القفل للوصول البطاقات البالغ عددها 81 في هذه المجموعة.
فتح الحزمة
k this deck
59
-Using the set of data above, what is the exact percentile rank of the score of 10?
فتح الحزمة
افتح القفل للوصول البطاقات البالغ عددها 81 في هذه المجموعة.
فتح الحزمة
k this deck
60
-Using the set of data above, what is the score corresponding to the percentile rank of 70%?
فتح الحزمة
افتح القفل للوصول البطاقات البالغ عددها 81 في هذه المجموعة.
فتح الحزمة
k this deck
61
-Given a set of data with a mean of 25.7 and standard deviation of 5.2, calculate the z-score of the following raw scores.
فتح الحزمة
افتح القفل للوصول البطاقات البالغ عددها 81 في هذه المجموعة.
فتح الحزمة
k this deck
62
-Using the normal distribution table in your textbook, what is the equivalent percentile rank of each of the scores above?
فتح الحزمة
افتح القفل للوصول البطاقات البالغ عددها 81 في هذه المجموعة.
فتح الحزمة
k this deck
63
-Calculate the T-scores for the raw scores listed in #3.
فتح الحزمة
افتح القفل للوصول البطاقات البالغ عددها 81 في هذه المجموعة.
فتح الحزمة
k this deck
64
-What percentage of scores is higher than a z-score of .34?
فتح الحزمة
افتح القفل للوصول البطاقات البالغ عددها 81 في هذه المجموعة.
فتح الحزمة
k this deck
65
-What percentage of scores lies between the z-scores of −.12 and .75?
فتح الحزمة
افتح القفل للوصول البطاقات البالغ عددها 81 في هذه المجموعة.
فتح الحزمة
k this deck
66
-What percentage of scores lies between the z-scores of .33 and 2.15?
فتح الحزمة
افتح القفل للوصول البطاقات البالغ عددها 81 في هذه المجموعة.
فتح الحزمة
k this deck
67
-What percentage of scores lies between the z-scores of −.15 and −.75?
فتح الحزمة
افتح القفل للوصول البطاقات البالغ عددها 81 في هذه المجموعة.
فتح الحزمة
k this deck
68
-In a 100-meter run, a sprinter covered the distance in 10.5 seconds. Out of thirty sprinters, the mean time was 10.9 seconds and the standard deviation was .30 seconds. What is the equivalent z-score for this performance?
فتح الحزمة
افتح القفل للوصول البطاقات البالغ عددها 81 في هذه المجموعة.
فتح الحزمة
k this deck
69
A physical education instructor administered a leadership aptitude survey and ranked the scores (X) of the 15 students. A tennis tournament was held for the same students and their order of finish is shown below (Y). Calculate the correlation between leadership aptitude and the finish in the tennis tournament.
فتح الحزمة
افتح القفل للوصول البطاقات البالغ عددها 81 في هذه المجموعة.
فتح الحزمة
k this deck
70
A group was tested to see how many sit-ups could be executed in 30 seconds. They were tested on Wednesday and again on Friday to check the reliability of the scores. Calculate the correlation coefficients for the two sets of sit-up scores.
فتح الحزمة
افتح القفل للوصول البطاقات البالغ عددها 81 في هذه المجموعة.
فتح الحزمة
k this deck
71
-For the data listed above, find the following:
فتح الحزمة
افتح القفل للوصول البطاقات البالغ عددها 81 في هذه المجموعة.
فتح الحزمة
k this deck
72
-What score from a group of scores having a mean of 25 and a standard deviation of 6 corresponds to a z-score of −1.5?
فتح الحزمة
افتح القفل للوصول البطاقات البالغ عددها 81 في هذه المجموعة.
فتح الحزمة
k this deck
73
-On which of the following tests did Sarah perform best?
فتح الحزمة
افتح القفل للوصول البطاقات البالغ عددها 81 في هذه المجموعة.
فتح الحزمة
k this deck
74
-A pupil obtains a raw score of 41 on a test with a mean of 50 and a standard deviation of 6. What is the corresponding T-score?
فتح الحزمة
افتح القفل للوصول البطاقات البالغ عددها 81 في هذه المجموعة.
فتح الحزمة
k this deck
75
-What T-score value is associated with a raw score of 15 from a group of scores having a mean of 25 and a standard deviation of 10?
فتح الحزمة
افتح القفل للوصول البطاقات البالغ عددها 81 في هذه المجموعة.
فتح الحزمة
k this deck
76
-Approximately what percentile rank is associated with a score located one standard deviation above the mean in a normal distribution?
فتح الحزمة
افتح القفل للوصول البطاقات البالغ عددها 81 في هذه المجموعة.
فتح الحزمة
k this deck
77
-Which of the following measures represents the highest degree of relative performance?
A) 75th percentile
B) T-score of 72
C) z-score of 1.5
D) raw score of 85 (mean = 78; s.d. = 8.3)
فتح الحزمة
افتح القفل للوصول البطاقات البالغ عددها 81 في هذه المجموعة.
فتح الحزمة
k this deck
78
-A student runs the 50-yard dash in 6.1 seconds. If the mean is 6.52 and the standard deviation is .25, what is the student's z-score?
فتح الحزمة
افتح القفل للوصول البطاقات البالغ عددها 81 في هذه المجموعة.
فتح الحزمة
k this deck
79
-If 40 of the 120 scores in a distribution fall below a score of 50, what is the percentile rank of this score?
فتح الحزمة
افتح القفل للوصول البطاقات البالغ عددها 81 في هذه المجموعة.
فتح الحزمة
k this deck
80
-For the data listed below, calculate the correlation coefficient between pull-ups and chin-ups using the appropriate statistical method.
فتح الحزمة
افتح القفل للوصول البطاقات البالغ عددها 81 في هذه المجموعة.
فتح الحزمة
k this deck
فتح الحزمة
افتح القفل للوصول البطاقات البالغ عددها 81 في هذه المجموعة.


