Deck 4: The Economic Theory of Pollution Control
ملء الشاشة (f)
سؤال
سؤال
سؤال
سؤال
سؤال
سؤال
سؤال
سؤال
سؤال
سؤال
سؤال
سؤال
سؤال
سؤال
سؤال
سؤال
سؤال
سؤال
سؤال
Figure 4A
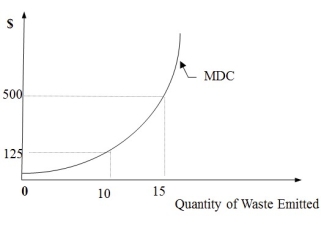
-Refer to Figure 4a. As we emit more waste,
A) We move from 15 to 5 on the x-axis
B) We move from 20 to 0 on the x-axis
C) We move from 0 to 50 on the y-axis
D) We move from 200 to 50 on the y-axis
E) None of the above
-Refer to Figure 4a. As we emit more waste,
A) We move from 15 to 5 on the x-axis
B) We move from 20 to 0 on the x-axis
C) We move from 0 to 50 on the y-axis
D) We move from 200 to 50 on the y-axis
E) None of the above
سؤال
سؤال
Figure 4B
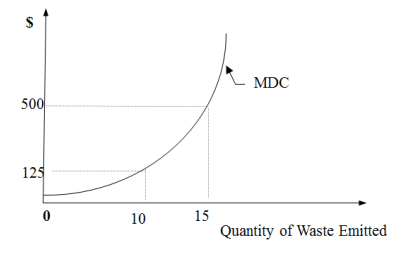
-Refer to Figure 4B. Which of the following is an incorrect description of the marginal pollution-damage cost curve?
A) Is an increasing function of pollution emissions
B) Shows that the damage caused by a unit of pollution increases progressively as the
amount of pollution emitted increases
C) The marginal damage cost increases from $125 to $500 as the amount of waste emissions
increases from 10 to 15 units
D) The marginal damage cost decreases from $125 to $500 as the amount of waste emissions
increases from 10 to 15 units
E) All of the above are incorrect
سؤال
Figure 4C
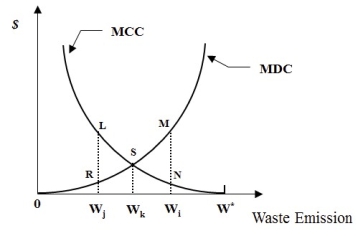
-Refer to Figure 4C. If waste emission is greater that Wk, then
A) The total waste disposal cost can be reduced by further controlling emissions
B) The total waste disposal cost can be reduced by allowing for more emissions
C) Movement in either direction along any curve would not be cost effective
D) The marginal damage curve must shift to the right
E) None of the above
سؤال
Figure 4C
-Refer to Figure 4C. If waste emission is less than Wk, then
A) The mcc must shift to the left
B) The optimal level of pollution has been achieved
C) The total waste disposal cost can be increase by allowing for more emissions
D) Movement in either direction along any curve would not be cost effective
E) The MDC must shift to the left
سؤال
سؤال

فتح الحزمة
قم بالتسجيل لفتح البطاقات في هذه المجموعة!
Unlock Deck
Unlock Deck
1/25
العب
ملء الشاشة (f)
Deck 4: The Economic Theory of Pollution Control
1
Waste disposal costs originate from two sources: pollution control cost and pollution
damage cost.
damage cost.
True
2
The implied trade-off in dealing with a pollution problem is between prevention and
damage costs.
damage costs.
False
3
Restoration of a river affected by acid rain is an example of a pollution control cost.
False
4
Unlike pollution damage costs, pollution control costs do not result in market distortions.
فتح الحزمة
افتح القفل للوصول البطاقات البالغ عددها 25 في هذه المجموعة.
فتح الحزمة
k this deck
5
With pollution control costs, there will be no difference between private and social costs.
فتح الحزمة
افتح القفل للوصول البطاقات البالغ عددها 25 في هذه المجموعة.
فتح الحزمة
k this deck
6
The costs of herbicidal run-offs into a river are an example of pollution damage costs.
فتح الحزمة
افتح القفل للوصول البطاقات البالغ عددها 25 في هذه المجموعة.
فتح الحزمة
k this deck
7
Pollution damage costs are identified in terms of the losses of or damage to plants and
animals, but not physical (man-made) infrastructures.
animals, but not physical (man-made) infrastructures.
فتح الحزمة
افتح القفل للوصول البطاقات البالغ عددها 25 في هذه المجموعة.
فتح الحزمة
k this deck
8
As to the extent possible, pollution damage costs should be expressed in monetary terms.
فتح الحزمة
افتح القفل للوصول البطاقات البالغ عددها 25 في هذه المجموعة.
فتح الحزمة
k this deck
9
The marginal pollution damage cost (MDC) curve damage cost curve measures the social
cost of the damage to the environment in monetary terms.
cost of the damage to the environment in monetary terms.
فتح الحزمة
افتح القفل للوصول البطاقات البالغ عددها 25 في هذه المجموعة.
فتح الحزمة
k this deck
10
The sloped marginal pollution damage cost (MDC) curve implies that the damage caused
by a unit of pollution remains constant as the amount of pollution emitted increases.
by a unit of pollution remains constant as the amount of pollution emitted increases.
فتح الحزمة
افتح القفل للوصول البطاقات البالغ عددها 25 في هذه المجموعة.
فتح الحزمة
k this deck
11
The sloped marginal pollution damage cost (MDC) curve implies that the damage caused
by a unit of pollution decreases progressively as the amount of pollution emitted
increases.
by a unit of pollution decreases progressively as the amount of pollution emitted
increases.
فتح الحزمة
افتح القفل للوصول البطاقات البالغ عددها 25 في هذه المجموعة.
فتح الحزمة
k this deck
12
Pollution damage costs are externalities, which mean that the costs are incurred by
members of a society before the pollution damages have already occurred.
members of a society before the pollution damages have already occurred.
فتح الحزمة
افتح القفل للوصول البطاقات البالغ عددها 25 في هذه المجموعة.
فتح الحزمة
k this deck
13
It is usually fairly straightforward to evaluate all aspects of pollution damage costs.
فتح الحزمة
افتح القفل للوصول البطاقات البالغ عددها 25 في هذه المجموعة.
فتح الحزمة
k this deck
14
Generally, damage costs are expected to be an increasing function of pollution.
فتح الحزمة
افتح القفل للوصول البطاقات البالغ عددها 25 في هذه المجموعة.
فتح الحزمة
k this deck
15
The optimal level of pollution is attained when the marginal control costs are equal to the
marginal damage costs.
marginal damage costs.
فتح الحزمة
افتح القفل للوصول البطاقات البالغ عددها 25 في هذه المجموعة.
فتح الحزمة
k this deck
16
From an economic viewpoint, expenditure on pollution control technology will make sense if
A) The environment is already burden with assimilating pollution
B) Waste disposal costs are low
C) Society is expected to be compensated by the benefits to be realized from the avoidance
Of environmental damage that worth's more than the expenditure
D) Society is expected to be compensated by the benefits to be realized from the avoidance
of environmental damage that worth's less than the expenditure
E) None of the above
فتح الحزمة
افتح القفل للوصول البطاقات البالغ عددها 25 في هذه المجموعة.
فتح الحزمة
k this deck
17
Examples of pollution control costs include:
A) Sequestering carbon dioxide from the atmosphere and placing it underground
B) Adding "scrubbers" (filters) on smokestacks
C) Removing dead fish from a lake ecosystem
D) None of the above
E) All of the above
A) Sequestering carbon dioxide from the atmosphere and placing it underground
B) Adding "scrubbers" (filters) on smokestacks
C) Removing dead fish from a lake ecosystem
D) None of the above
E) All of the above
فتح الحزمة
افتح القفل للوصول البطاقات البالغ عددها 25 في هذه المجموعة.
فتح الحزمة
k this deck
18
The marginal pollution control cost
A) Remains constant with increased environmental quality or cleanup activities
B) Decreases with increased environmental quality or cleanup activities
C) Is constructed by holding constant factors such as the technology of pollution control
D) Shifts up or down when we change the price (damage cost)
E) None of the above
فتح الحزمة
افتح القفل للوصول البطاقات البالغ عددها 25 في هذه المجموعة.
فتح الحزمة
k this deck
19
Figure 4A
-Refer to Figure 4a. As we emit more waste,
A) We move from 15 to 5 on the x-axis
B) We move from 20 to 0 on the x-axis
C) We move from 0 to 50 on the y-axis
D) We move from 200 to 50 on the y-axis
E) None of the above
-Refer to Figure 4a. As we emit more waste,
A) We move from 15 to 5 on the x-axis
B) We move from 20 to 0 on the x-axis
C) We move from 0 to 50 on the y-axis
D) We move from 200 to 50 on the y-axis
E) None of the above
فتح الحزمة
افتح القفل للوصول البطاقات البالغ عددها 25 في هذه المجموعة.
فتح الحزمة
k this deck
20
Pollution damage costs
A) Are the total non-monetary values of all the various damages resulting from the discharge
Of untreated waste into the environment
B) Usually do not depend on the amount and the nature of the untreated waste
C) Can include the destruction to aquatic plants
D) Do not arise from biodegradable pollutants
E) All of the above
فتح الحزمة
افتح القفل للوصول البطاقات البالغ عددها 25 في هذه المجموعة.
فتح الحزمة
k this deck
21
Figure 4B
-Refer to Figure 4B. Which of the following is an incorrect description of the marginal pollution-damage cost curve?
A) Is an increasing function of pollution emissions
B) Shows that the damage caused by a unit of pollution increases progressively as the
amount of pollution emitted increases
C) The marginal damage cost increases from $125 to $500 as the amount of waste emissions
increases from 10 to 15 units
D) The marginal damage cost decreases from $125 to $500 as the amount of waste emissions
increases from 10 to 15 units
E) All of the above are incorrect
فتح الحزمة
افتح القفل للوصول البطاقات البالغ عددها 25 في هذه المجموعة.
فتح الحزمة
k this deck
22
Figure 4C
-Refer to Figure 4C. If waste emission is greater that Wk, then
A) The total waste disposal cost can be reduced by further controlling emissions
B) The total waste disposal cost can be reduced by allowing for more emissions
C) Movement in either direction along any curve would not be cost effective
D) The marginal damage curve must shift to the right
E) None of the above
فتح الحزمة
افتح القفل للوصول البطاقات البالغ عددها 25 في هذه المجموعة.
فتح الحزمة
k this deck
23
Figure 4C
-Refer to Figure 4C. If waste emission is less than Wk, then
A) The mcc must shift to the left
B) The optimal level of pollution has been achieved
C) The total waste disposal cost can be increase by allowing for more emissions
D) Movement in either direction along any curve would not be cost effective
E) The MDC must shift to the left
فتح الحزمة
افتح القفل للوصول البطاقات البالغ عددها 25 في هذه المجموعة.
فتح الحزمة
k this deck
24
If more emphasis is put on pollution cleanup than on pollution prevention, then
A) One is arguing from a neoclassical economic perspective
B) One is arguing from an ecological economic perspective
C) This argument is consistent with both the neoclassical economic and ecological economic
perspectives
D) It is implied that the optimal level of pollution is always zero
E) None of the above
فتح الحزمة
افتح القفل للوصول البطاقات البالغ عددها 25 في هذه المجموعة.
فتح الحزمة
k this deck
25
Which of the following statements is least accurate?
A) Without considering the intrinsic value of the natural ecosystems, a divergence between
economically and ecologically optimum pollution may be inevitable
B) The economic estimate of the damage function is likely to overstate the welfare of the
future generations and the value of maintaining diversity
C) The standard neoclassical economic approach to pollution control is most likely to stress
pollution cleanup.
D) The ecological economic approach to pollution control is most likely to stress pollution
prevention
E) All of the above statements are inaccurate
فتح الحزمة
افتح القفل للوصول البطاقات البالغ عددها 25 في هذه المجموعة.
فتح الحزمة
k this deck
فتح الحزمة
افتح القفل للوصول البطاقات البالغ عددها 25 في هذه المجموعة.


